Evaluation of Design Flow Rate of Water Supply Systems with Low Flow Showering Appliances


Department of Building Services Engineering, The Hong Kong Polytechnic University, Hong Kong, China
*
Author to whom correspondence should be addressed.
Water 2019, 11(1), 100; https://doi.org/10.3390/w11010100
Submission received: 4 December 2018
/
Revised: 19 December 2018
/
Accepted: 28 December 2018
/
Published: 9 January 2019
(This article belongs to the Special Issue Water Sensitive Urban Design)
Abstract
:The installation of water efficient appliances is an efficient demand-side water management measure favored by policymakers and water providers nowadays. The adoption of low flow showerheads in large and complex plumbing systems will not only contribute to a great reduction of shower water use in the whole water system, but also further influence the water supply system design. Hence, it is necessary to justify the redesign of existing water supply systems (such as the pipe size, storage tank volume, pumping arrangement etc.) in terms of the use of low flow showerheads. This study uses Monte Carlo simulations to evaluate the design flow rate for a typical high-rise roof tank water supply system in Hong Kong with the installation of low flow showerheads. The simulation results indicate that a full installation of low flow showerheads can decrease the design flow rate by 15%, corresponding to an energy efficiency improvement of 1.5%. The potential for water savings and associated energy savings can be significantly higher when all installed appliances in homes are water efficient (e.g., showerheads, water taps, washing machines). Further work is required to evaluate the redesign of existing water supply systems for a sustainable future.
1. Introduction
Water conservation is a way to deal with water scarcity that affects more than 40% of the global population [1]. In Hong Kong, domestic fresh water consumption accounts for over 50% of total fresh water consumption in the city [2]. Over 40% of the domestic fresh water consumption is for showering [3]. The situation is the same in other commercialized nations or regions, such as Singapore and the Gold Coast in Australia [4,5]. Presently, policymakers and water providers rely on demand-side water management as a means to promote water conservation [6,7]. In order to encourage the use of low flow showerheads, a voluntary Water Efficiency Labelling Scheme (WELS) on showers for bathing has been implemented by the Hong Kong Government since 2009 [8]. Similar schemes can be found around the world, e.g., the Water Efficiency Labelling and Standards (WELS) scheme in Australia [9], the Water Efficiency Labelling Scheme (WELS) in Singapore [10], WaterSense in the United States [11], and the European Water Label in the European Union [12].
Using low flow showerheads to conserve residential water is widely recognized nowadays. A case study of household water demand in California reported that water efficient showerheads reduced water consumption by 8% [6]. In a survey conducted by Yamazaki et al. [13] in seven Vietnamese households, it was found that shower water consumption was reduced after the replacement of water efficient showerheads. Water saved by water efficient showerheads was also reported by Lee et al. [14] in an investigation of shower water use in 44 Taiwanese households. According to a water use study conducted for Gold Coast residents in Australia, changing low efficiency showerheads to high efficiency ones could contribute to annual per capita water savings of 11.3 m3 or 48% [5].
In Hong Kong, gravity storage tanks on rooftops are common for high-rise buildings. As large and complex plumbing systems feed large amounts of demand points, the adoption of low flow showerheads in high-rise buildings will not only contribute to a great reduction of shower water use in the entire water system, but also further influence the water supply system design. This study provides justification of demand flow rates for the redesign of existing water supply systems in terms of the use of low flow showerheads.
This study investigates the design flow rate for a typical high-rise roof tank water supply system in Hong Kong with the installation of low flow showerheads.
2. Reviews on Design Flow Rate
The estimation of an instantaneous flow rate is necessary for sizing pipes and other components of water systems in buildings and, thus, models of design flow rate were reviewed [15]. The probability theory has been widely applied to estimate water demand and determine a design flow rate since its application by Hunter in 1940 [16,17]. When applying the theory to several different types of appliances, however, an overestimation of water demand was found. Hunter [16] pointed out that the principal reason for the overestimation is that the application does not take the probability, or rather the improbability, of overlapping between two or more groups of different appliance types into account. Therefore, determining the empirical evidence for overlapping distributions among different types of the appliance is necessary for improving the estimation accuracy of the probability theory. It should be noted that the use of probability theory in assessing simultaneous water demand is only fully applicable when large numbers of sanitary fittings are involved, as the larger the sample, the more likely the theory will yield more accurate predictions [18]. In practice, high-rise buildings with large plumbing systems that feed large numbers of appliances are good targets for the application of probability theory.
The Monte Carlo method, which is based on probability theory, has been used by Murakawa et al. to dynamically predict water consumption in buildings [19,20]. The load calculation model which Murakawa et al. used was developed according to the appliance usage patterns in the time series on a day, and building characteristics including number of households, family size, lifestyle, schedule of going out, number of appliances, and types of appliance were investigated before the calculation [19]. In the simulations, pseudo-random numbers generated by a personal computer were employed to simulate the random appliance usage patterns. The water consumption for each appliance was simulated using the occurrence of random numbers based on the water usage distributions [21].
The calculation models by Murakawa et al. were validated by comparing the average water consumption per day predicted for the target buildings with the data obtained from the water meters installed in the buildings [22]. Although the predicted water consumption results by Murakawa et al. were closer to the measured results than the design calculations, they were still overestimated (an overestimation of 36 to 74%) [22]. It is known that discharge overlapping among different types of the appliance is the main factor that affects the simulation accuracy. However, no detailed definition of discharge overlapping while simulating water consumption for different appliance types was provided in Murakawa’s fixture usage model or unit model. As incorporating factors that reflect the discharge overlapping into the calculation models is difficult in practice, alternatively, water consumption can be simulated by the Monte Carlo method for each appliance type individually and the individual simulation results can then be summed up across the time series. The discharge overlapping among different types of the appliance can be avoided during the summation process because the simulation of water consumed by each appliance type is based on the field-surveyed water demand pattern. This study uses this method to avoid the problem of discharge overlapping in the simulation.
Despite the fact that the maximum simultaneous water demand for a 24-h time series given by Murakawa et al. can be taken as the design flow rate of the water supply system in practices [19,20,23,24], it may be not an optimal solution as the maximum simultaneous water demand usually lasts only for a short time over the system lifetime [25]. In fact, several studies revealed that the calculated maximum flow rates by current standards/guidelines are overestimated [26,27]. In a Belgian study, the maximum flow rates calculated according to German standard Deutsches Institut für Normung DIN 1988-3, European standard EN 806-3, French specification DTU 60.11 and Dutch guideline ISSO 55 were compared with the peak flow rates measured in a number of apartment buildings in Belgium during 2011–2012. The findings disclosed that existing standards/guidelines overestimate the peak flow rate by 2 to 3 times [26]. In another study by Vrana et al. [27], the maximum flow rates measured in 10 residential buildings in the Czech Republic were compared with the design flow rates according to various standards including Czech standard CSN 75 5455, Slovak standard STN 73 6655, Swiss SVGW W3 and German standard DIN 1988-300 [27]. The results showed that all measured maximum flow rates were lower than the design flow rates; the difference between the measured peak flow rate and the design flow rate based on Czech standard CSN 75 5445 or STN 73 6655 was the largest, while the difference between the measured peak flow rate and the design flow rate determined by W3 or DIN 1988-300 was smaller [27]. Blokker [28] developed a stochastic water demand model SIMDEUM (SIMulation of water Demand; an End-Use Model), and it was confirmed that the model can be applied to predict the water demands in residential buildings, offices, hotels, and nursing homes. The SIMDEUM is with a one second time step and at the fixture level [28].
3. Occupant Loads and Water Demand Patterns in High-Rise Buildings in Hong Kong
The accuracy of the Monte Carlo simulation is highly dependent on the input parameter values (e.g., occupant load, water demand pattern) derived from the field survey. The occupant loads and water demand patterns in high-rise buildings were studied by Wong and Mui via two interview surveys conducted in Hong Kong [29,30].
The first interview survey, focusing on the occupancy number, was carried out in 43 households of a typical old high-rise residential building in 2003 [29]. The second face-to-face interview survey was performed in 597 households selected from 14 high-rise residential buildings in late 2003–2004 [30]. More details about the two surveys are found in References [29,30].
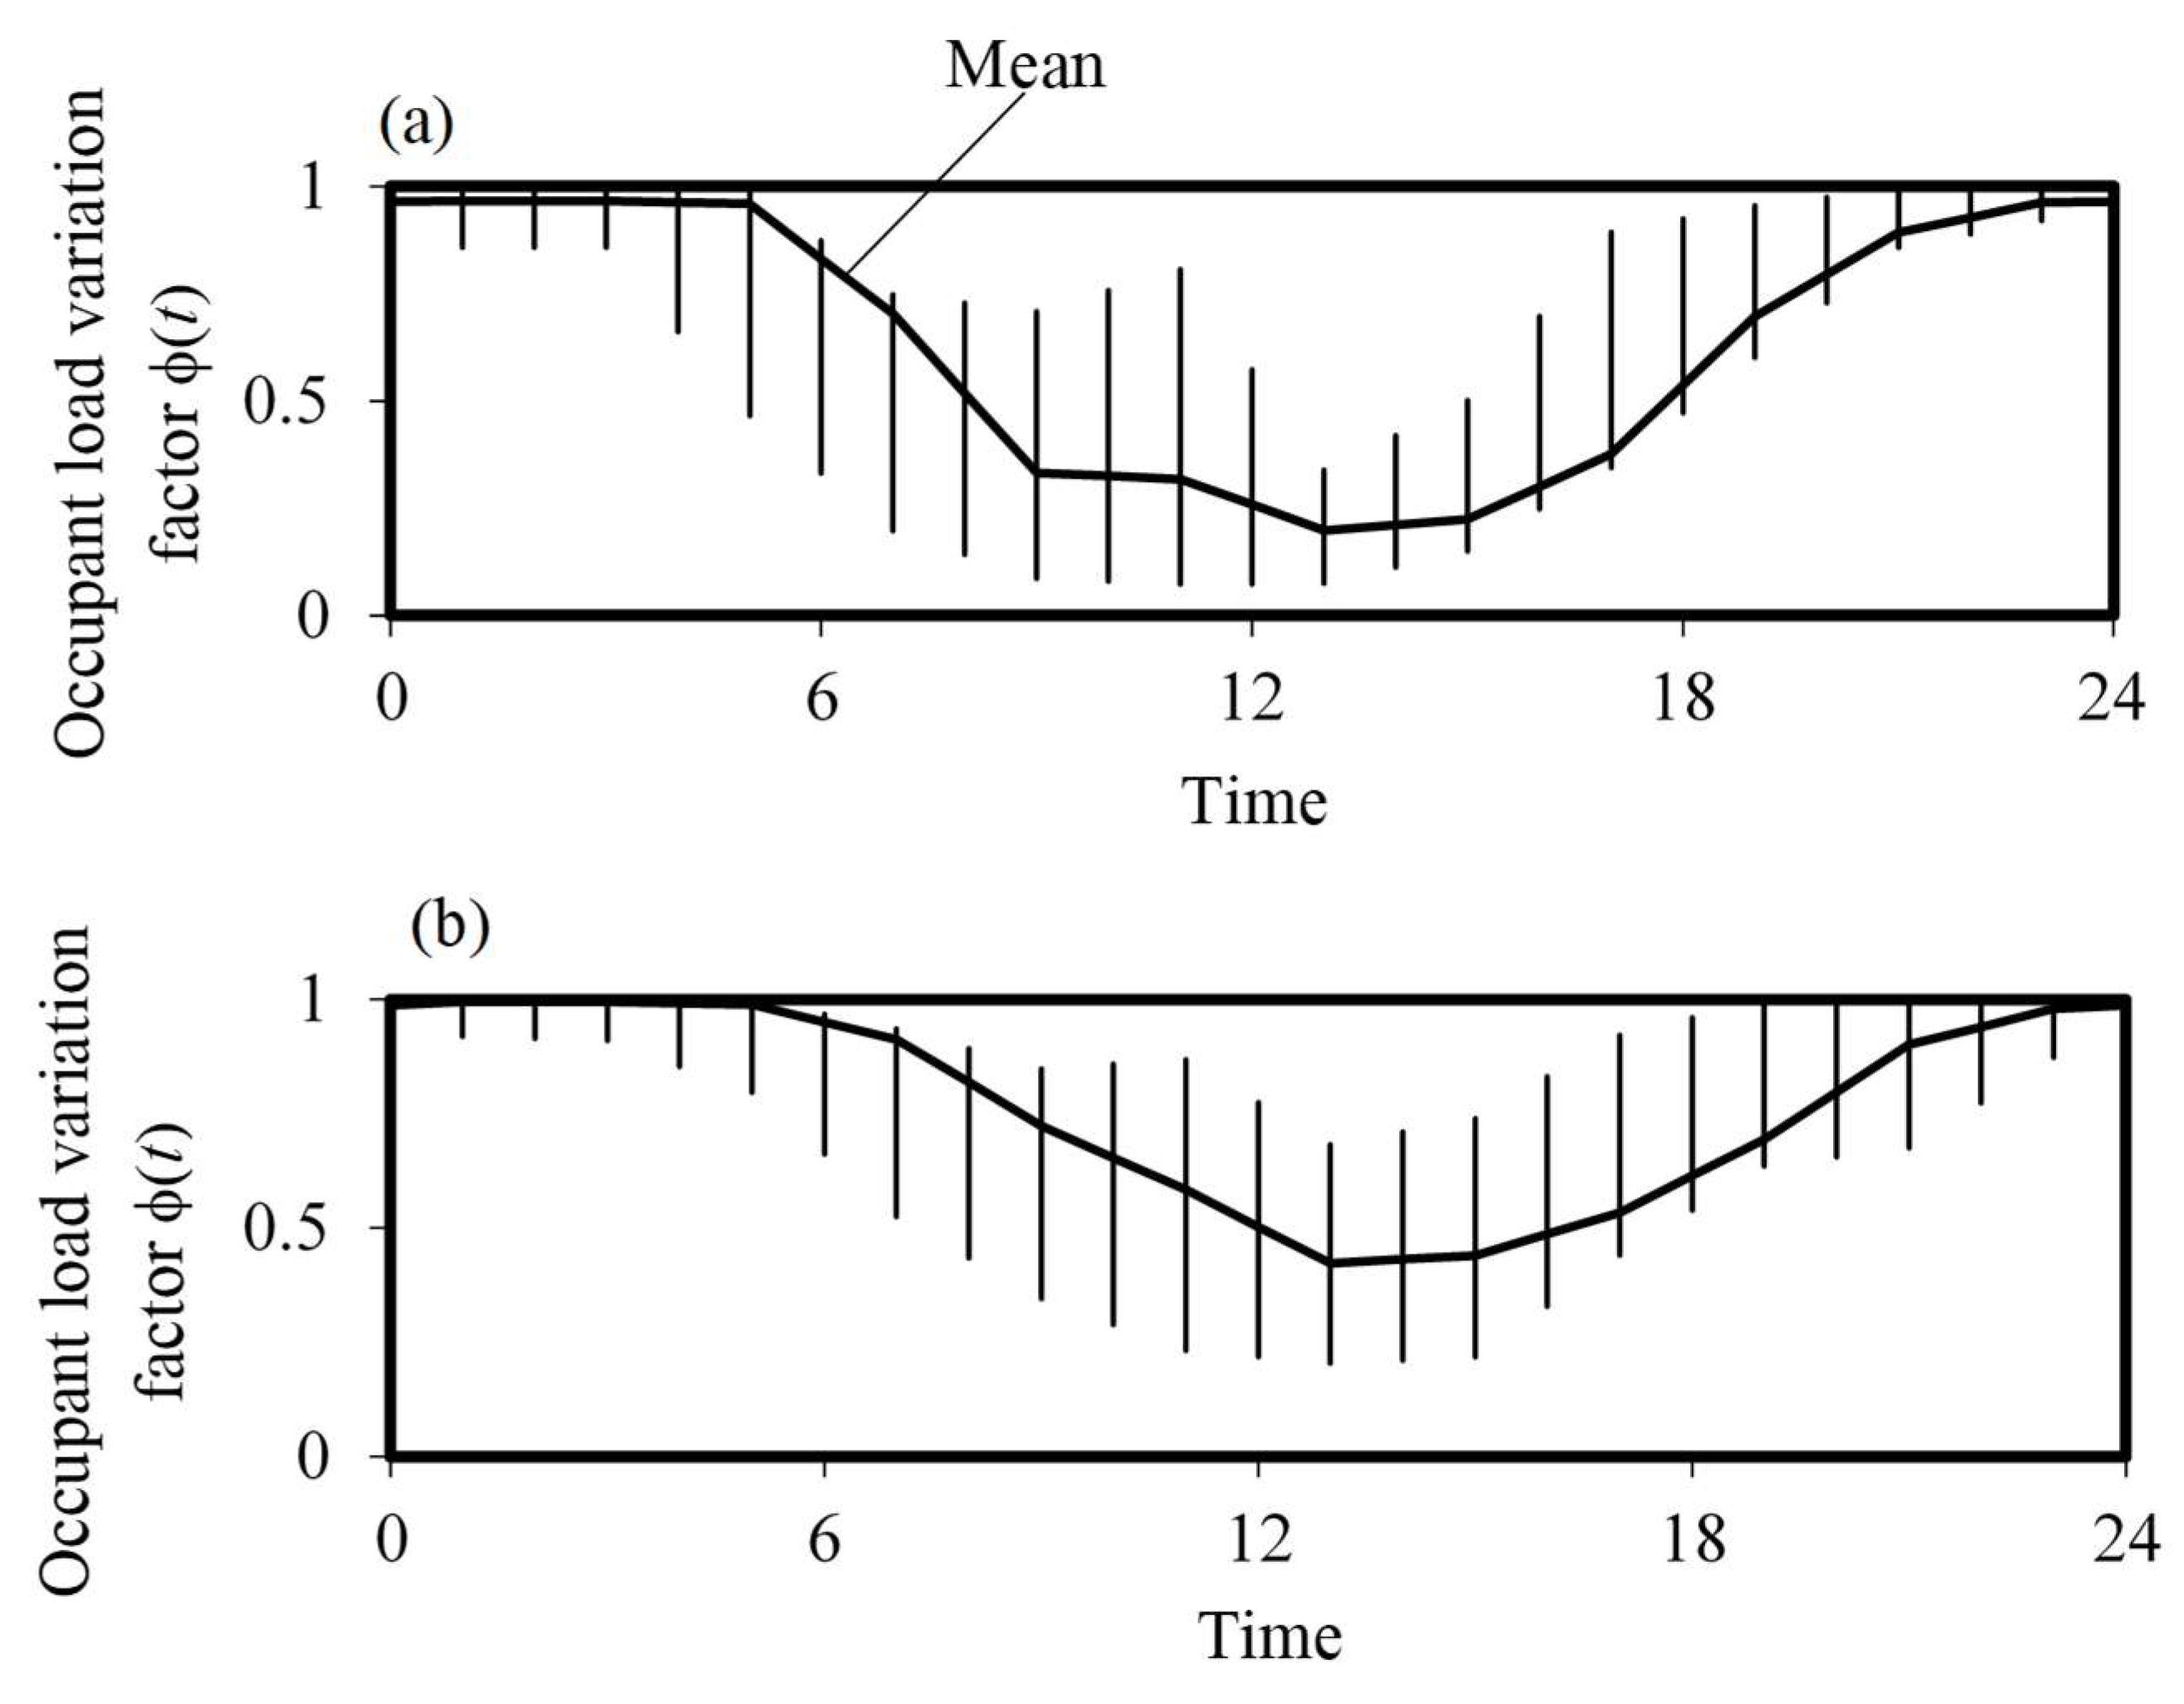
The second survey found an average of 4.2 occupants per household [30]. Figure 1 illustrates the occupant load variation factors, which was defined as the occupant load at a time divided by the maximum occupant load [31], obtained from the two interview surveys [30]. It can be seen that, is agreeance with the real situation, the occupant loads in the morning and at night are high.
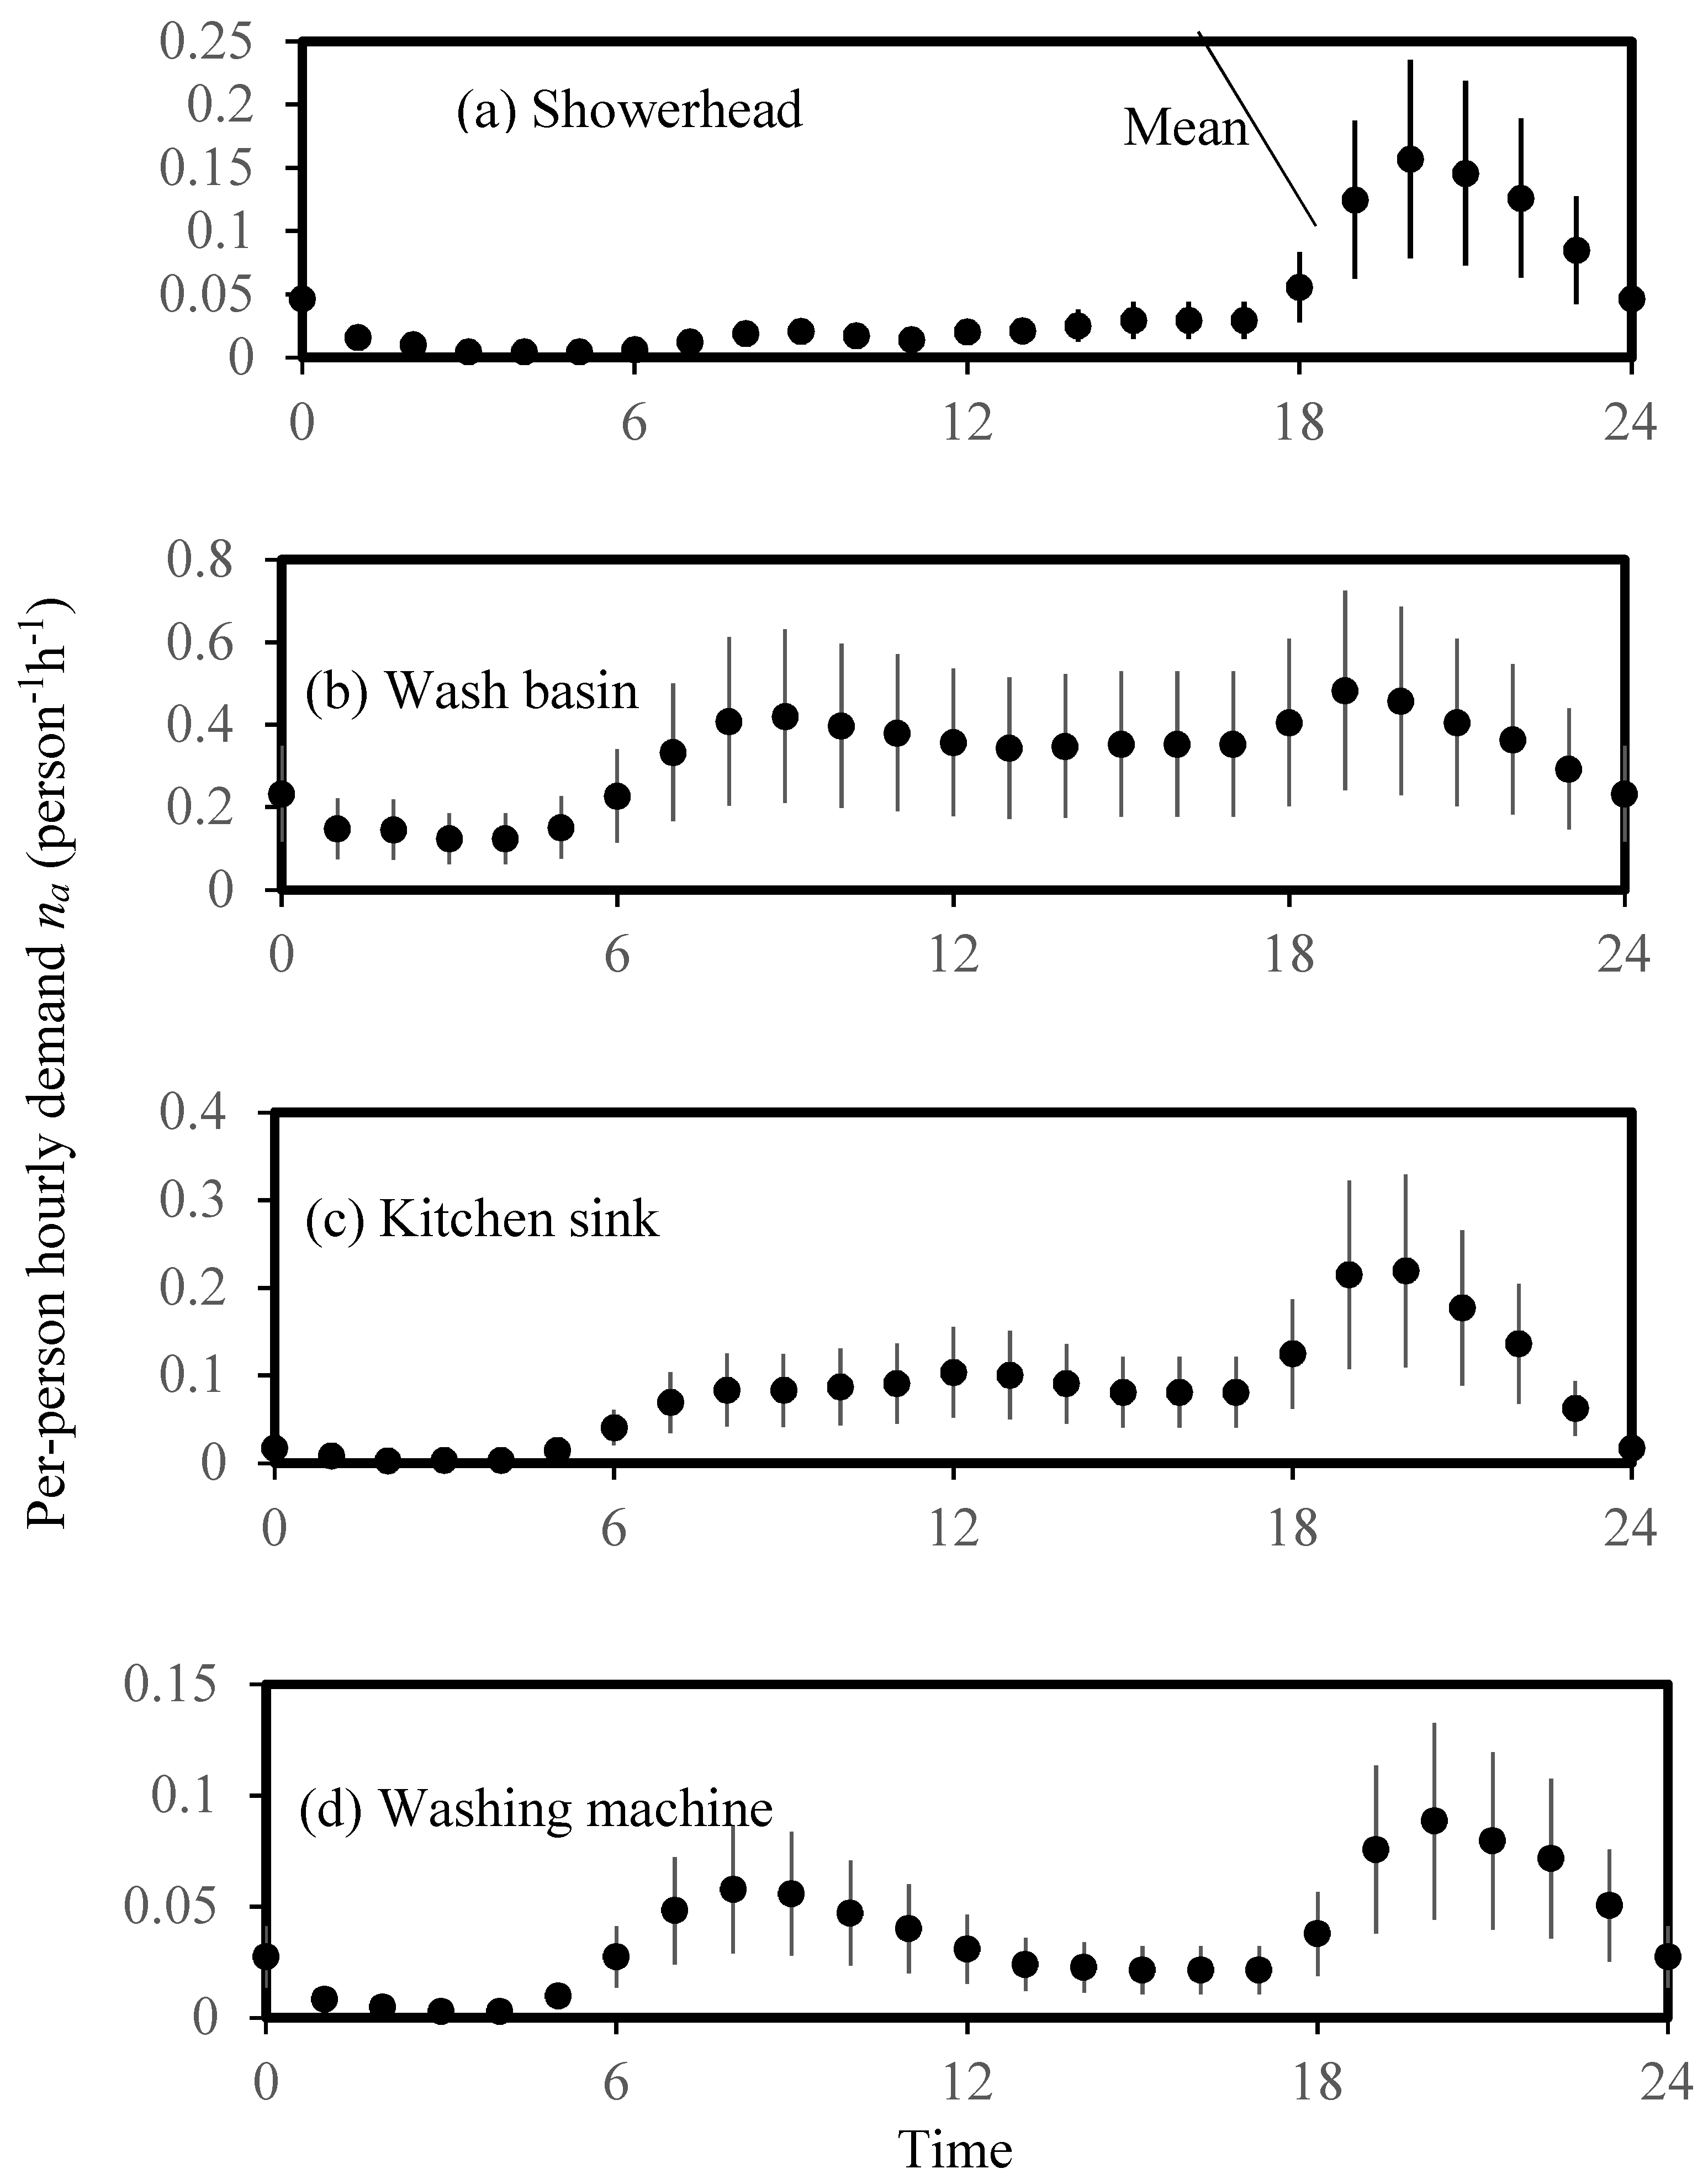
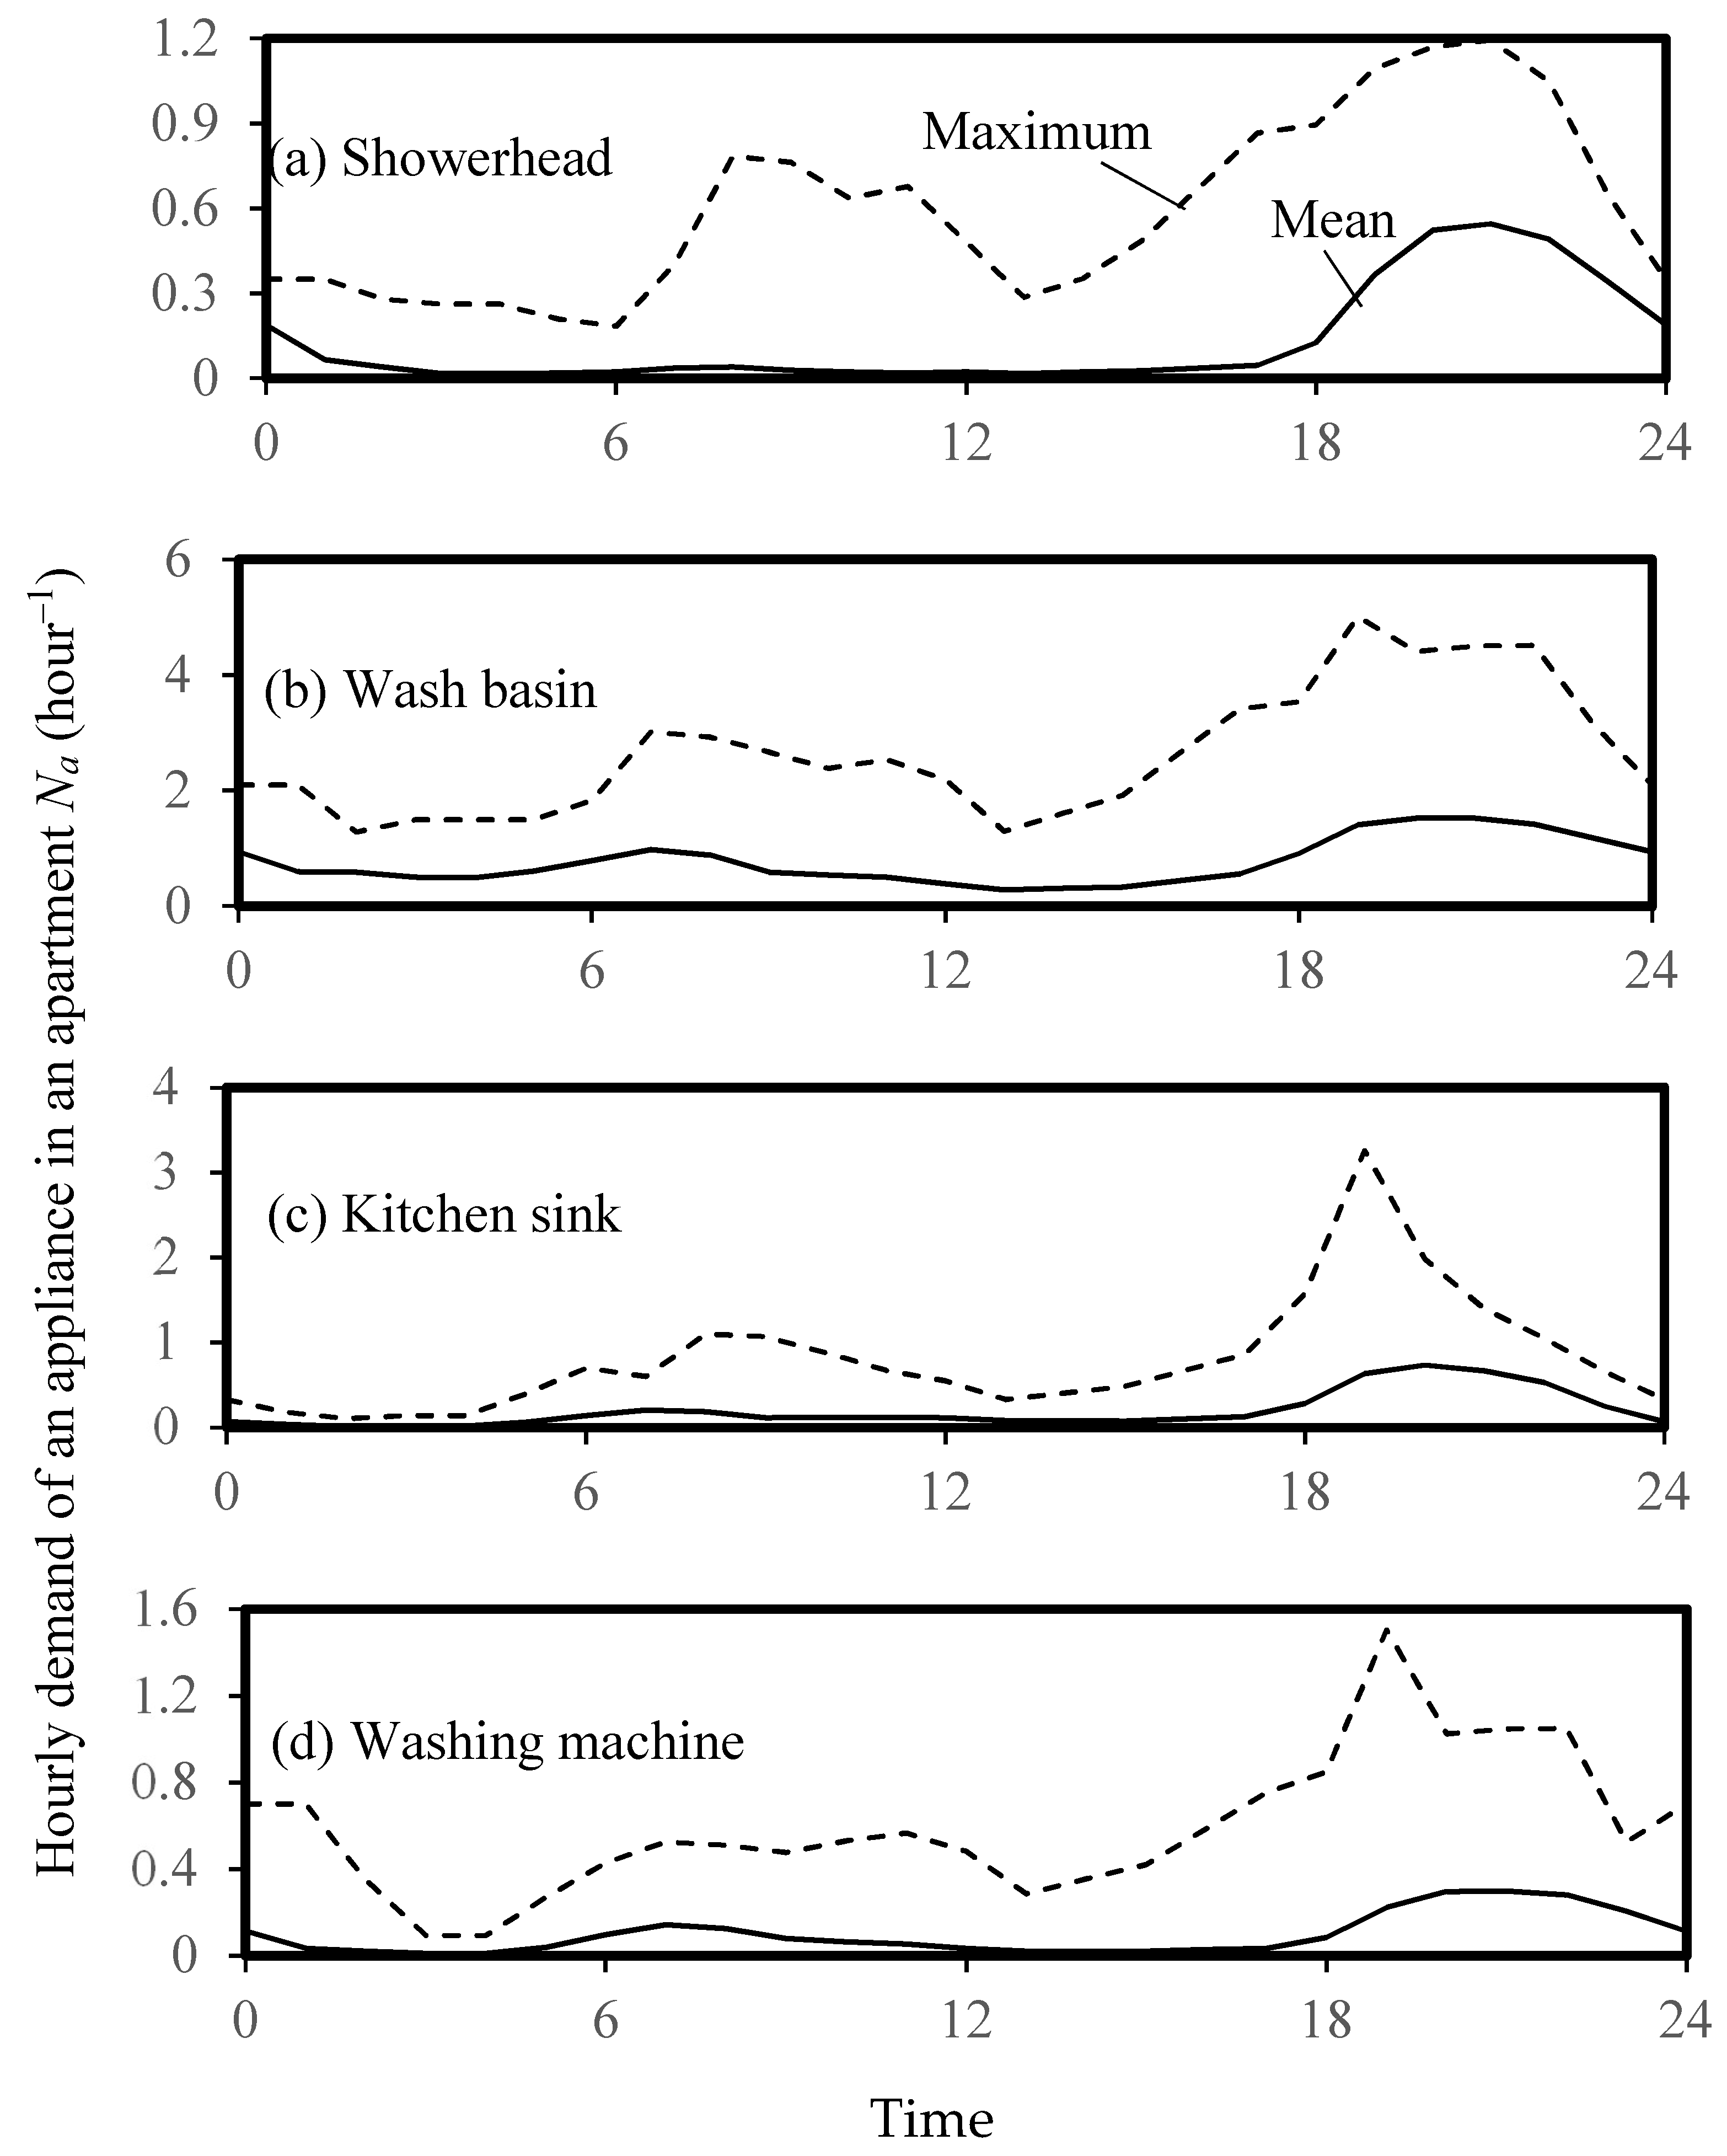
The per person hourly demand patterns for all appliance types (including showerheads, wash basins, kitchen sinks and washing machines) throughout a day from the second survey are shown in Figure 2. The hourly demand patterns for all appliance types in an apartment are exhibited in Figure 3. In these figures, demand peaks can be seen at night for all appliance types, while morning peaks are not obvious for some appliance types, e.g., showerhead.
4. Methodology
Monte Carlo simulations of the design flow rate for a high-rise roof tank water supply system that fed various appliances including showerheads, wash basins, kitchen sinks and washing machines were performed. As one previous investigation revealed that many newly constructed public residential buildings in Hong Kong are over 40 stories or 100 m [32], the number of appliances assumed for each appliance type in this study was 600. The Monte Carlo simulations were carried out in two steps: The first step was to simulate the simultaneous water demands generated by all appliance types in the time series; the second step was to integrate the water demand time series, with the roof tank volume considered, to determine the design flow rate. In other words, a water demand time series was simulated for each appliance type, and a total water demand time series was then generated by aggregating the individual water demand time series data points. Moreover, two cases were considered: (A) All appliances were conventional ones; and (B) the showerheads were low flow ones (i.e., WELS rated Grade 1 showerheads; normal flow rate ≤ 9 L·min–1), while all the other appliances (i.e., wash basins, kitchen sinks and washing machines) were conventional ones.
4.1. Models of Design Flow Rate
A mass balance equation was proposed at the roof tank of a roof tank water supply system for buildings, to decide the inflow rate of an up-feed pipe qo (L·s−1), as Equations (1) and (2), where qw (L·s−1) is a time-variant water demand, τ∞ is a demand time period starting at time t0 and ending at time t∞, V∞ (L) is the total volumetric water consumption and Vo (L) is the roof tank storage volume [33],
The values of input parameters for the Monte Carlo simulation are summarized in Table 1. Studies unveil that there is no significant difference in shower duration between conventional and water efficient showerheads, same discharge time was thus assumed for all showerheads used in the simulation.
4.2. Energy Efficiency of a Water Supply System
In order to justify the pipe sizes, storage volume and pumping flows of an existing water supply system with low flow showerheads for bathing, simulated design flow rates for low flow as well as conventional showerhead demands were evaluated in terms of energy efficiency. The models for energy efficiency evaluation are described below.
The design flow rate influences the friction loss in the up-feed pipe of a roof tank water supply system and thus affects the system energy efficiency. The energy efficiency of a high-rise roof tank water supply system (as shown in Figure 4), is defined as the ratio of potential energy demanded at the water consumption locations Eout to the energy for pumping in the supply system Epump [37],
Eout (MJ) is given by water consumptions in volume vi at height hi, as shown in Equation (4), where ρd (=1000 kg·m−3) is the water density and g (=9.81 m·s−2) is the gravitational acceleration [37],
Energy consumption for pumping water from the break tank to the roof tank Epump (MJ) is calculated by Equation (5), where ηov is the design overall transmission efficiency; hl is the height from the break tank water surface to the roof tank inlet; and Ho is the desired minimum water pressure head assumed at the roof tank inlet [37]. Hf is the friction head required in the up-feed water pipe, given by Equation (6), where λ is the Darcy friction coefficient, u (m s−1) is the flow velocity, d (m) is the hydraulic diameter and Le is the pipe equivalent length taking all pipe fittings into account [23].
The design overall transmission efficiency ηov (34–65%) is expressed by the pump efficiency ηp, the mechanical transmission efficiency ηmt, and the electric motor efficiency ηe. It is noted that the values for the ηp, ηmt, ηe are 50–80%, 90% and 70–90% respectively [38,39].
In practice, an average height of demand locations hd can be used and Equation (4) can be converted into Equation (8). Combined with Equation (5), energy efficiency αt can be expressed by Equation (9).
The pump power Pt (kW) is calculated by,
5. Results and Discussion
5.1. Simulated Water Demand Time Series
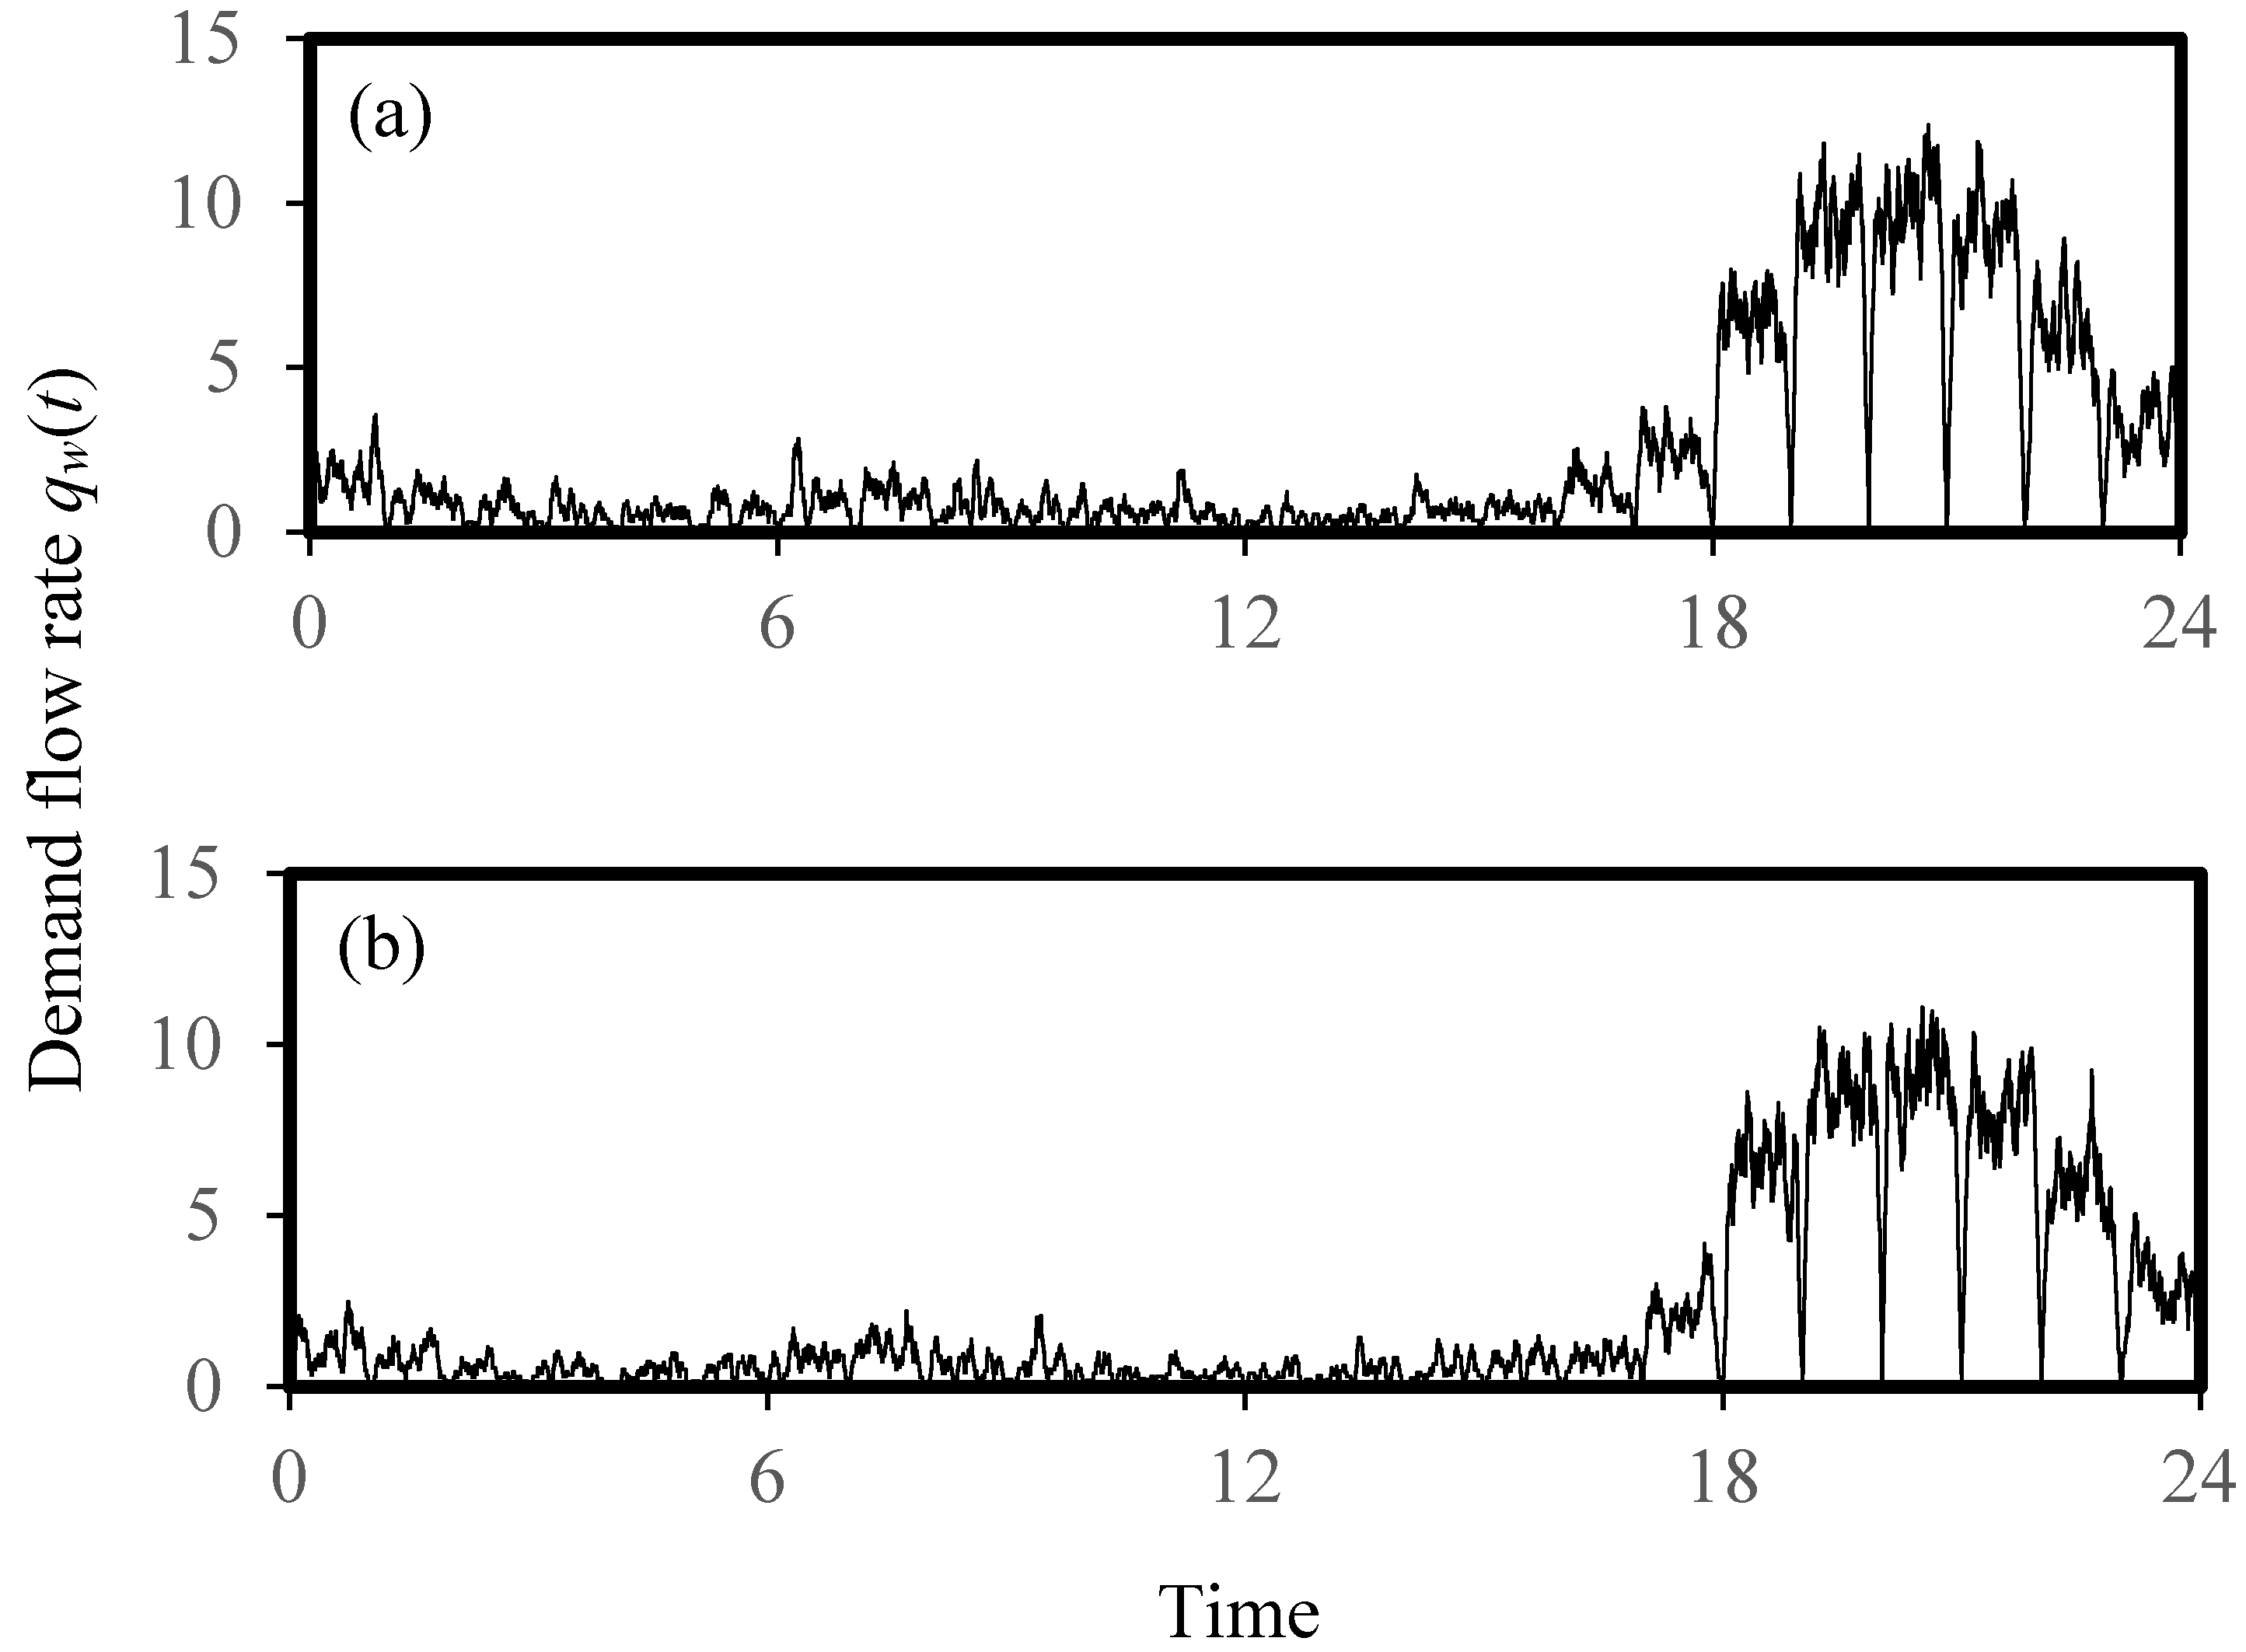
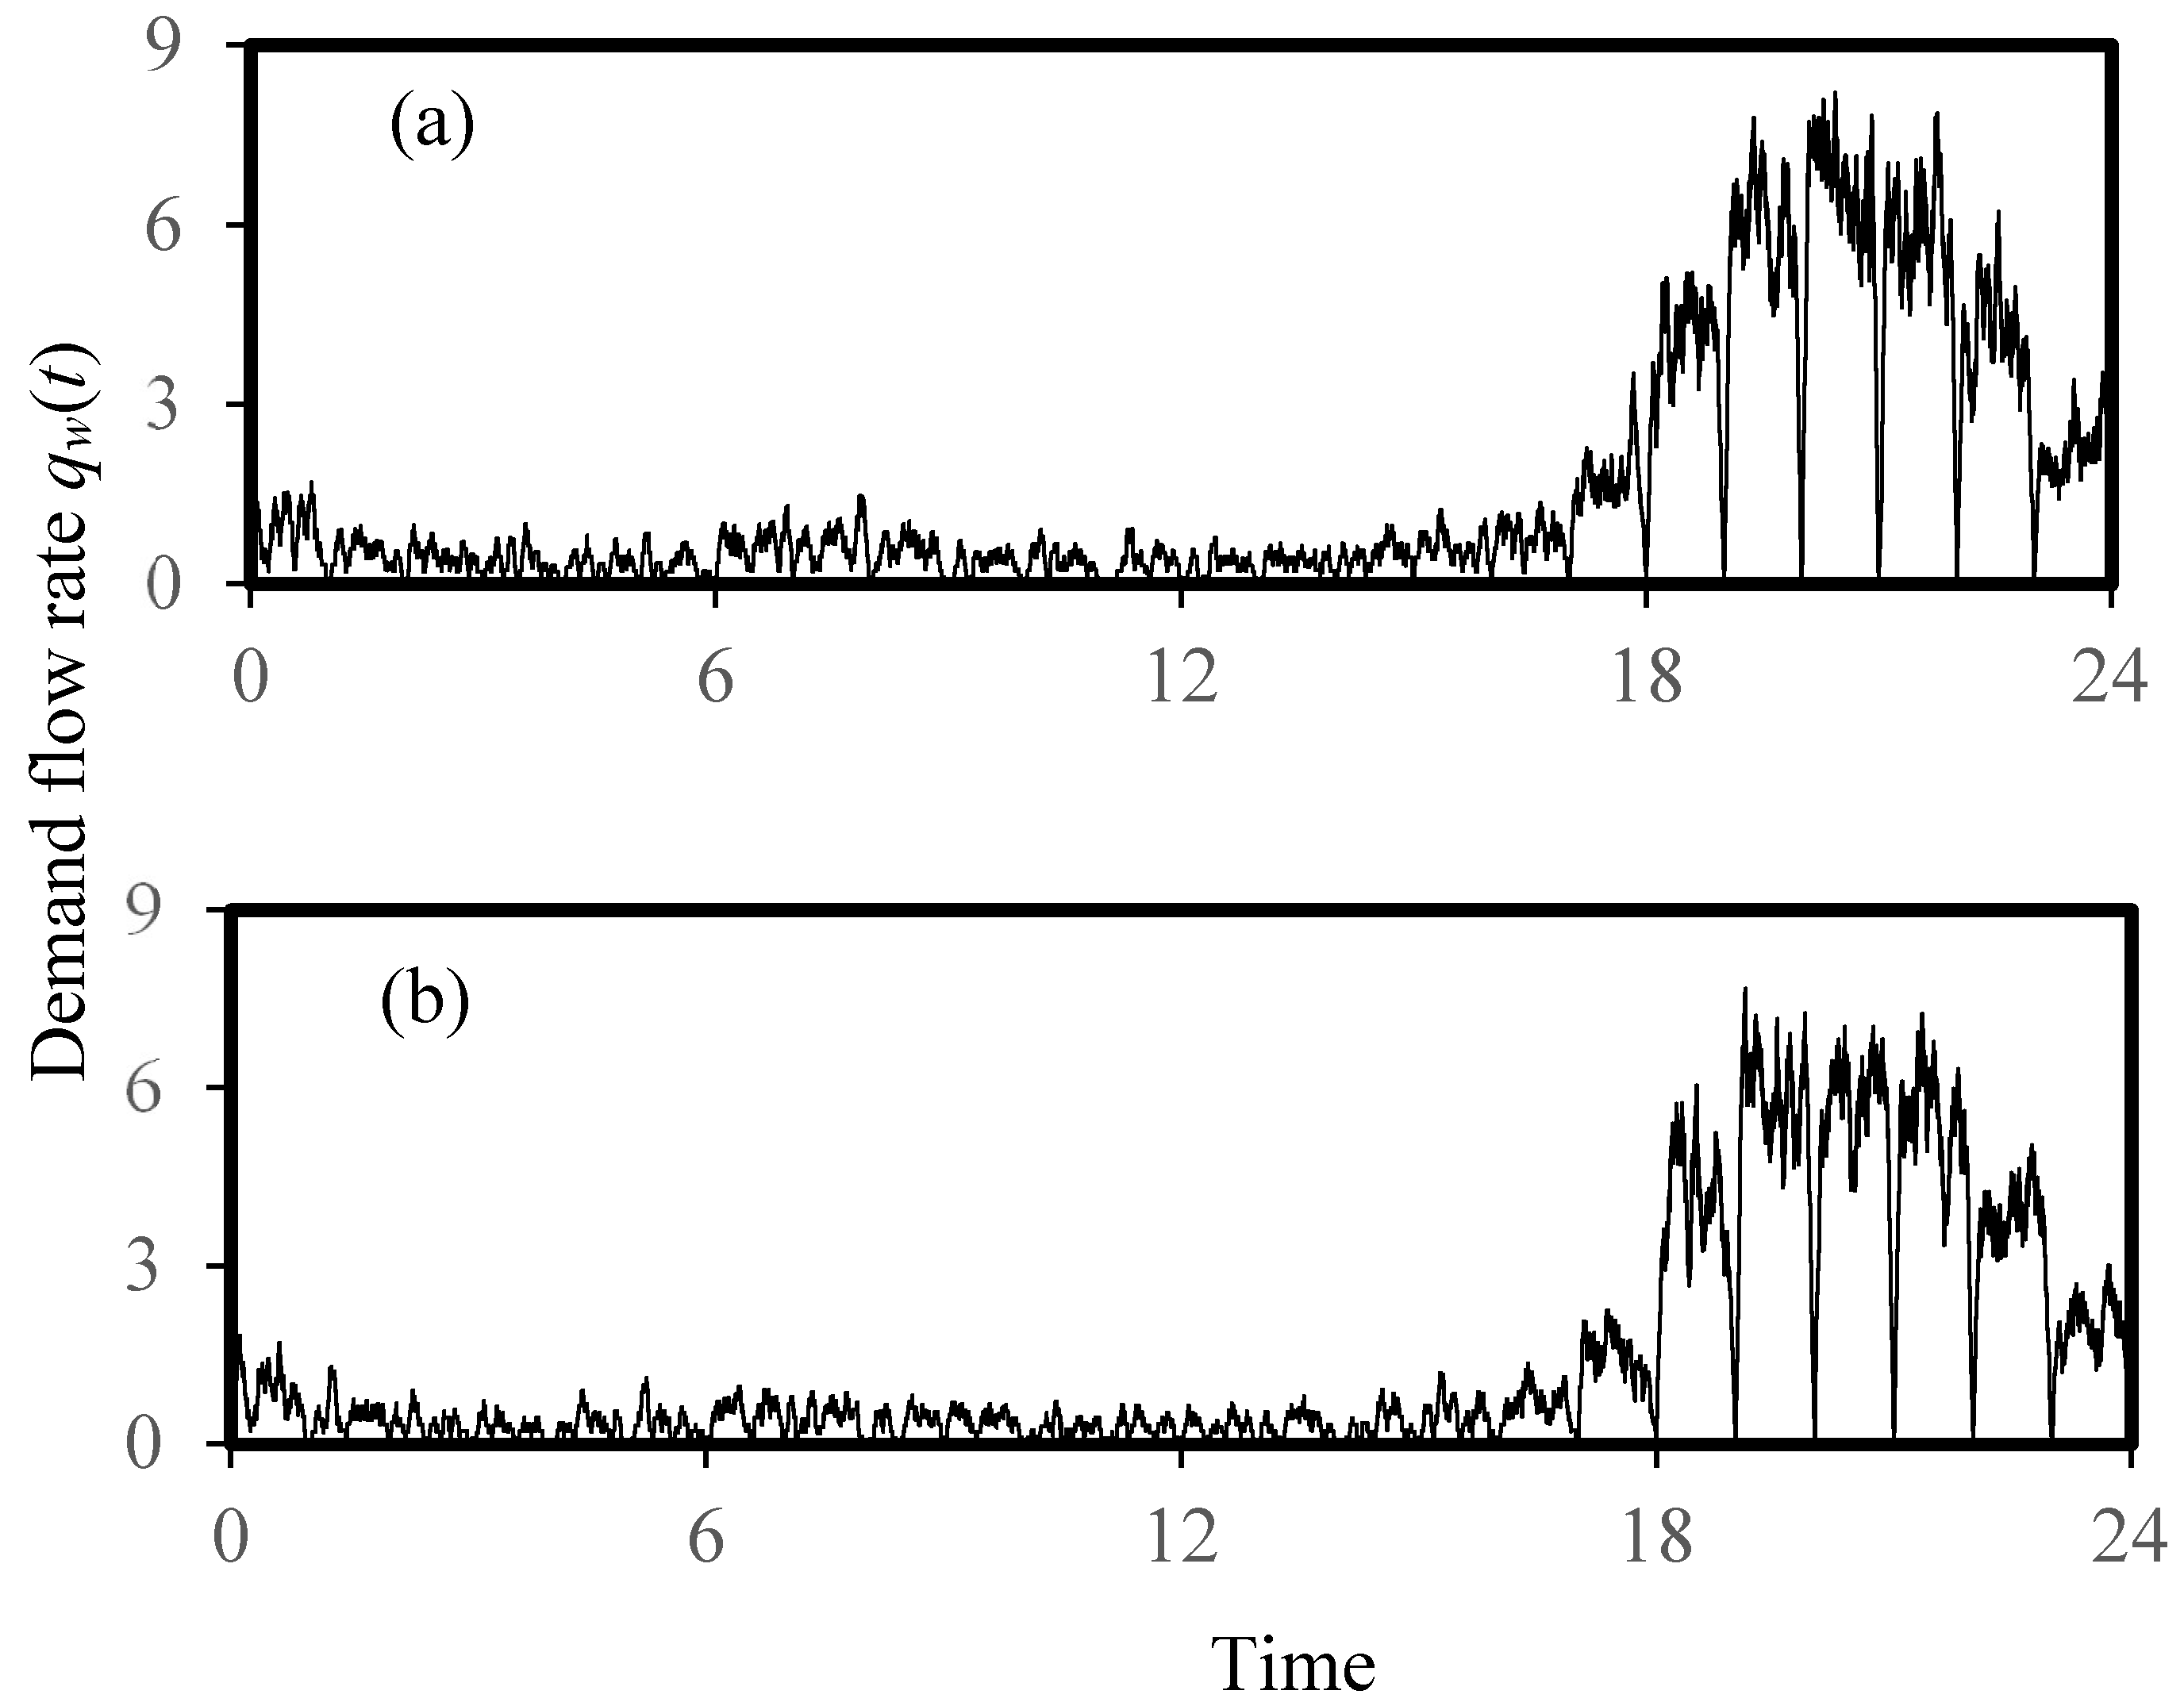
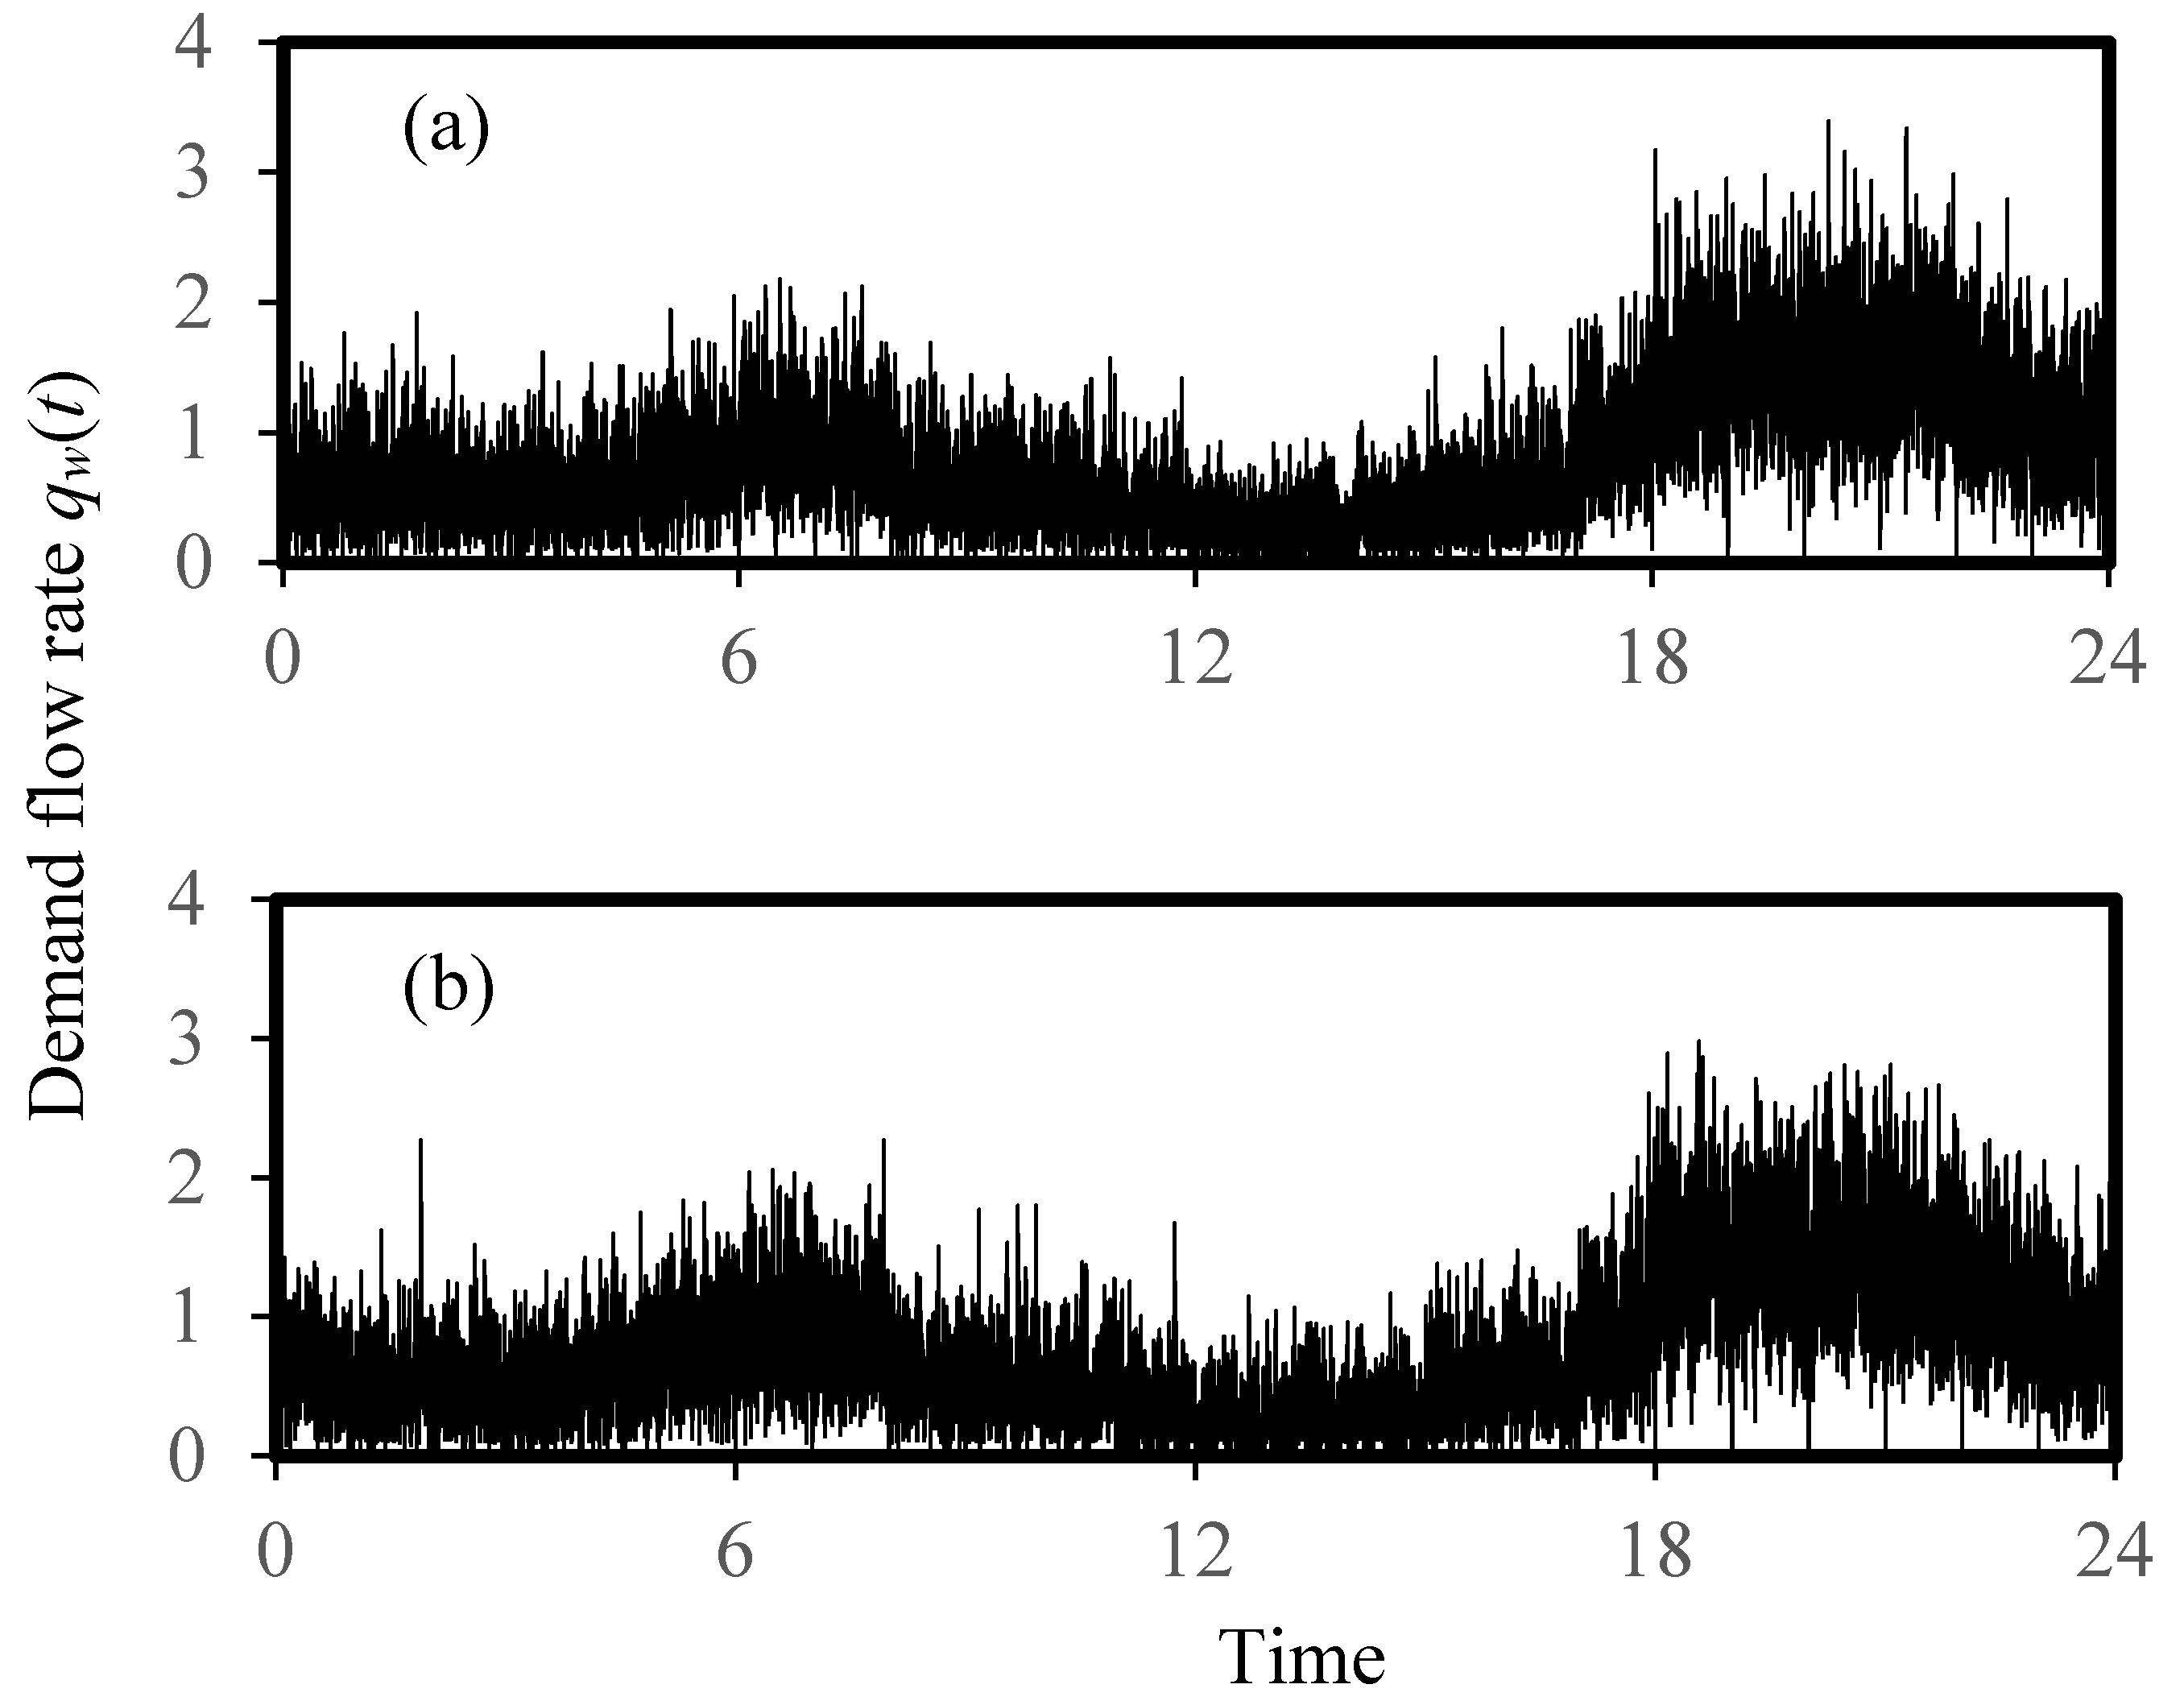
Figure 5, Figure 6, Figure 7, Figure 8 and Figure 9 show the simulated demand flow rates in time series qw(t) for each appliance type, on the condition that the water supply system is in use for 100 years. The use of “100 years” was based on the findings that there was no significant difference in the simulation results with an increase in years of operation after 100. Some design guides suggest a 1% failure rate for the design demand flow rate [40]; therefore, 1 out of 100 years was taken as a reference calculation in this study. The time step of the daily demand time series was 1 s.
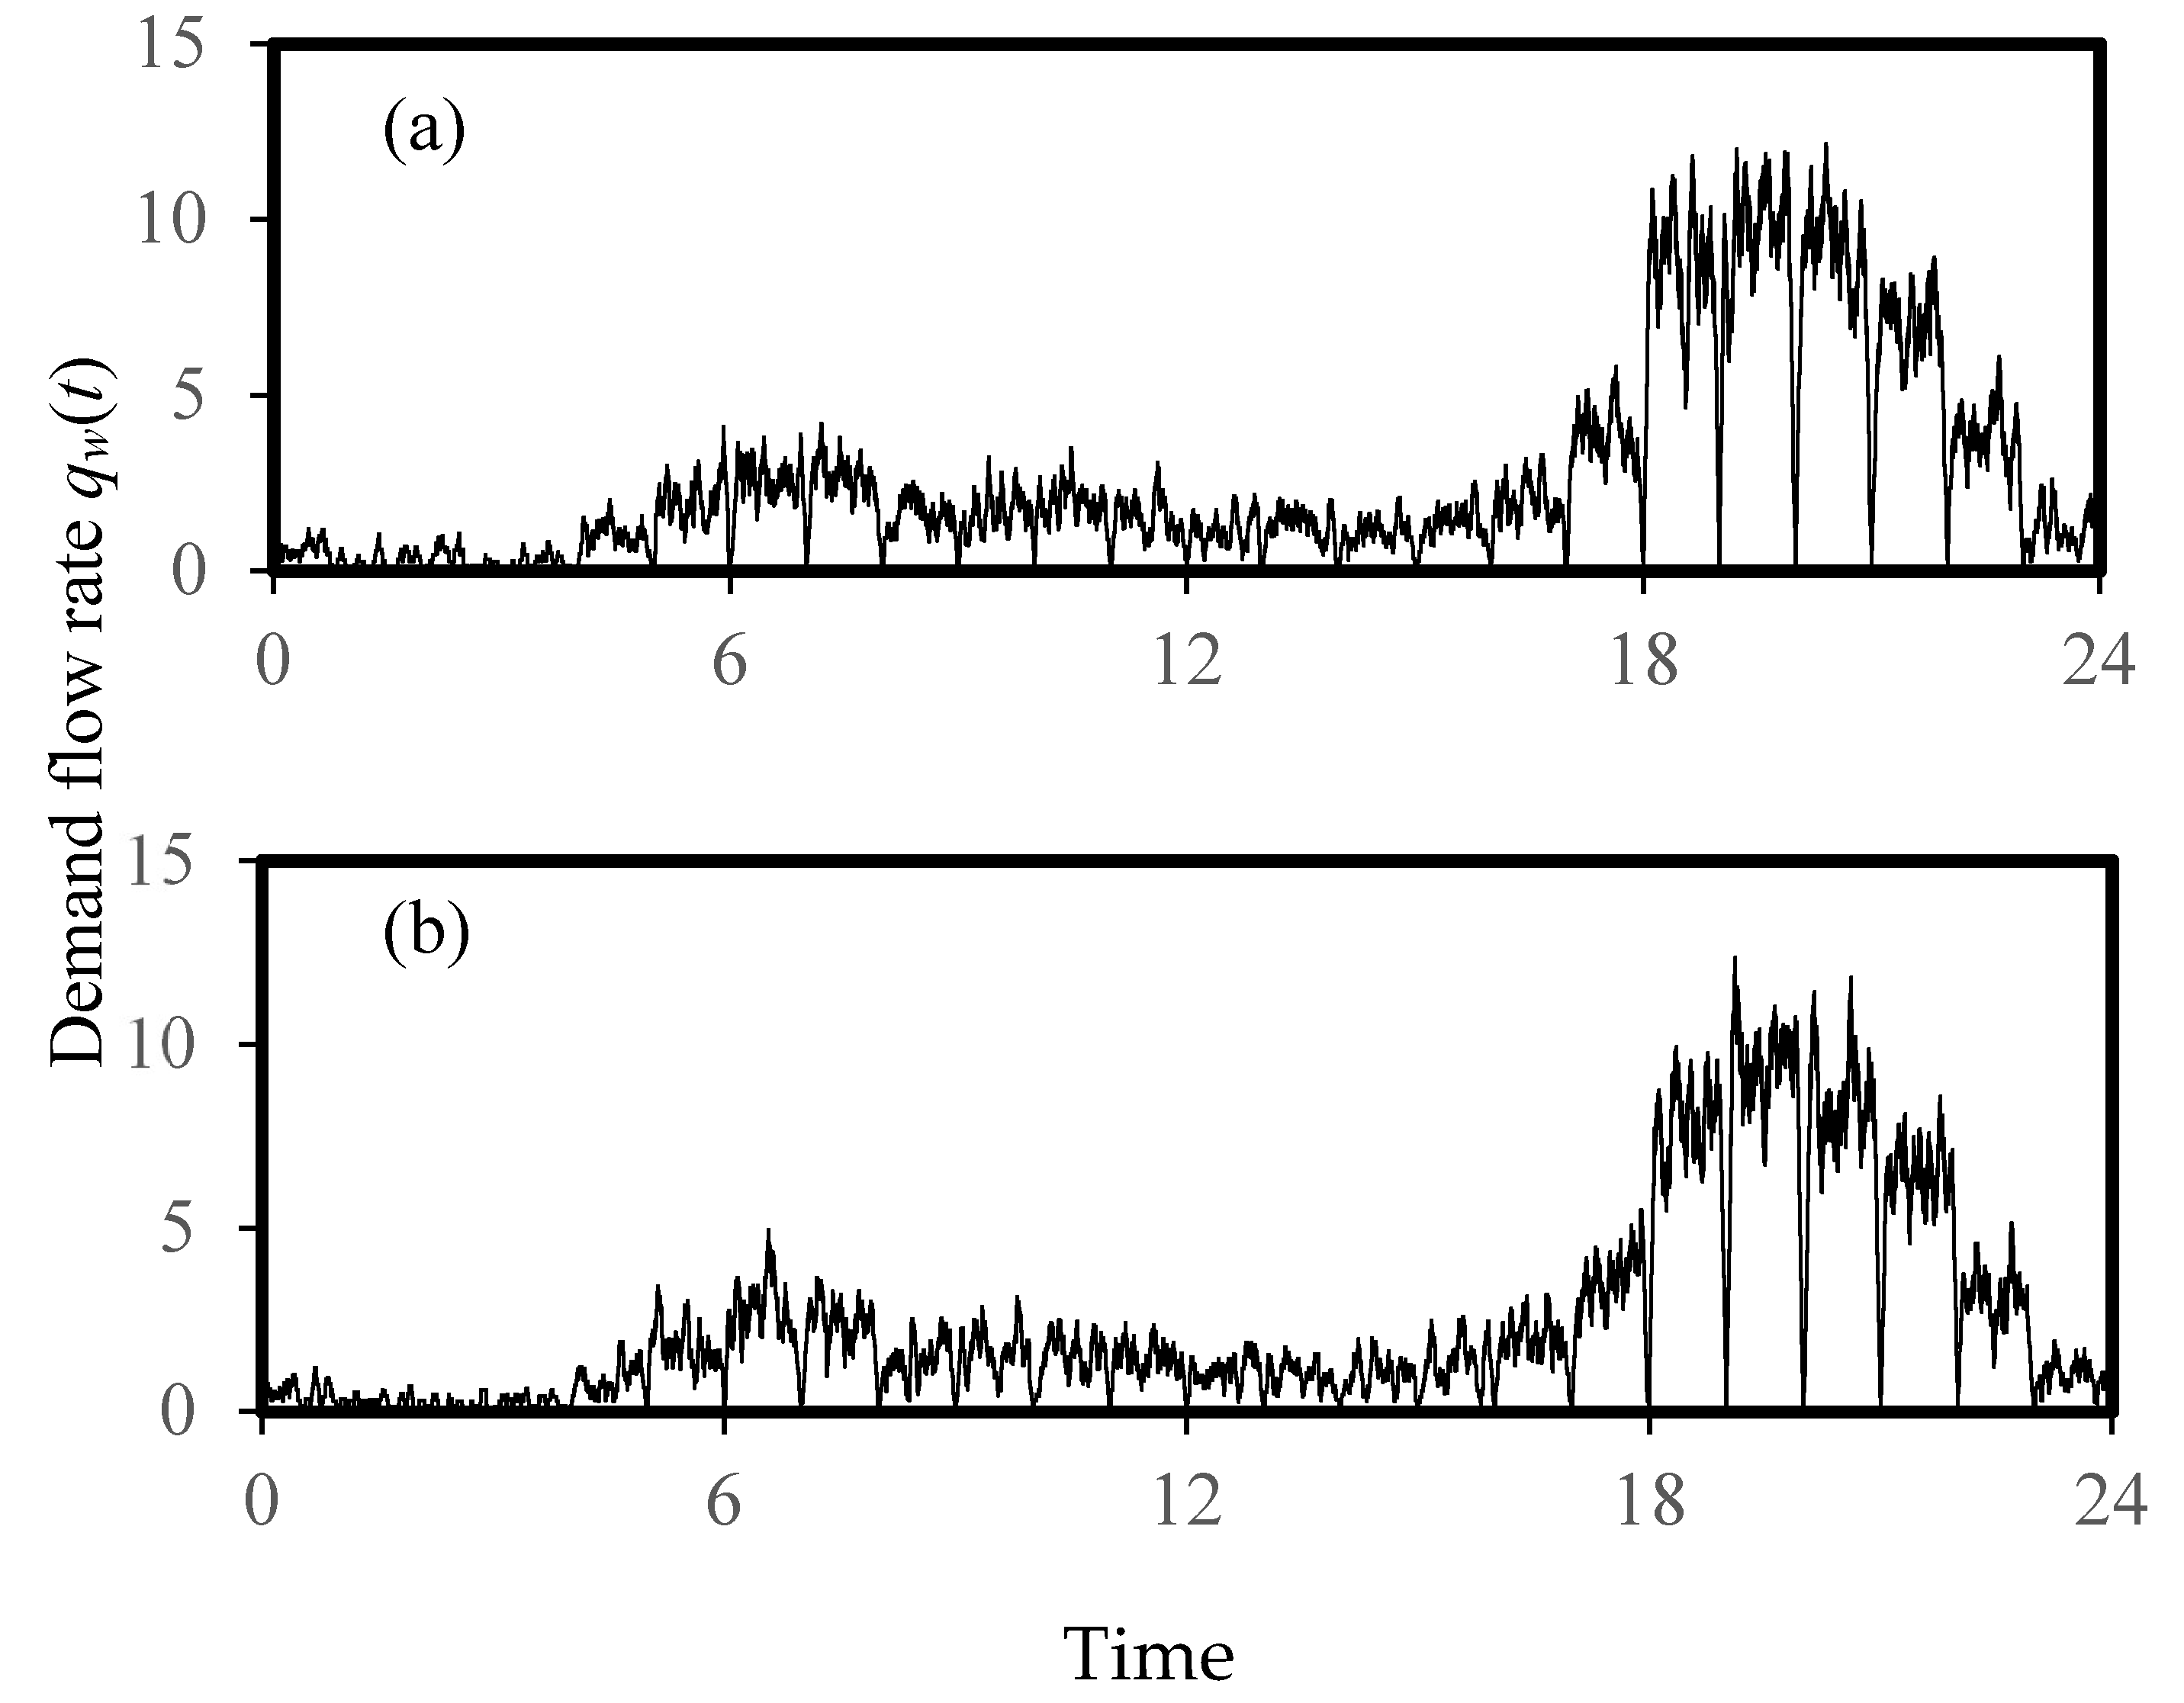
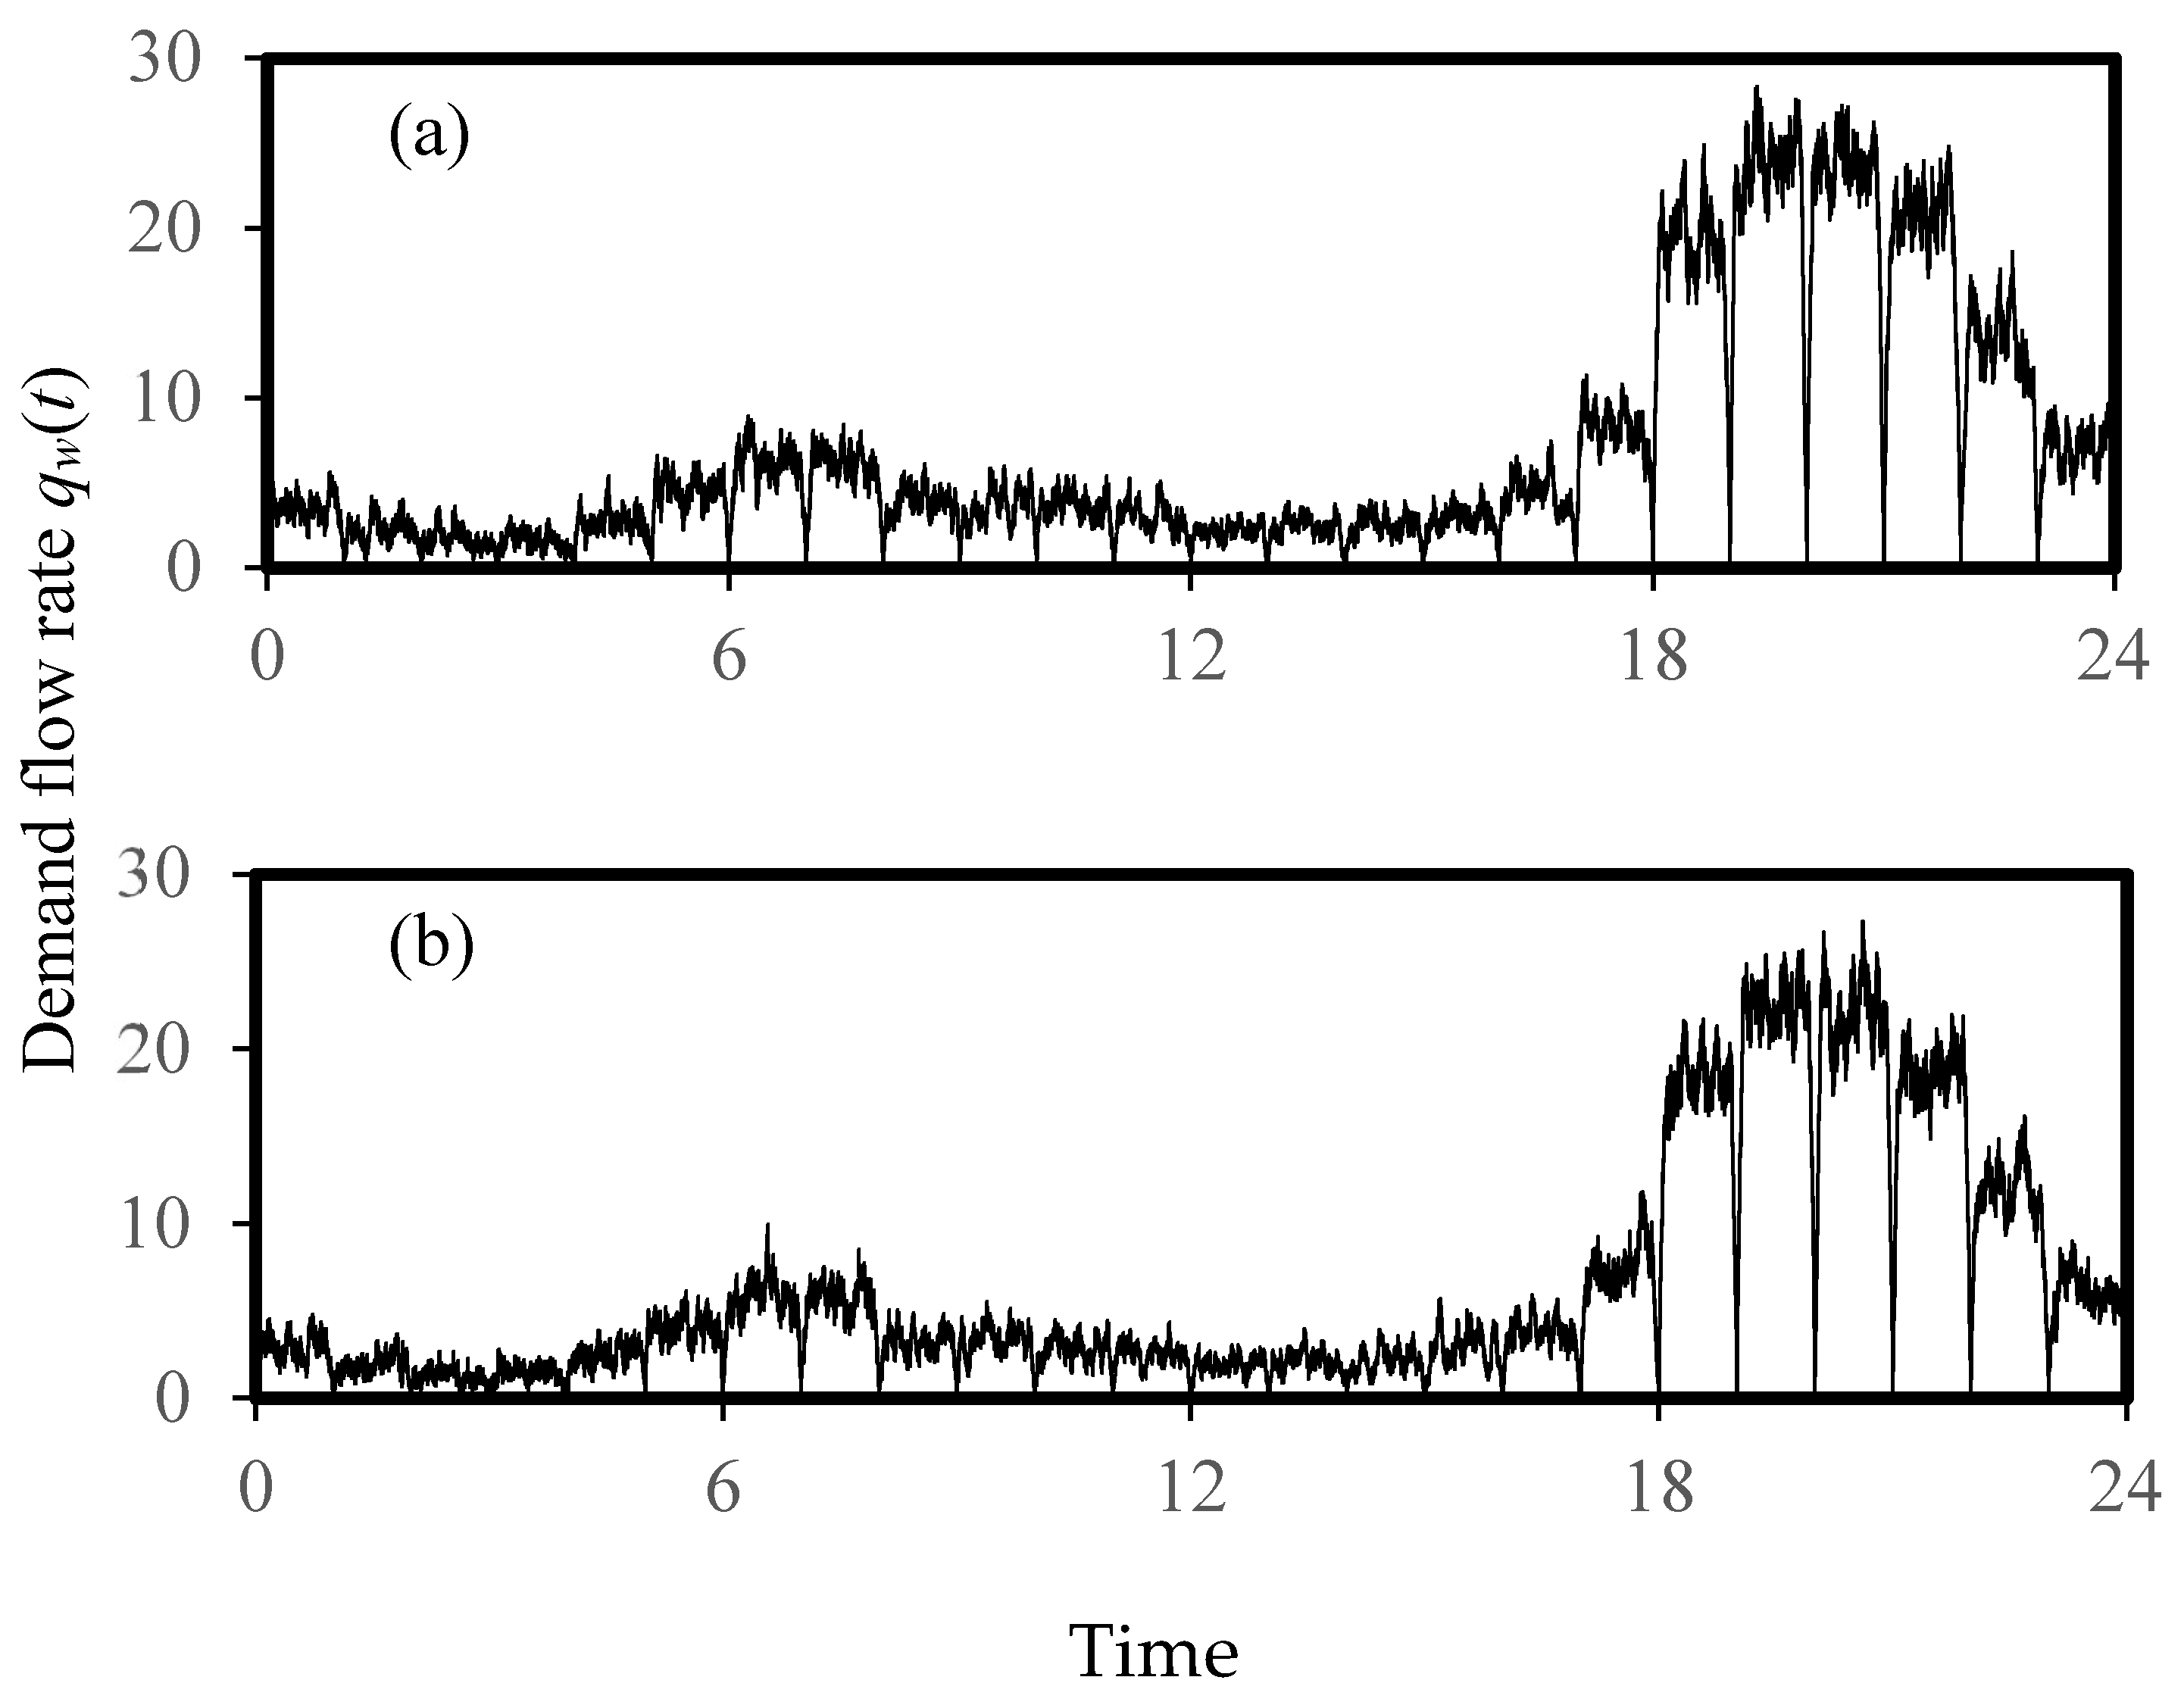
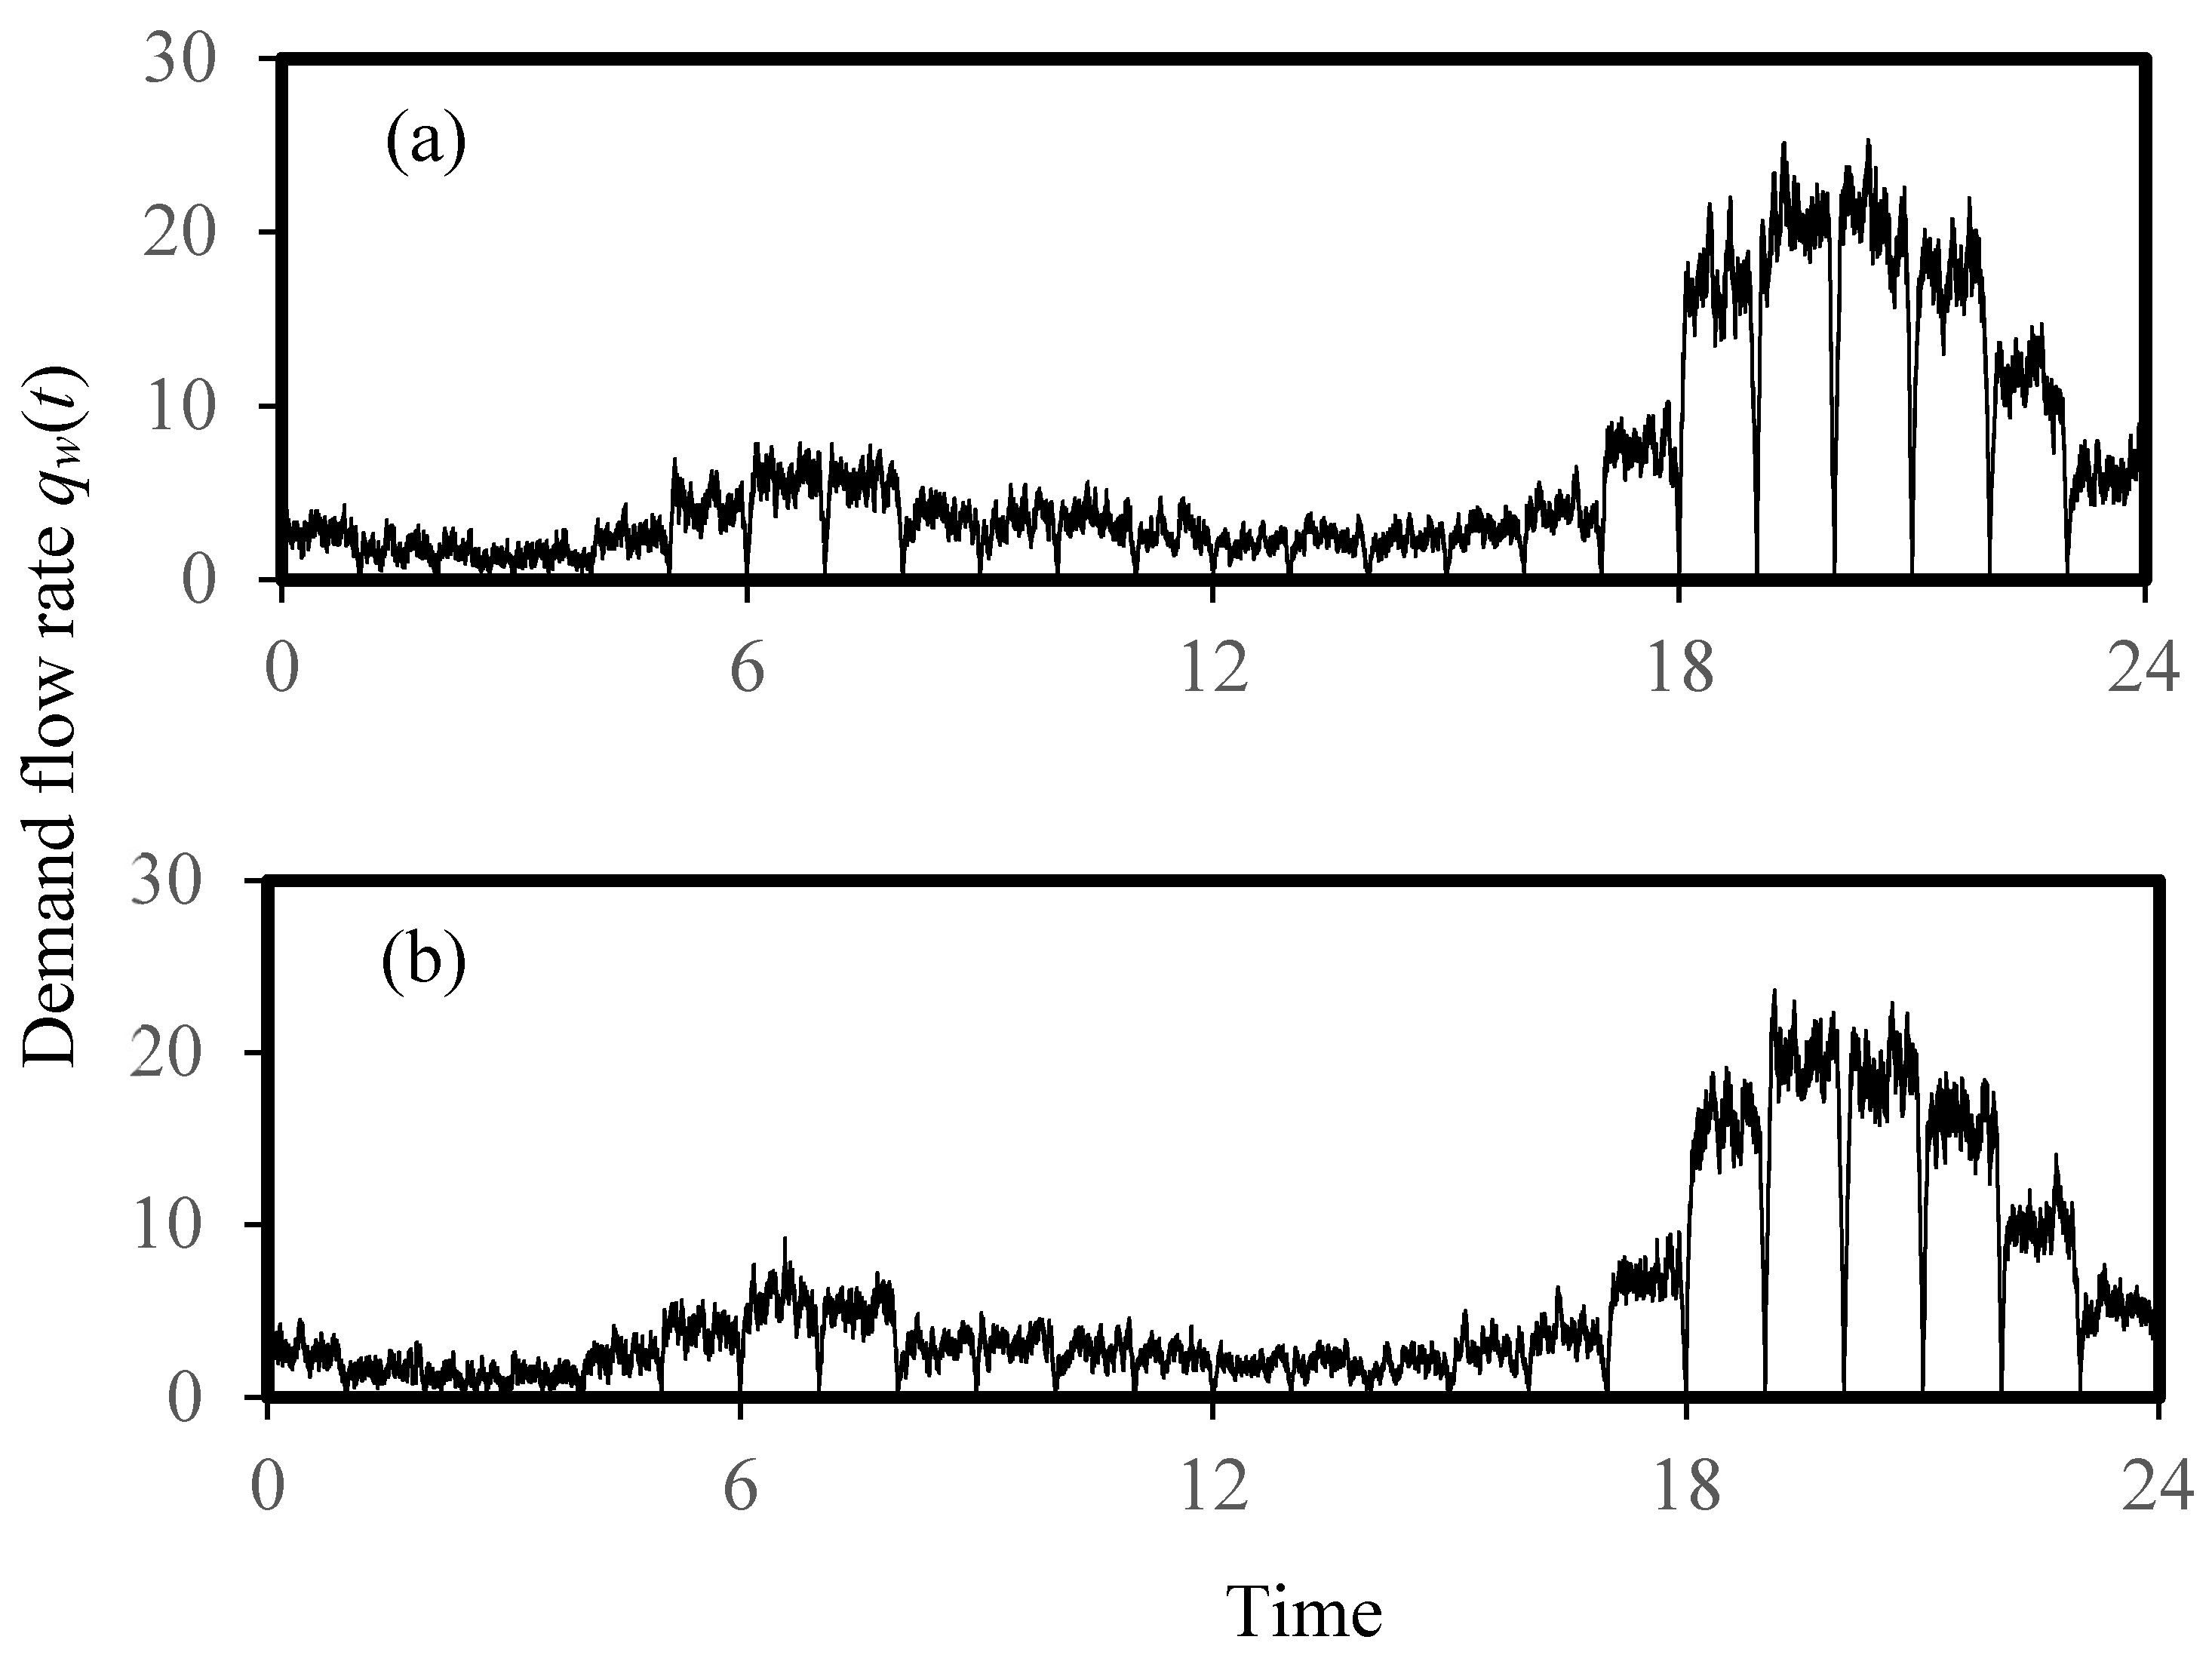
Figure 10 and Figure 11 graph the total demand flow rates in the time series for Case A (all conventional appliances) and Case B (all conventional appliances except for the WELS rated Grade 1 showerheads) respectively.
The daily water consumption results were obtained by summing the demand flow rates across the time series showing in Figure 5, Figure 6, Figure 7, Figure 8 and Figure 9. Results in Figure 10 and Figure 11 showed that the simulated daily consumption ranges for Cases A and B were 534.8–590.0 m3·d−1 (with an average of 562.4 m3·d−1) and 474.4–520.7 m3·d−1 (with an average of 497.6 m3·d−1) respectively, indicating a water consumption reduction of about 11% when low flow showerheads were employed. In some previous studies on household water usage, water consumption was reduced by 3–8% when using low flow showerheads [6,41].
According to the data from a previous study on which this study was based, the yearly shower water consumption per capita with existing showerheads was 24.3 m3·ps−1·year−1 [34], equal to an average of 0.067 m3 per capita per day (365 days per year). Assuming that the 600 showerheads were installed in 600 households and the maximum occupant load in each household was 4.2 (i.e., the same settings as in the above Monte Carlo simulations for showerheads), the total daily shower water consumption would be 168.8 m3·d−1 (=0.067 × 600 × 4.2) on average. When this consumption value was compared with the average shown in Figure 5 ((202.1 + 180.0) m3·d−1/2 = 191.1 m3·d−1), no significant difference (a 11.7% difference) was found. Hence, the models for demand time series proposed in this study were validated.
5.2. Simulated Design Flow Rates for Water Supply Systems
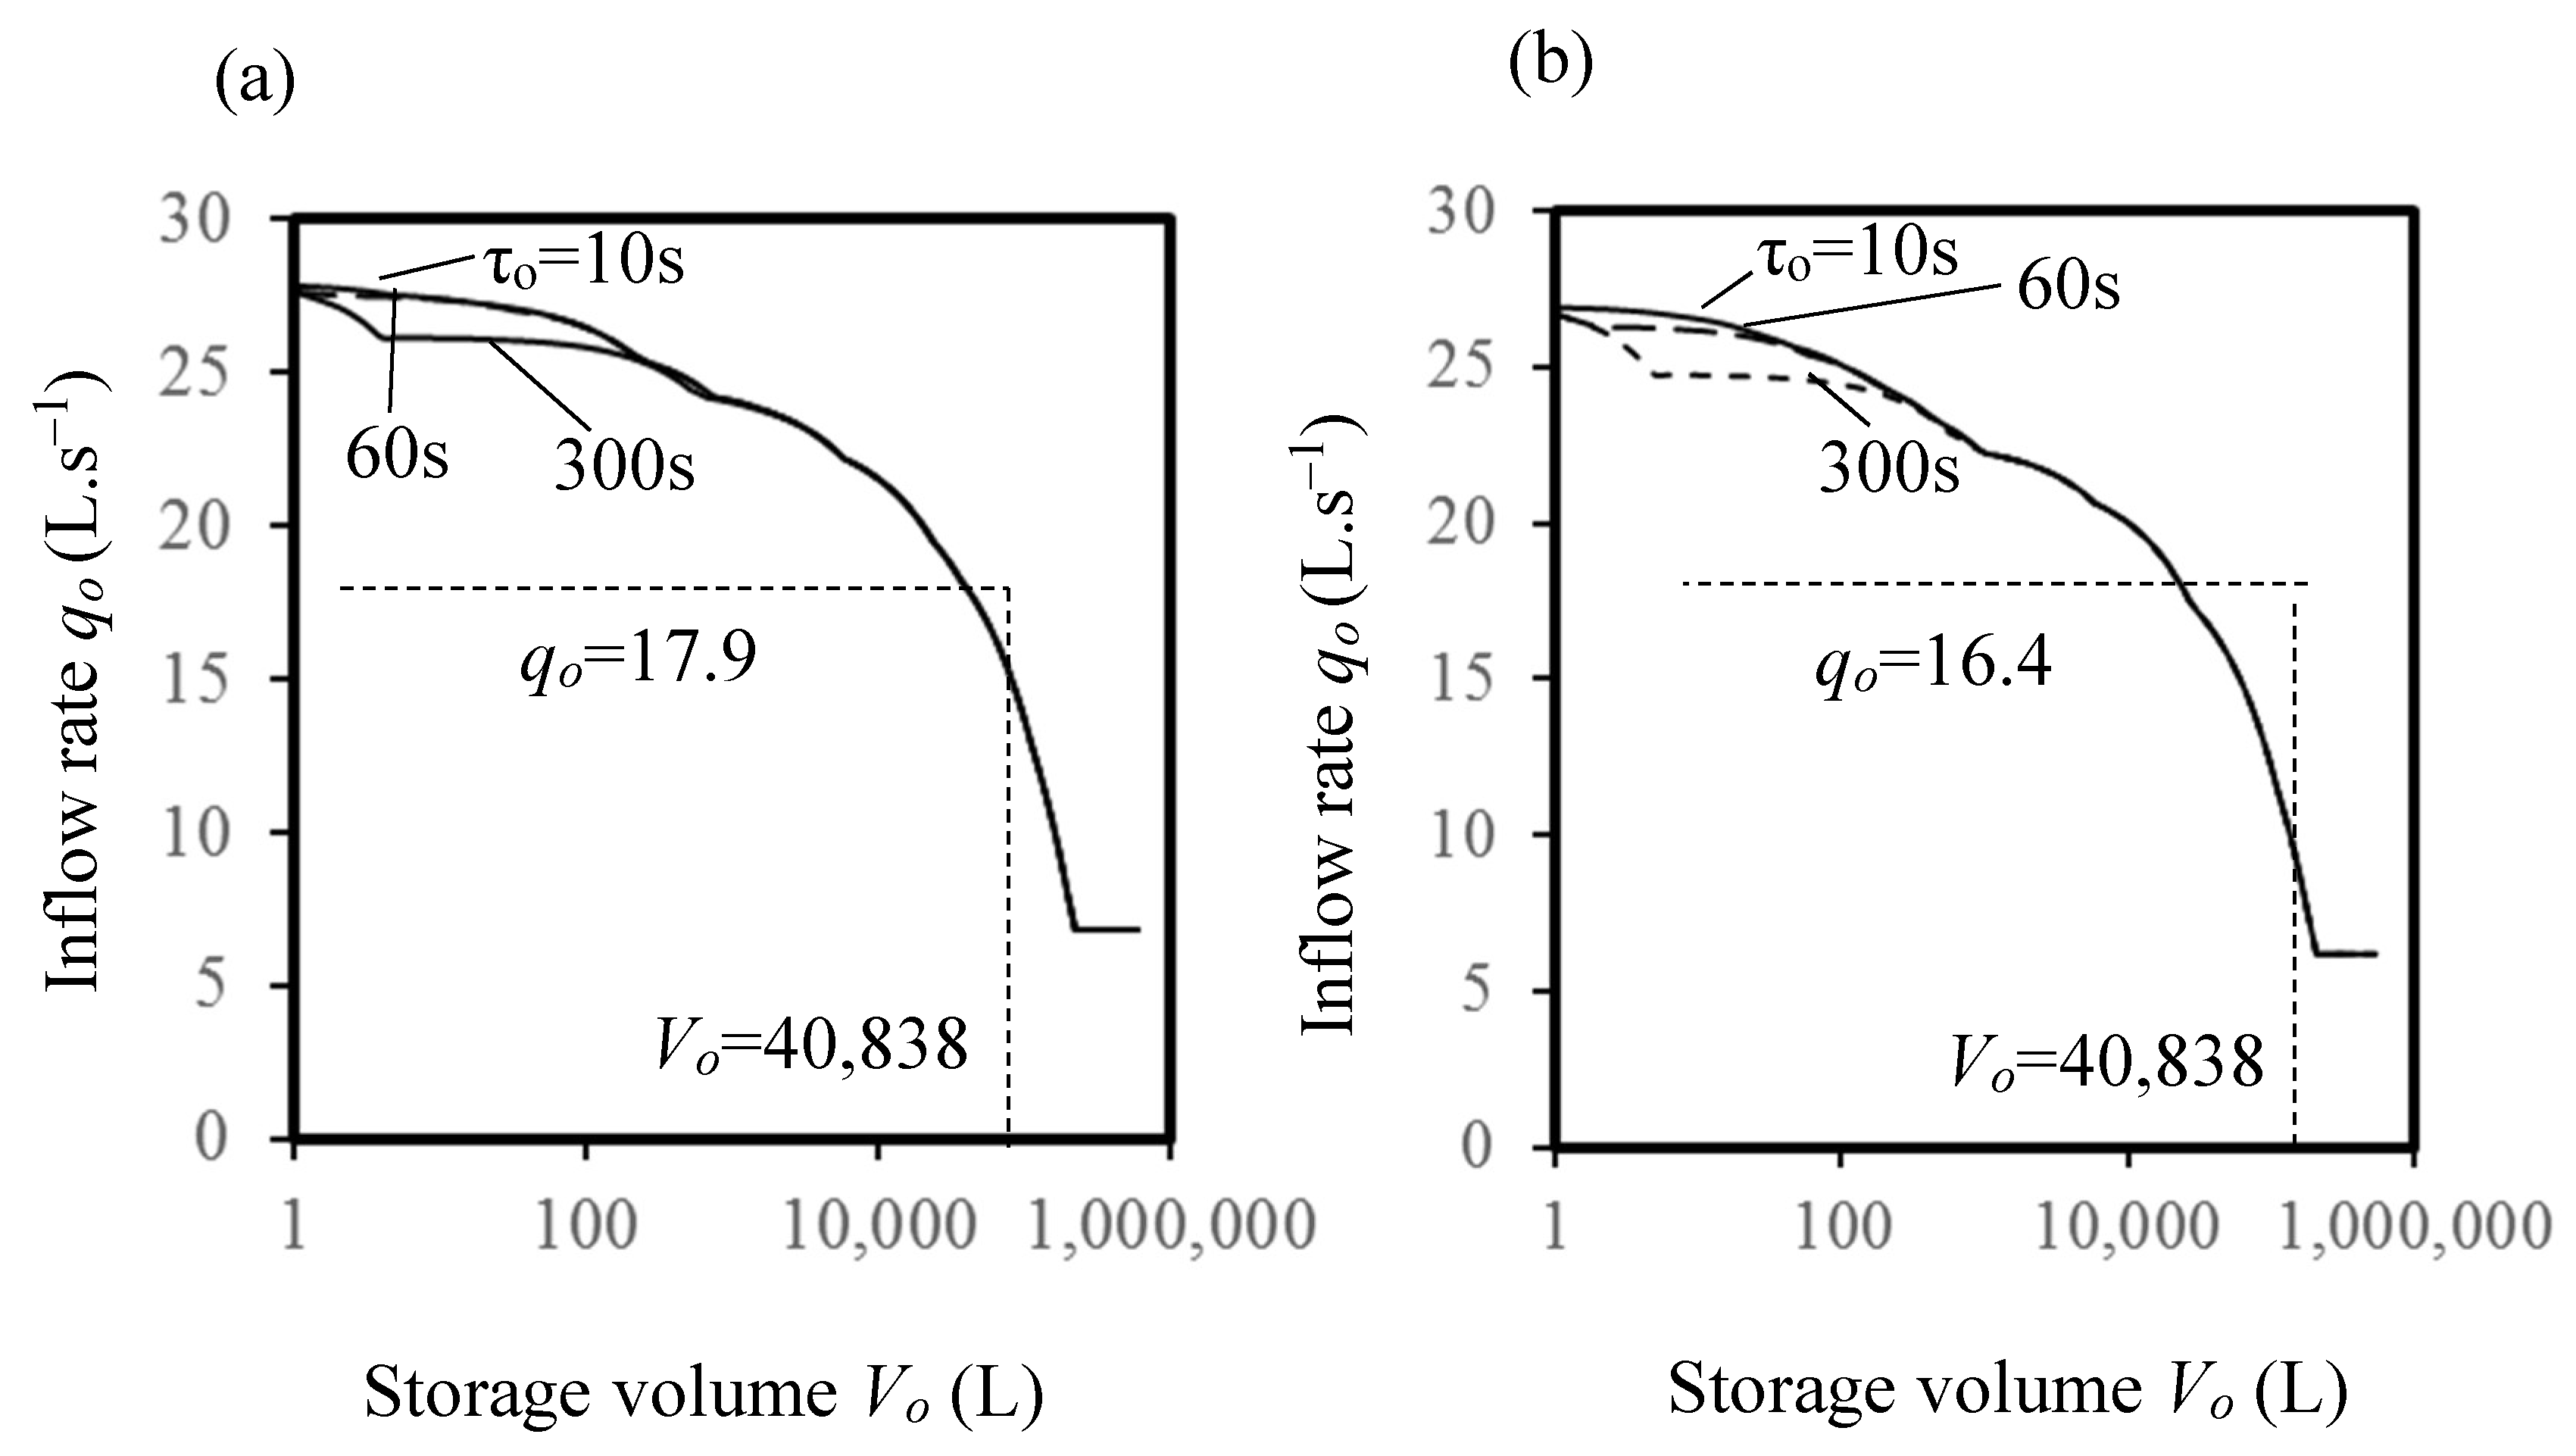
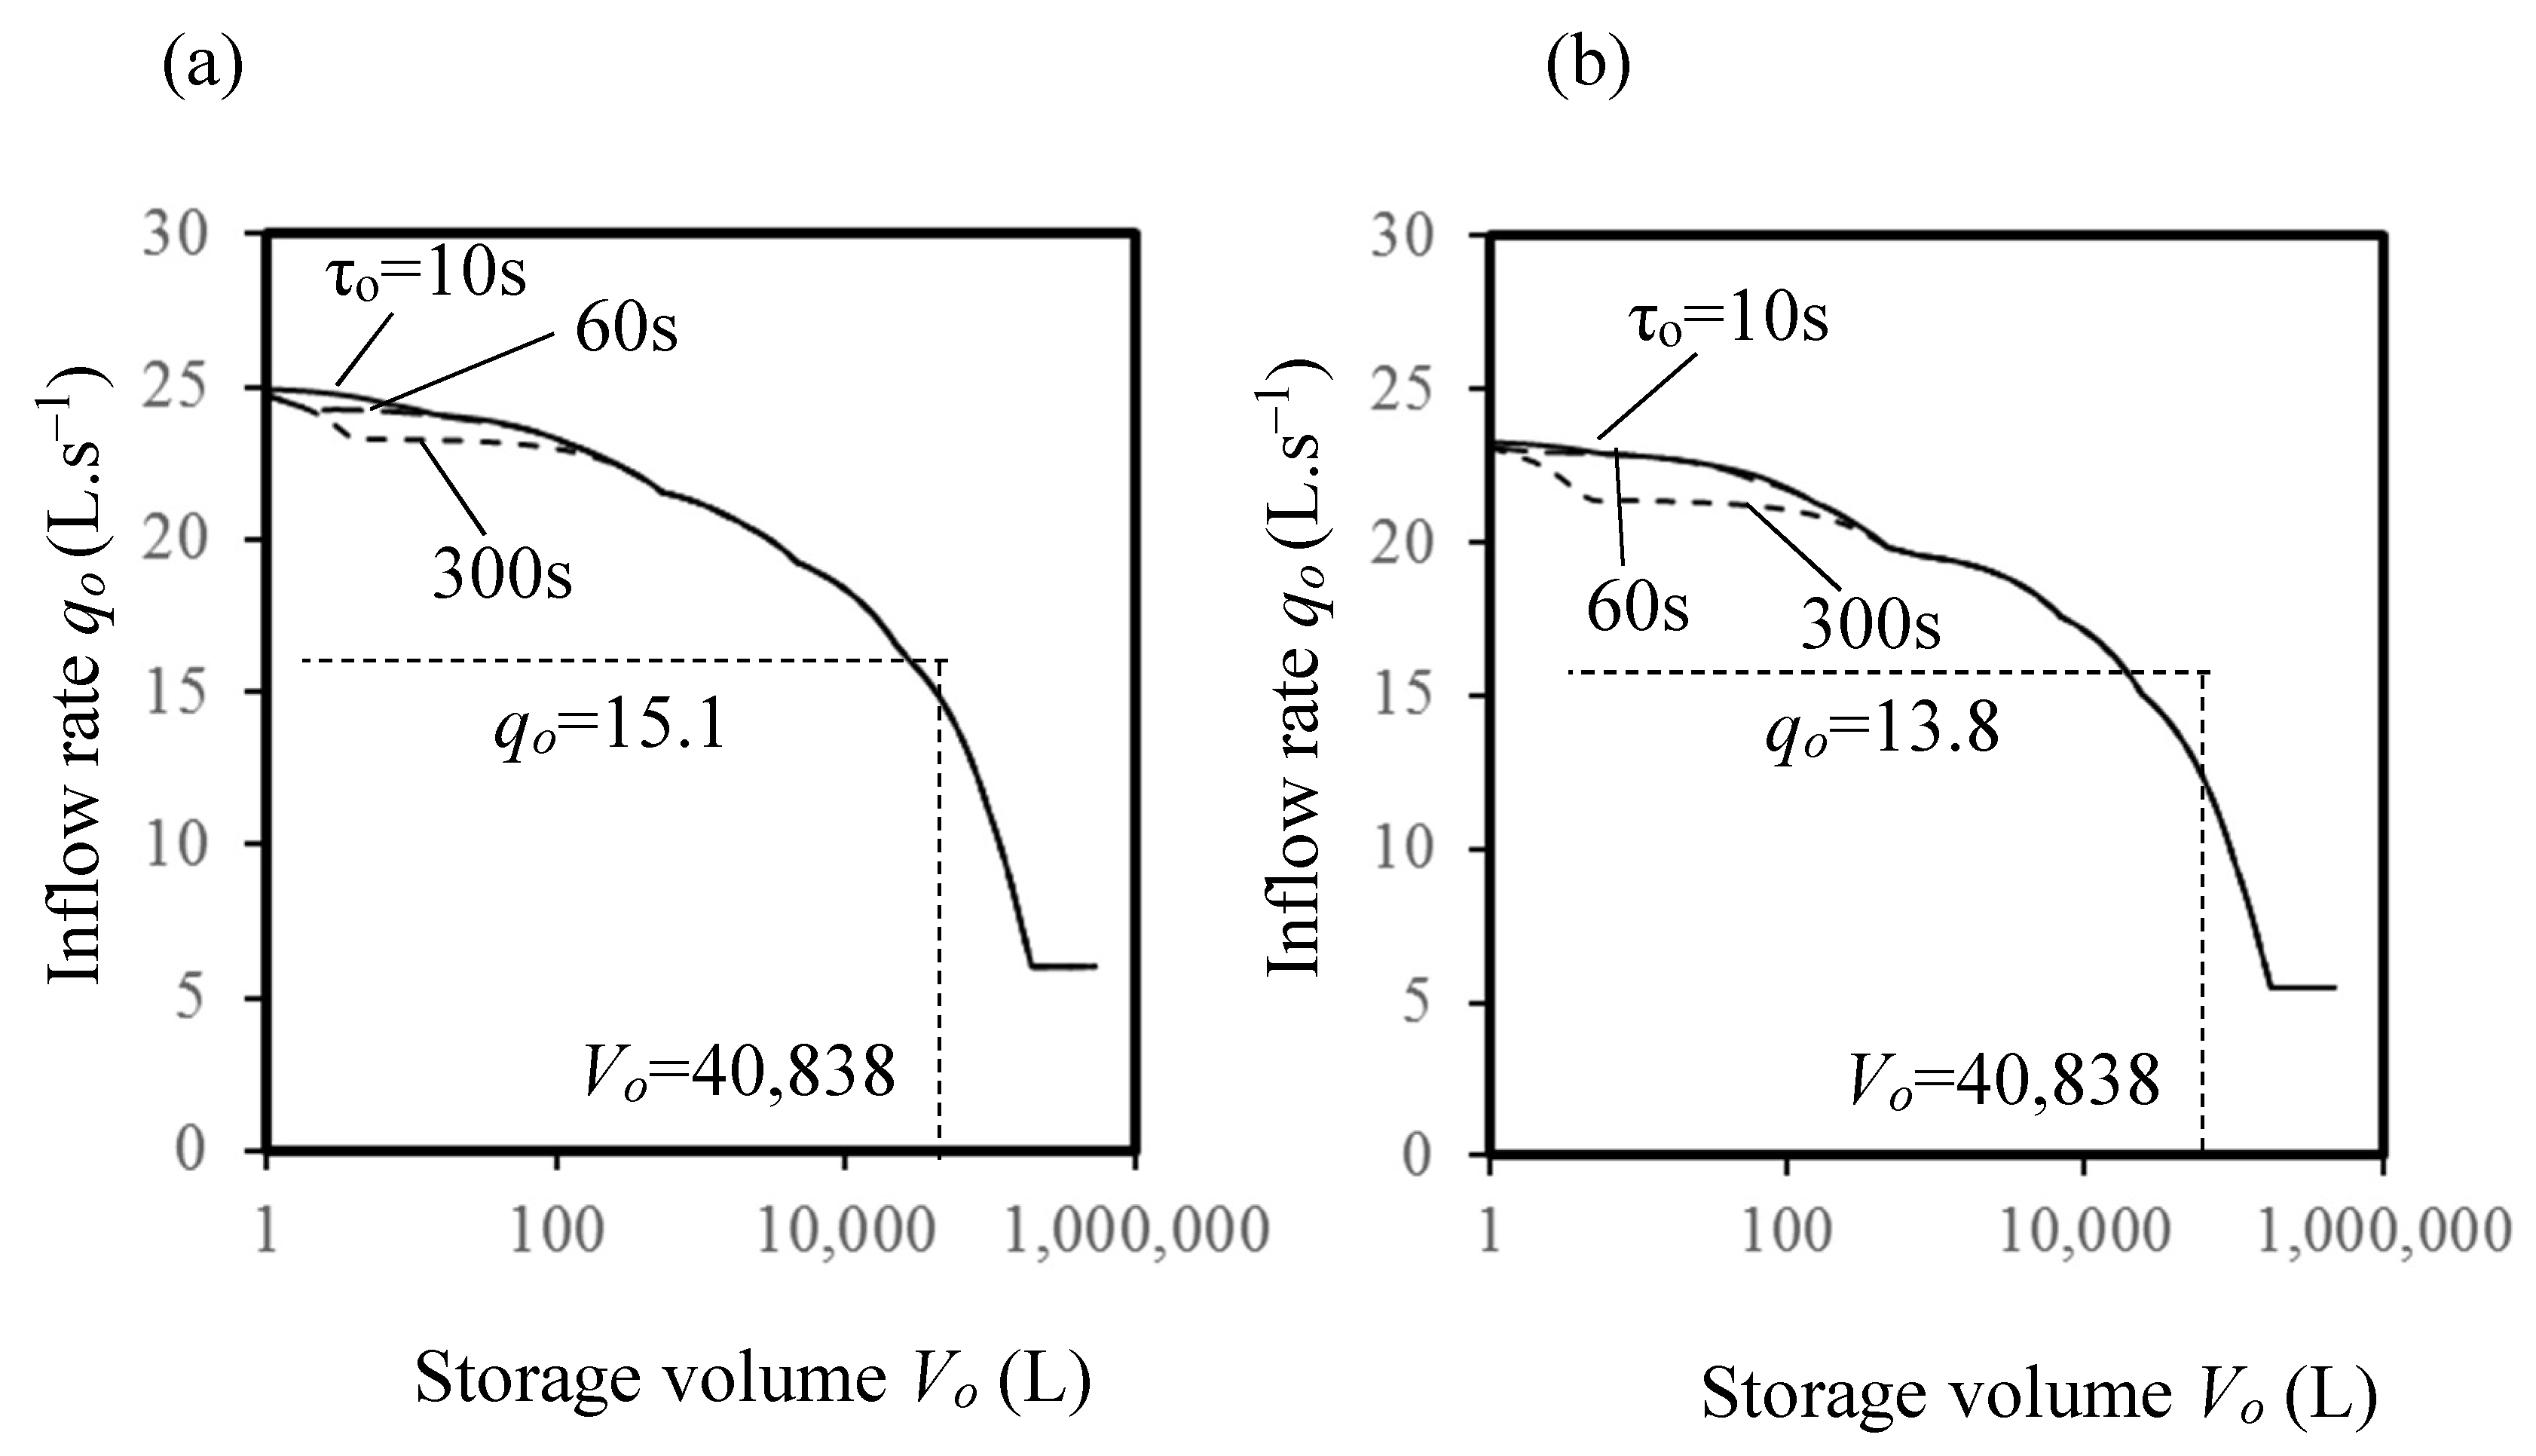
Figure 12 and Figure 13 demonstrate the solution pairs (Vo, qo) for Equation (1) regarding integration time periods τo = 10 s, 60 s and 300 s for the demand flow rates in time series shown in Figure 10 and Figure 11 respectively. Since the simulated solution pairs with an integration time period τo = 1 s for the WC demand in a previous study showed no significant difference from those with τo = 10 s [25], τo = 10 s was chosen as the minimum integration time period in this study. As demonstrated in Figure 12 and Figure 13, a great discrepancy occurred when with a rough integration time period τo (e.g., 300 s) for small storage volumes, i.e., the simulated inflow rate with τo = 300 s was greatly lower than that with τo = 10 or 60 s, while no significant difference was found between the solutions for large storage volumes.
In Hong Kong, the total volume of water tanks (including sump and roof tanks, and the proportion of capacity of sump tank to roof tank is 1:3) shall be on the basis of 135 L for each of the first 10 flats and 90 L thereafter for each additional flat [42]. Assuming the 600 simulated showerheads are installed in 600 flats, then the roof tank volume should be 40,838 L (=). For a storage volume of 40,838 L, the simulated inflow rates for Case A are 17.9 L·s−1 in Figure 12a and 16.4 L·s−1 in Figure 12b. For the same storage volume, the simulated inflow rates for Case B are 15.1 L·s−1 in Figure 13a and 13.8 L·s−1 in Figure 13b. Due to the water consumption reduction (a reduction of 11%) produced by the low flow showerheads, a reduced inflow rate (a reduction of 15%) can be seen in Case B. The minimum inflow rates shown in Figure 12a,b and Figure 13a,b are 6.8 L·s−1, 6.2 L·s−1, 6.0 L·s−1 and 5.5 L·s−1 respectively.
5.3. Evaluation of Energy Efficiency for Water Supply Systems with Different Design Flow Rates
A case of a high-rise roof tank water supply system for appliances including showerheads, wash basins, kitchen sinks and washing machines (with an installation number of 600 for each appliance type) is presented in Table 1, and its schematic drawing is illustrated in Figure 4. Water was pumped to the roof tank at the design flow rate through a 108-mm-diameter pipe. A roof tank volume of 40,838 L (41 m3) was adopted, and the daily water consumption and inflow rate of the up-feed pipe were determined based on the simulation results shown in Figure 10, Figure 11, Figure 12 and Figure 13. In accordance with the design practice, the water velocity in the up-feed pipe, which was obtained from the design inflow rate divided by the pipe cross-sectional area, was kept in a range from 1 to 2 m·s–1. The total static head for hl = 100 m was considered and a friction head loss Hf for an equivalent pipe length hfo = 150 m was included. Obtained from the pipe sizing chart in Plumbing Engineering Services Design Guide [23], the values of friction loss per meter run for Cases A and B were 0.037 and 0.027 m per meter run respectively; after multiplying them by the equivalent pipe length hfo, the values of Hf were 5.55 m and 4.05 m for Cases A and B respectively. Besides, an average height of water consumption locations hd = 50 m and an overall pump efficiency ηov = 0.5625 were adopted. By assuming the desired minimum water pressure head at the roof tank inlet to be zero (i.e., Ho = 0), the energy efficiency of the water supply system example was calculated using Equation (8), and the outcome is summarized in Table 2.
According to Table 2, with a reduced inflow rate in the up-feed pipe as in Case B (i.e., with low flow showerheads for bathing), the system energy efficiency can increase from 0.266 to 0.270, corresponding to an efficiency increase of 1.5%. This is the result of a lower friction head loss in the pipelines. However, the efficiency increase is only slight because the low value (0.008–0.1) of the d’Arcy friction factor λ [43] expressed in Equation (5) weakens the influence of flow velocity on friction loss in pipelines.
Nevertheless, water consumption and thus daily pumping energy can be greatly reduced due to the use of low flow showerheads for bathing. If 13% (35–39 kWh) of the pumping energy is saved daily, a total of 12.8–14.2 MWh can be saved yearly.
6. Conclusions
As large and complex plumbing systems in high-rise buildings feed large amounts of demand points, the adoption of low flow showerheads in these buildings will not only contribute to a great reduction of shower water use in the whole water system, but also further influence the water supply system design. Hence, it is necessary to justify the pipe sizes, storage volume and pumping flow rates of existing water supply systems in terms of the use of low flow showerheads. This study used Monte Carlo simulations to evaluate the design flow rate for a typical high-rise roof tank water supply system in Hong Kong with the installation of low flow showerheads. The simulation results demonstrate that a full installation of low flow showerheads can decrease the design flow rate by 15%, corresponding to an energy efficiency improvement of 1.5% with the existing pipe sizes. The potential for water savings and associated energy savings can be significantly higher when all installed appliances in homes are water efficient (e.g., showerheads, water taps, washing machines). Further work is required to evaluate the design practices of water supply systems for a sustainable future. This study provides a framework of evaluation regarding the impact to a water system replaced with water efficient appliances.
It should be noted that a limitation of this study is the installation of WELS Grade 1 showerheads. As those showerheads were most water efficient, the results demonstrated the maximum reduction of shower water use theoretically.
Author Contributions
Y.Z. conducted the M.C. simulation; Y.Z., L.-t.W. and K.-w.M. performed the data analysis and manuscript writing.
Funding
The work described in this paper was partially supported by grants from The Hong Kong Polytechnic University (GYBA6, GYBFN).
Acknowledgments
Thank Department of Building Services Engineering, The Hong Kong Polytechnic University for the administrative and technical support for the research.
Conflicts of Interest
The authors declare no conflict of interest.
References
- United Nations. Available online: http://www.un.org/en/sections/issues-depth/global-issues-overview/ (accessed on 3 March 2017).
- Hong Kong Water Supplies Department. Combat against Climate Change: Exploit New Water Resources and Foster Water Conservation Culture; Annual Report 2014/15; HKSAR: Hong Kong, China, 2015.
- Hong Kong Water Supplies Department. Domestic Water Consumption Survey—Key Survey Findings—Fact Sheet; HKSAR: Hong Kong, China, 2011.
- Singapore’s National Water Agency. Available online: https://www.pub.gov.sg/watersupply/singaporewaterstory (accessed on 30 October 2017).
- Willis, R.M.; Stewart, R.A.; Giurco, D.P.; Talebpour, M.R.; Mousavinejad, A. End use water consumption in households: Impact of socio-demographic factors and efficient devices. J. Clean. Prod. 2013, 60, 107–115. [Google Scholar] [CrossRef]
- Renwick, M.E.; Archibald, S.O. Demand side management policies for residential water use: Who bears the conservation burden? Land Econ. 1998, 74, 343–359. [Google Scholar] [CrossRef]
- Millock, K.; Nauges, C. Household adoption of water-efficient equipment: The role of socio-economic factors, environmental attitudes and policy. Environ. Resour. Econ. 2010, 46, 539–565. [Google Scholar] [CrossRef]
- Hong Kong Water Supplies Department. Available online: http://www.wsd.gov.hk/en/plumbing-engineering/water-efficiency-labelling-scheme/index.html (accessed on 29 October 2017).
- Australian Government. Available online: http://www.waterrating.gov.au/about-wels (accessed on 16 March 2017).
- Public Unities Board. Water Efficiency Labelling Scheme (Voluntary & Mandatory); Public Unities Board: Singapore, 2013. [Google Scholar]
- United States Environmental Protection Agency (EPA). Available online: https://www.epa.gov/watersense/about-watersense (accessed on 29 October 2017).
- The Water Label Company Limited. Available online: http://www.water-efficiencylabel.org.uk/home.asp (accessed on 2 November 2017).
- Yamazaki, H.; Toyosada, K.; Shimizu, Y.; Dejima, S. Potential for CO2 reductions in Viet Nam by the introduction of water-saving showers. In Proceedings of the 39th International Symposium of CIB W062 Water Supply and Drainage for Buildings, Nagano, Japan, 17–20 September 2013. [Google Scholar]
- Lee, M.; Chen, C.; Cheng, C.; Liao, W.; Nagata, K.; Sato, M. Shower comfort in different water supply pressure conditions in Taiwan. In Proceedings of the 41st International Symposium of CIB W062 Water Supply and Drainage for Buildings, Beijing, China, 18–20 August 2015. [Google Scholar]
- Wong, L.T.; Mui, K.W. A Review of Demand Models for Water Systems in Buildings including a Bayesian Approach. Water 2018, 10, 1078. [Google Scholar] [CrossRef]
- Hunter, R.B. Methods of Estimating Loads in Plumbing Systems; US Dept. of Commerce, National Bureau of Standards: Gaithersburg, MD, USA, 1940.
- Wise, A.F.E.; Swaffield, J. Water, Sanitary and Waste Services for Buildings; Routledge: London, UK, 2012. [Google Scholar]
- CIBSE. Public Health Engineering; CIBSE: Norfolk, UK, 2004. [Google Scholar]
- Murakawa, S.; Takata, H. Development of the calculating method for cold and hot water consumption based on the fixture usage in the time series through a day—A case study of apartment houses. In Proceedings of the CIB W062 International Symposium on Water Supply and Drainage for Buildings, Iasi, Romania, 18–19 September 2002; pp. 1–13. [Google Scholar]
- Murakawa, S.; Takata, H.; Saito, C.; Abe, M.; Toyosada, K. Development of the calculating method for the loads of cold and hot water consumption in a business hotel (Part 2) Dynamic estimation for the loads of cold and hot water demands. In Proceedings of the 41st International Symposium of CIB W062 Water Supply and Drainage for Buildings, Beijing, China, 18–20 August 2015. [Google Scholar]
- Murakawa, S.; Takata, H. Development of the calculating method for the loads of cold and hot water consumption in the apartment houses. In Proceedings of the 2003 CIB W062 International Symposium Water Supply and Drainage for Buildings, Ankara, Turkey, 11–12 September 2003. [Google Scholar]
- Wu, G.; Sakaue, K.; Hayakawa, K.; Murakawa, S.; Inada, T. Verification of calculating method using the Monte Carlo method for water supply demands: The water consumption of mixed-use building for rent. In Proceedings of the 41st International Symposium of CIB W062 Water Supply and Drainage for Buildings, Beijing, China, 18–20 August 2015. [Google Scholar]
- The Institute of Plumbing. Plumbing Engineering Services Design Guide; The Institute of Plumbing: Essex, UK, 2002. [Google Scholar]
- CEN-European Committee for Standardization. EN 806-3:2006 Specifications for Installations Inside Buildings Conveying Water for Human Consumption—Part 3: Pipe Sizing—Simplified Method; CEN: Brussels, Belgium, 2006. [Google Scholar]
- Wong, L.T.; Mui, K.W.; Zhou, Y. Design of tank water supply systems in buildings. In Proceedings of the CIB W062 International Symposium on Water Supply and Drainage for Buildings, Sao Paulo, Brazil, 8–10 September 2014; pp. 223–230. [Google Scholar]
- Bleys, B.; Van den Bossche, P.; Kuborn, X. Measurements of water consumption in apartment buildings. In Proceedings of the 38th International Symposium CIB W062 on Water Supply and Drainage for Buildings, Edinburgh, Scotland, 27–30 August 2012. [Google Scholar]
- Vrana, J.; Jaron, Z.; Kucharik, M. Peak flow rates measured in residential building. In Proceedings of the 42nd International Symposium of CIB W062 on Water Supply and Drainage for Buildings, Kosice, Slovakia, 29 August–1 September 2016. [Google Scholar]
- Blokker, M. Stochastic Water Demand Modelling, Hydraulics in Water Distribution Networks; IWA Publishing: London, UK, 2011. [Google Scholar]
- Wong, L.T. Occupant load assessment for old residential high-rise buildings. Archit. Sci. Rev. 2003, 46, 273–277. [Google Scholar] [CrossRef]
- Wong, L.T.; Mui, K.W. A survey of the sanitation load for domestic high-rise building estates in Hong Kong. In Proceedings of the 30th International Symposium on Water Supply and Drainage for Buildings, CIBW062, CSTB, Paris, France, 16–17 September 2004; pp. 16–17. [Google Scholar]
- Wong, L.T.; Mui, K.W. Determining the domestic drainage loads for high-rise buildings. Archit. Sci. Rev. 2004, 47, 347–354. [Google Scholar] [CrossRef]
- Cheng, C.; Yen, C.; Wong, L.; Ho, K. An evaluation tool of infection risk analysis for drainage systems in high-rise residential buildings. Build. Serv. Eng. Res. Technol. 2008, 29, 233–248. [Google Scholar] [CrossRef]
- Mui, K.W.; Wong, L.T. Modelling occurrence and duration of building drainage discharge loads from random and intermittent appliance flushes. Build. Serv. Eng. Res. Technol. 2013, 34, 381–392. [Google Scholar] [CrossRef]
- Wong, L.T.; Mui, K.W.; Zhou, Y. Impact evaluation of low flow showerheads for Hong Kong residents. Water 2016, 8, 305. [Google Scholar] [CrossRef]
- Hong Kong Water Supplies Department. Available online: https://www.wsd.gov.hk/en/plumbing-engineering/water-efficiency-labelling-scheme/wels-on-showers-for-bathing/voluntary-water-efficiency-labelling-scheme-on-sho/index.html (accessed on 29 September 2017).
- Wong, L.T.; Liu, W. Demand analysis for residential water supply systems in Hong Kong. HKIE Trans. 2008, 15, 24–28. [Google Scholar] [CrossRef]
- Cheung, C.; Mui, K.W.; Wong, L.T. Energy efficiency of elevated water supply tanks for high-rise buildings. Appl. Energy 2013, 103, 685–691. [Google Scholar] [CrossRef]
- Kaya, D.; Yagmur, E.A.; Yigit, K.S.; Kilic, F.C.; Eren, A.S.; Celik, C. Energy efficiency in pumps. Energy Convers. Manag. 2008, 49, 1662–1673. [Google Scholar] [CrossRef]
- Wong, L.T.; Mui, K.W.; Lau, C.; Zhou, Y. Pump efficiency of water supply systems in buildings of Hong Kong. Energy Procedia 2014, 61, 335–338. [Google Scholar] [CrossRef]
- Ingle, S.; King, D.; Southerton, R. Design and sizing of water supply systems using loading units—Time for a change. In Proceedings of the 40th CIBW062 International Symposium of Water Supply and Drainage for Buildings, Sao Paulo, Brazil, 4–10 September 2014; pp. 8–10. [Google Scholar]
- Price, J.I.; Chermak, J.M.; Felardo, J. Low-flow appliances and household water demand: An evaluation of demand-side management policy in Albuquerque, New Mexico. J. Environ. Manag. 2014, 133, 37–44. [Google Scholar] [CrossRef] [PubMed]
- Hong Kong Water Supplies Department. Handbook on Plumbing Installation for Buildings; HKSAR: Hong Kong, China, 2014.
- Moody, L.F. Friction factors for pipe flow. Trans. ASME 1944, 66, 671–684. [Google Scholar]
Figure 1.
Occupant load variation factor γ(t): (a) weekdays; (b) holidays.

Figure 2.
Per person hourly demand na: (a) showerhead; (b) wash basin; (c) kitchen sink; (d) washing machine.
Figure 2.
Per person hourly demand na: (a) showerhead; (b) wash basin; (c) kitchen sink; (d) washing machine.

Figure 3.
Hourly demand of each appliance type in an apartment: (a) Showerhead; (b) wash basin; (c) kitchen sink; (d) washing machine.
Figure 3.
Hourly demand of each appliance type in an apartment: (a) Showerhead; (b) wash basin; (c) kitchen sink; (d) washing machine.

Figure 4.
A high-rise roof tank water supply system.

Figure 5.
Example demand flow rates for 600 conventional showerheads: (a) Maximum daily consumption (202.1 m3·day−1); (b) minimum daily consumption (180.0 m3·day−1).
Figure 5.
Example demand flow rates for 600 conventional showerheads: (a) Maximum daily consumption (202.1 m3·day−1); (b) minimum daily consumption (180.0 m3·day−1).

Figure 6.
Example demand flow rates for 600 low flow showerheads, i.e., WELS rated Grade 1 showerheads: (a) Maximum daily consumption (132.8 m3·day−1); (b) minimum daily consumption (119.5 m3·day−1).
Figure 6.
Example demand flow rates for 600 low flow showerheads, i.e., WELS rated Grade 1 showerheads: (a) Maximum daily consumption (132.8 m3·day−1); (b) minimum daily consumption (119.5 m3·day−1).

Figure 7.
Example demand flow rates for 600 wash basins: (a) Maximum daily consumption (68.0 m3·day−1); (b) minimum daily consumption (64.6 m3·day−1).
Figure 7.
Example demand flow rates for 600 wash basins: (a) Maximum daily consumption (68.0 m3·day−1); (b) minimum daily consumption (64.6 m3·day−1).

Figure 8.
Example demand flow rates for 600 kitchen sinks: (a) Maximum daily consumption (226.9 m3·day−1); (b) minimum daily consumption (208.0 m3·day−1).
Figure 8.
Example demand flow rates for 600 kitchen sinks: (a) Maximum daily consumption (226.9 m3·day−1); (b) minimum daily consumption (208.0 m3·day−1).

Figure 9.
Example demand flow rates for 600 washing machines: (a) Maximum daily consumption (93.1 m3·day−1); (b) minimum daily consumption (82.4 m3·day−1).
Figure 9.
Example demand flow rates for 600 washing machines: (a) Maximum daily consumption (93.1 m3·day−1); (b) minimum daily consumption (82.4 m3·day−1).

Figure 10.
Total demand flow rates for Case A (all conventional appliances): (a) Maximum daily consumption (590.0 m3·day−1); (b) minimum daily consumption (534.8 m3·day−1).
Figure 10.
Total demand flow rates for Case A (all conventional appliances): (a) Maximum daily consumption (590.0 m3·day−1); (b) minimum daily consumption (534.8 m3·day−1).

Figure 11.
Total demand flow rates for Case B (all conventional appliances except for the WELS rated Grade 1 showerheads): (a) Maximum daily consumption (520.7 m3·day−1); (b) minimum daily consumption (474.4 m3·day−1).
Figure 11.
Total demand flow rates for Case B (all conventional appliances except for the WELS rated Grade 1 showerheads): (a) Maximum daily consumption (520.7 m3·day−1); (b) minimum daily consumption (474.4 m3·day−1).

Figure 12.
Solutions of inflow rate and storage volume for Case A: (a) For the maximum demand flow rate in time series in Figure 10a; (b) for the minimum demand flow rate in time series in Figure 10b.

Figure 13.
Solutions of inflow rate and storage volume for Case B: (a) For the maximum demand flow rate in time series in Figure 11a; (b) for the minimum demand flow rate in time series in Figure 11b.


Table 1.
Values of input parameters.
| Appliance | Parameter | Value | Reference | ||
|---|---|---|---|---|---|
| Conventional | Showerhead | Flow rate (L/s) | Max | 0.20 | [34] |
| Min | 0.10 | [34] | |||
| Mean | 0.16 | [34] | |||
| Discharge time (s) | Max | 359 | [34] | ||
| Min | 240 | [34] | |||
| Mean | 310.2 | [34] | |||
| Wash basin | Flow rate (L/s) | Max | 0.23 | [30] | |
| Min | 0.03 | [35] | |||
| AM1 | 0.13 | [36] | |||
| Discharge time (s) | GM2 | 23.2 | [36] | ||
| Kitchen sink | Flow rate (L/s) | Max | 0.26 | [30] | |
| Min | 0.03 | [35] | |||
| AM1 | 0.15 | [36] | |||
| Discharge time (s) | GM2 | 257 | [36] | ||
| Washing machine | Flow rate (L/s) | AM1 | 0.2 | [36] | |
| Discharge time (s) | GM2 | 150 | [36] | ||
| Low flow | Showerhead | Flow rate (L/s) | Max | 0.15 | [35] |
| Min | 0.07 | [35] | |||
| Mean | 0.11 | ||||
| Discharge time (s) | Mean | 310.2 | [34] | ||
1 AM: arithmetic mean; 2 GM: geometric mean.
Table 2.
The case of a high-rise roof tank water supply system.
| Parameter | Case A | Case B |
|---|---|---|
| Total tank size (m3) Vo | 41 | 41 |
| Daily consumption (m3) V∞ | 535–590 | 474–521 |
| Design inflow rate (L·s−1) qo | 17.9 | 15.1 |
| Feed pipe water velocity (m·s−1) vo | 1.95 | 1.60 |
| Friction head loss (m) Hf | 5.55 | 4.05 |
| System energy efficiency αt | 0.266 | 0.270 |
| Total electricity power (kW) Pt | 1.77 | 1.09 |
| Daily pumping energy (kWh) Epump | 274–302 | 239–263 |
© 2019 by the authors. Licensee MDPI, Basel, Switzerland. This article is an open access article distributed under the terms and conditions of the Creative Commons Attribution (CC BY) license (http://creativecommons.org/licenses/by/4.0/).
Share and Cite
MDPI and ACS Style
Zhou, Y.; Mui, K.-w.; Wong, L.-t. Evaluation of Design Flow Rate of Water Supply Systems with Low Flow Showering Appliances. Water 2019, 11, 100. https://doi.org/10.3390/w11010100
AMA Style
Zhou Y, Mui K-w, Wong L-t. Evaluation of Design Flow Rate of Water Supply Systems with Low Flow Showering Appliances. Water. 2019; 11(1):100. https://doi.org/10.3390/w11010100
Chicago/Turabian StyleZhou, Yang, Kwok-wai Mui, and Ling-tim Wong. 2019. "Evaluation of Design Flow Rate of Water Supply Systems with Low Flow Showering Appliances" Water 11, no. 1: 100. https://doi.org/10.3390/w11010100
Note that from the first issue of 2016, this journal uses article numbers instead of page numbers. See further details here.