Article

Interpreting Farmers’ Perceptions of Risks and Benefits Concerning Wastewater Reuse for Irrigation: A Case Study in Emilia-Romagna (Italy)

1
Department of Agricultural and Food Sciences (DISTAL), University of Bologna, 40127 Bologna, Italy
2
Department of Statistical Sciences, University of Bologna, 40126 Bologna, Italy
*
Author to whom correspondence should be addressed.
Water 2019, 11(1), 108; https://doi.org/10.3390/w11010108
Submission received: 12 November 2018 / Revised: 23 December 2018 / Accepted: 2 January 2019 / Published: 9 January 2019
(This article belongs to the Collection Water Policy Collection)

Abstract

:
Water recycling is becoming progressively more important as the need for Integrated Urban Water Management (IUWM) is increasing to ensure a transition towards a more sustainable use for water. Perceptions and public acceptance of water reuse are recognised as paramount factors for the successful introduction of wastewater reuse projects, regardless of the strength of scientific evidence in their favour. This article analyses perceptions of risks and benefits of using treated wastewater for irrigation purposes in agriculture when dealing with different crops. Data from an original farmer survey are analysed through descriptive statistics and a classification tree approach. The study reveals limited knowledge of wastewater treatment, yet a good level of openness towards the reuse of wastewater for irrigation. A lower risk perception and a higher acceptance level are mainly explained by positive expectations with regard to the environmental characteristics of effluent water, higher education, and specific cropping choices. Enhancing information availability is also found to positively affect social acceptance. The ease of converting current water-management practices to the new water source explains the perceived benefits of reusing water.

1. Introduction

Water scarcity, due to climate variability and increased urbanization, has emerged as one of the most pressing problems in the 21st century [1]. Agriculture is the sector which uses the largest share of water in most countries [2,3], being currently responsible for 70% of water abstraction worldwide [4], while irrigated land is expected to expand significantly during the next decades [5].
The increasing gap between water needs and availability affects the ability to secure freshwater supplies and implies increasing provisioning costs for agricultural systems and actors, with potentially destabilising effects for markets. On the demand side, water consumption in the agriculture sector is expected to rise in the future due to different drivers, such as the intensification of agricultural production—mainly driven by population growth—and increasing standards of living (UNESCO, 2016; accessible at: https://unesdoc.unesco.org/ark:/48223/pf0000244041). On the supply side, climate change will affect water resources in many ways: through extreme events (i.e., floods and droughts), by changing patterns and amounts of precipitation, or by affecting water quality through changes in runoff, river flows, and water retention. The severity and length of droughts will progressively increase [6], especially in southern and Mediterranean Europe [7].
Within the agriculture sector, the abovementioned trends encourage action to reduce pressure on water resources either by reducing water demand or by enhancing water supply. In the latter case, wastewater reclamation is viewed as a valuable opportunity on socioeconomic, policy, and environmental grounds. The socioeconomic argument is that it embeds significant (product and process) eco-innovation potential, putting into practice the concepts of reducing, reusing, and recycling in agriculture, which are gaining momentum through the concept of the Circular Economy [8]. On policy grounds, the reuse of treated wastewater favours the competitiveness of the European Union (EU) water industry (Lisbon Strategy), is in line with the EU Common Agricultural Policy, and supports compliance with the Water Framework Directive (WFD-Directive 2000/60/EC) [9] and the Sustainable Development Goals (SDG) (Johannesburg). Finally, on environmental grounds, together with favouring adaptation to climate change and reducing the need for water abstraction, wastewater reuse can contribute to reduce water eutrophication and/or chemical and microbiological contamination [10,11]. Its returns also spread to non-water-scarce areas, benefiting greenhouses and providing, to some extent, renewable nutrients supplies [12].
While wastewater reuse is not a novelty, globally, around 80% of water is not treated [13] and only “15% of the generated wastewater and 41% of the treated wastewater are destined worldwide for agricultural irrigation” [14]. In Europe, especially in the Mediterranean area [7], despite water being an increasingly limited resource, its reuse is not widely employed [15].
Amongst the barriers preventing its exploitation and hindering new investments (e.g., financial constraints, inadequate regulatory frameworks, engineering issues, etc.), several researchers have pointed out the importance of social acceptance and beliefs in influencing the implementation of new water projects or, more generally, the use of innovation [16,17,18,19,20]. Several technical schemes have failed at the international level because of rejection by communities. Examples of factors potentially influencing people’s acceptance of recycling water schemes are represented by perceived risks and benefits, perceived control over the quality of water, trust in authorities, knowledge about the schemes, and personal feelings and emotions about these schemes [21].
The existing literature tends to focus on water innovation issues from a macro-oriented perspective, rather than on micro-level evidence highlighting factors driving investments in wastewater treatment (WWT) technology and social acceptance [22]. Additionally, there has been limited theoretical focus on how risk perceptions may mediate the social acceptance process, and very few studies have attempted to identify individual characteristics linked to public acceptance of alternative water sources [23], or beliefs affecting (non) acceptance [24] in the agriculture sector. This is partially because the assessment of whether individuals are keen to accept a technology represents a relatively recent question [6], and this calls for a better understanding of the factors leading to positive or negative perceptions on the part of farmers [25].
Against this background, this paper seeks to shed additional light on factors explaining farmers’ acceptance of treated wastewater reuse for irrigated agriculture, and how greater acceptance of wastewater uses might be fostered. This is accomplished by using micro-level information collected through a survey on opinion variables and beliefs, as well as individual and farm characteristics, which are used as potential drivers explaining attitudes towards the use of treated wastewater for irrigation. Specifically, we assess risk perceptions towards the reuse of wastewater for irrigated agriculture. Moreover, given that risks appear more acceptable when advantages are better understood [26], in addition to analysing negative thoughts and feelings concerning perceived risk, a positive attitude dimension is accounted for by looking at perceived benefits/advantages.
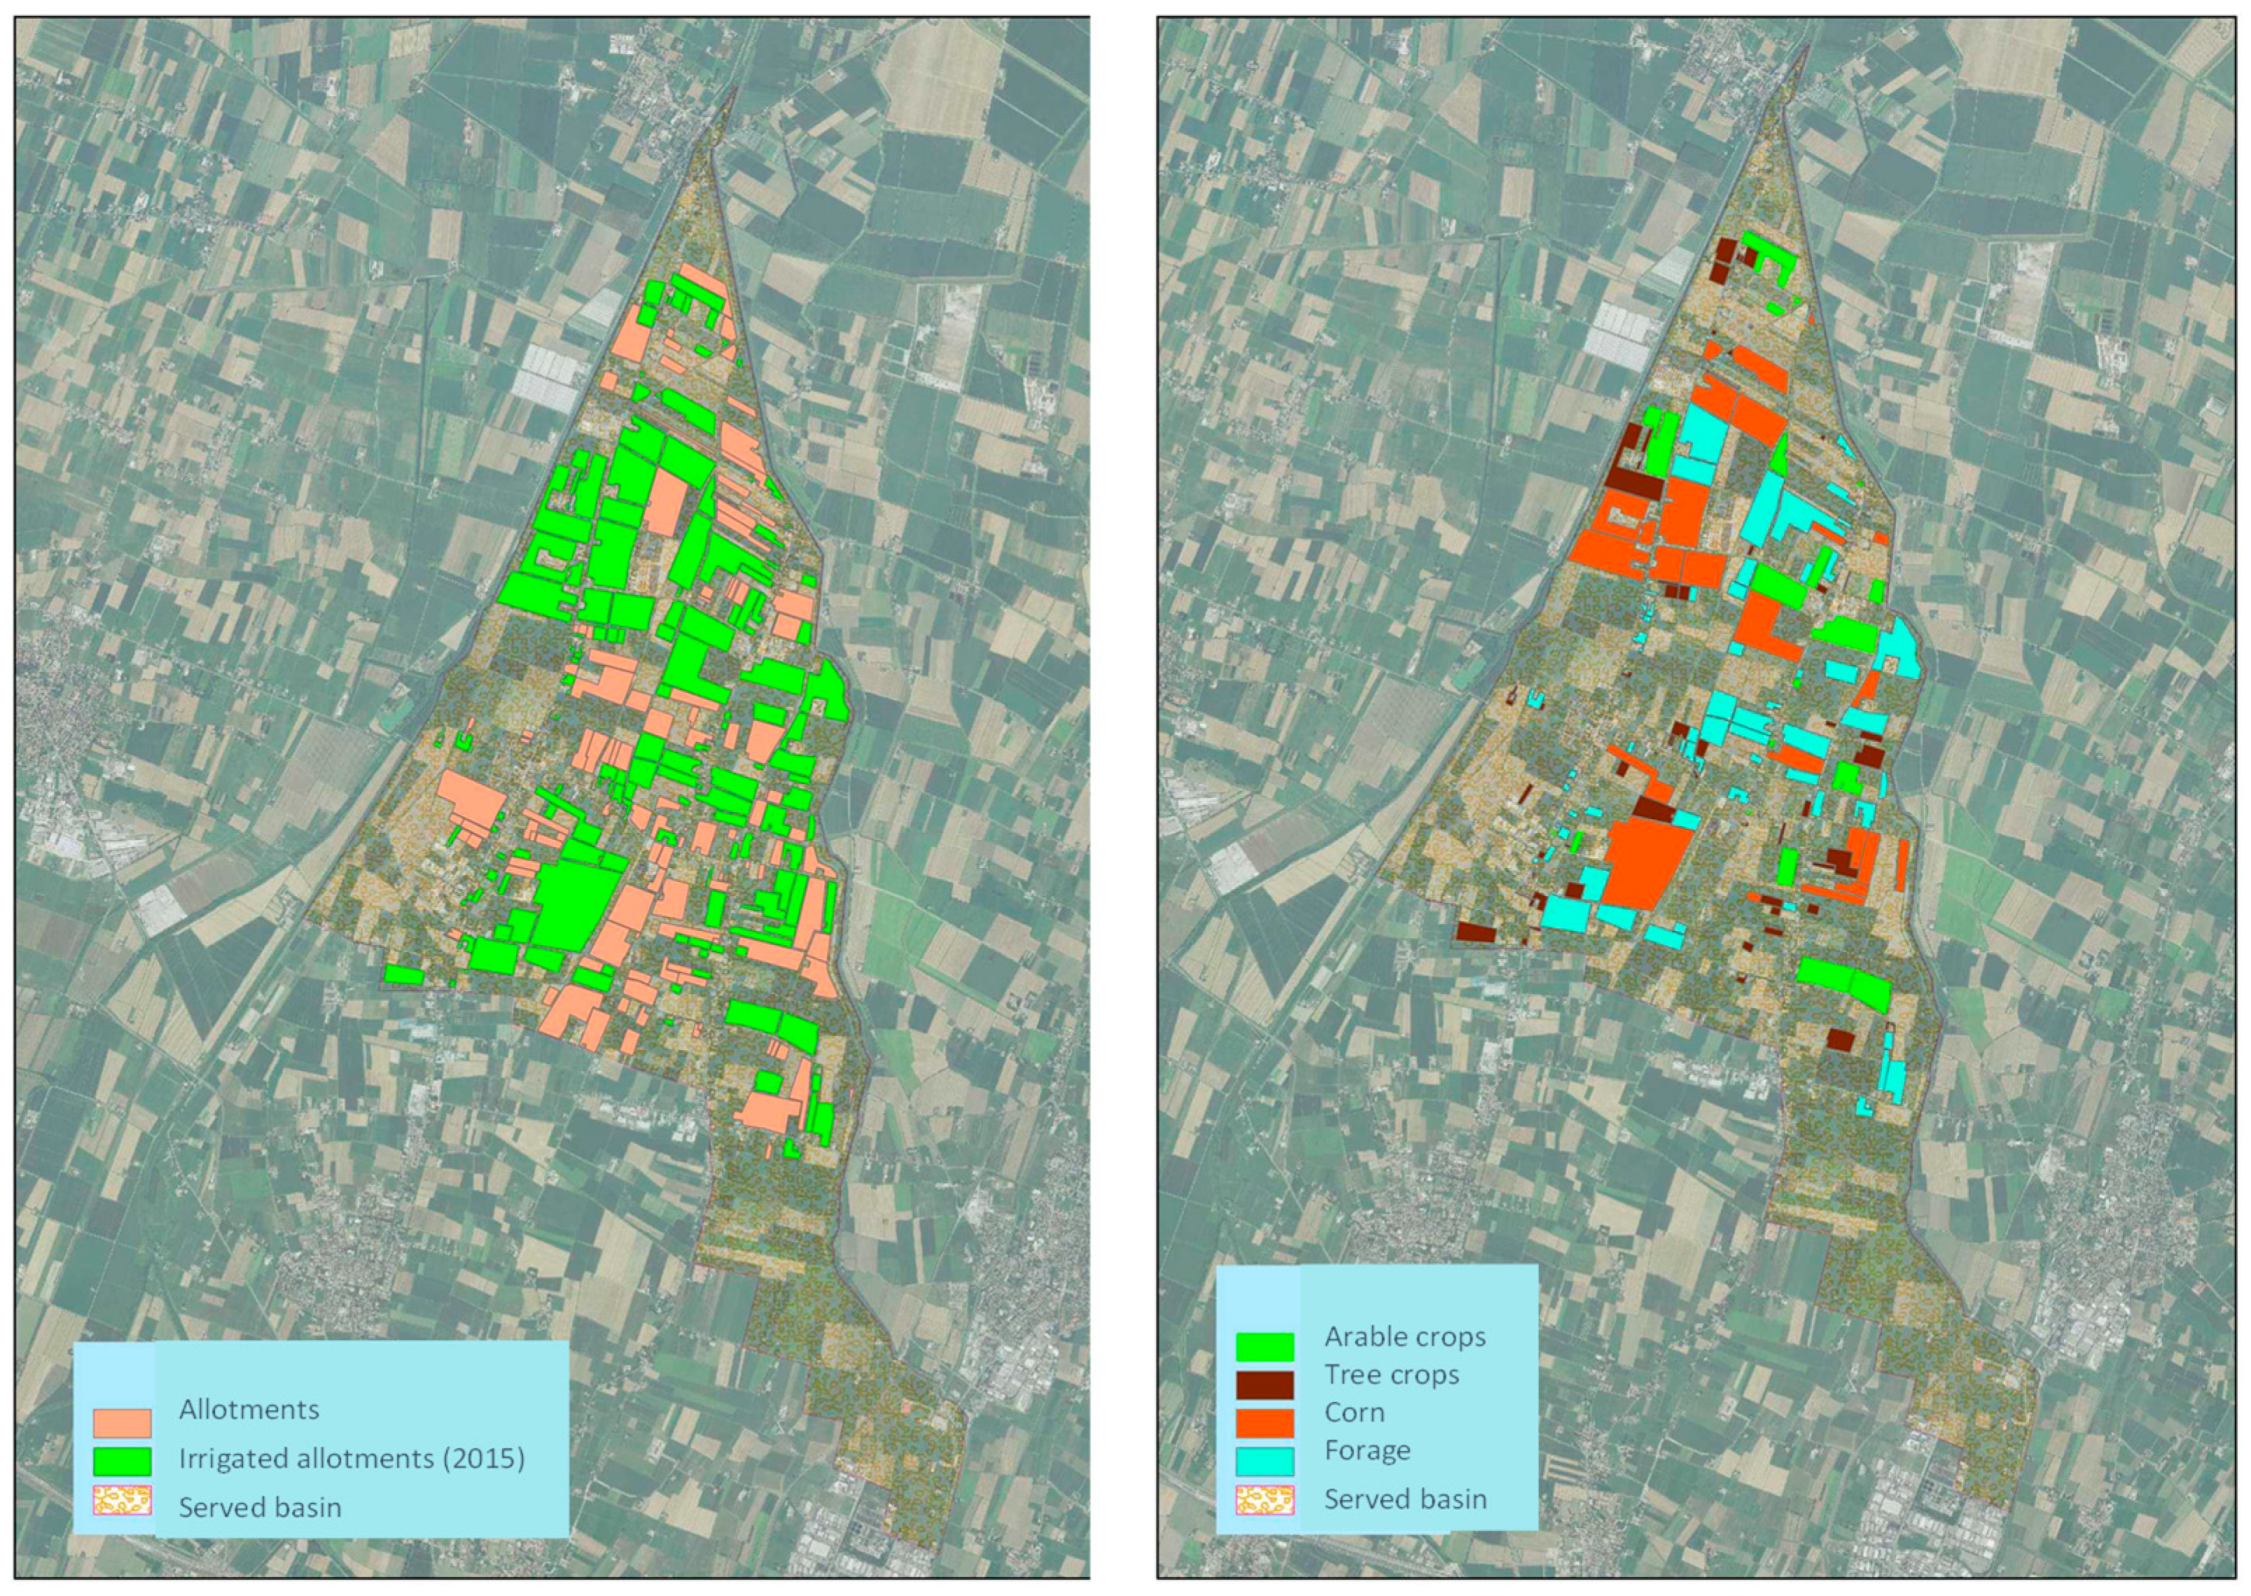
The case study concerns a sewage treatment plant located in Emilia-Romagna—an Italian region with a strong agricultural vocation—the water of which could be used by a well identified group of farms in adjacent areas. Primary data were collected using a structured questionnaire and elaborated by means of a classification tree analysis.
The contribution of the paper is mainly empirical as it provides new evidence on the topic. In this sense, it helps bridge the knowledge gap on what predicts acceptance behaviour and allows water planners and utilities to address the actual concerns held by particular communities of farmers. To the best knowledge of the authors, this is also the first time the classification tree approach has been tested in this field of research. The results make a contribution to the literature on the social and attitudinal dimensions of recycled water management and also add, more broadly, to the study of environmental management.
After describing the study area (Section 2.1) and providing insights on major contributions from the literature on public acceptance of wastewater technology and use of reclaimed water (Section 2.2), the method is described (Section 2.3). The results are presented in Section 3. Section 4 discusses results, while Section 5 provides a conclusion.

2. Materials and Methods

2.1. Study Area and Wastewater Treatment Technology

The Emilia-Romagna region is located to a large extent within the Po river basin, where water use has been causing severe imbalances in both groundwater and surface water bodies as well as hydro-morphological alterations [27]. In the Italian province of Reggio Emilia, a wastewater treatment plant (WWTP) for municipal wastewater was enhanced with the realisation of a tertiary treatment section designed in 2014, to the aim of achieving wastewater characteristics suitable for water reuse in agriculture, in line with the limiting conditions set by Italian legislation [27].
By comparing the outcomes of costs and process flexibility derived from testing different purification technologies in the context of the ReQPro Life Project (Information available on the ReQPro website. 11 December 2018 (Archived by WebCite® at http://www.webcitation.org/74a3KLORG)), the rapid sand filtration + H2O2/UV (chemical oxidation with hydrogen peroxide and UV radiation) combined treatment was chosen as the best combination for water purification and disinfection. The current plant facility (280,000 population equivalent) has a treated load of 50,216 m3/d and serves an irrigated area of 7030 ha, which includes the irrigated basin representing the study area of this paper, which accounts for 2100 ha of land (Figure 1).
The area is mainly characterised by cattle and pig farms. It follows that the prevailing irrigation crops are grain maize (30% of the irrigated surface), fodder, including stable meadow and alfalfa (representing about 40% of the irrigated Utilized Agricultural Area, UAA), and vineyards (about 15% of the irrigated UAA), while other crops include orchards, tomatoes, and other vegetables (for the remaining 15% of the surface). Non-irrigated land is dedicated to the production of fall grain cereals (common wheat, barley), which are sold to flour-milling companies. Grain maize is addressed for the production of feed flour, mainly for pigs, whereas fodder is used locally in dairy cattle farms.

2.2. Farmers’ Acceptance of Wastewater Technology and Reclaimed Water: a Brief Review

Conflicting views surround the discourse on the use of wastewater in agriculture. While its usage promotes resource efficiency in regions facing climate change, concerns with respect to health, environmental, and other risks persist [28].
How individuals respond to innovative technologies may depend on a collection of internal (socio-demographic characteristics and attitudes) and external factors (e.g., market and policy aspects) along with the informational and cost barriers they face. Specifically, in the context of public acceptance of wastewater technology and reclaimed water, market prices and distortions, existing policies, water availability and safety [29], and the quality of currently used water have been found to affect acceptance [25,30,31,32]. Concerns regarding the environment and health, as well as certification and monitoring, also appear to be responsible for reducing public acceptance [23,30,31]. Apart from more objective or external factors, socio-demographic and cultural characteristics have also been found to drive the acceptance and adoption of technology [33,34,35,36]. Interesting insights have been provided evaluating the willingness to use (WTU) or willingness to pay (WTP) for reclaimed water, from which it results that past experience [23], the perception of bad quality water [37,38], greater income disposal, and being female, represent relevant factors in increasing WTP and WTU [39,40,41].
Higher education levels have been found to positively affect public acceptance [42], while the age variable has shown mixed results: some authors report that older people show higher acceptance [23,43], whilst others state the opposite [44,45].
Additionally, a strong body of research has underlined the centrality of social factors, such as trust and social ties, in water management [46] with implications on public acceptance, and have clearly identified a relationship between beliefs (e.g., risk perception) and acceptance [33,34,35,36]. Beliefs, which have been claimed to explain behavioural intentions by the theory of planned behaviour [47], can help predict behaviour [48]. Similarly, research in psychometrics has proven that intuition and emotions created in response to distrust and fears from uncertainty [49] greatly affect risk perception, which has always been considered a major determinant of public opposition to technology and the most dominant social factor affecting water acceptance [34]. Moreover, information and knowledge are directly linked to risk perception: the fear of the unknown and “irrational” emotions, constituted “major reasons for the failure of past schemes to gain public acceptance” [21]. Conversely, perceiving higher information and knowledge disposal connects with higher acceptance levels [24,32,50]. On the other hand, risk appears more acceptable when advantages are better understood [26], which generates a negative correlation among perceptions of risk and benefit when assessing technology acceptance. As a result, the greater people perceived a benefit, the greater the tolerance for a risk [51,52].
Starting from these insights from the literature, we focus on micro-level information on socio-demographic aspects to investigate farmers’ beliefs about accepting the new water scheme and the use of recycled wastewater for crop irrigation. To account for the existence of a negative correlation between perception of risk and benefits, in addition to analysing negative thoughts and feelings concerning perceived risk, a positive attitude dimension is accounted for by looking at perceived benefits/advantages.

2.3. Study Design, Data Collection, and Data Elaboration Technique

To assess farmers’ perceptions of risk and benefits, we have collected primary data surveying farmers in the study area. The survey was designed to take into account the set of variables that the literature classifies as potential drivers for behaviour, as reported in Section 2.2. This list was adapted for the specific scope of our analysis and context of the study.
The questionnaire (Supplementary Materials S1) is composed of three sections. In the first section, basic information on the characteristics of the farmers and farms are asked for, including farm location, main crops, age and level of education, water quality and availability problems. In the second section, questions address farmers’ awareness about the existence of: (1) the wastewater treatment plant; and (2) the project of reusing urban wastewater for irrigation purposes. Furthermore, their perceptions about the risks and benefits associated with wastewater use are elicited, especially in relation to conceptions of knowledge. In the final section, farmers are asked whether they have enough information to use treated wastewater and if current irrigation facilities would need adaptation to use wastewater. Finally, the questionnaire investigates farmers’ perceptions of local farms’ acceptance of the innovation.
From the entire farm population in the area of study (103 farms), we selected those that had relied on irrigation in recent years (57 farms), which represented the whole population potentially making use of wastewater in the area. Farmers were contacted in the spring of 2016 (March to April): a total of 54 replied positively to the interview, i.e., representing 95% of the population of farmers irrigating land, and roughly the same share of the UAA served by reclaimed water.
Information about all variables, their characteristics, and descriptive statistics is given in Appendix A, Table A1, Table A2, Table A3 and Table A4. Data were analysed using descriptive statistics and a non-parametric approach based on classification tree analysis. This approach seeks to explain the relationships between the response of a target variable and a set of predictor or explanatory variables by using recursive decision rules to partition the data. The algorithm results are represented graphically as a “tree” starting from a “root node” and moving from progressive splits into smaller and smaller “branches”, called “child nodes”. The splits are obtained using the Chi-squared Automatic Interaction Detector (CHAID) technique—implemented by SPSS® (Statistical Package for Social Science, version 25) Modeler—that performs a Pearson χ2 (Chi-square) test to assess all possible cross tabulations for each predictor and selects the most statistically significant one to split the sample in smaller groups [53,54]. The splitting process continues recursively for each child node and stops when no more statistically significant explanatory variables are in place. The predictor/explanatory variables appear in the splitting nodes in a hierarchy of decreasing explanatory power [55]. Compared to alternative parametric methods (e.g., multivariate logistic regression), the CHAID shows a number of advantages [56], notably avoiding the need to make assumptions on functional forms of predictor/explanatory and response variables, and not being sensitive to the presence of outliers, heteroskedasticity, collinearity, or problems in the structure of error distribution. The fact that a functional form is not assumed also allows for the use of this technique in those situations characterised by low data availability. The CHAID technique is of great use in our case, which is characterised by unobserved factors explaining target variables, a nominal target or response variable, and a heterogeneous set of explanatory variables (dummies, categorical, and quantitative variables measured with different units or following different functional forms).
The few existing applications in the agriculture sector [57] tend to answer physical or biological research questions. For example, Zeng et al. [58] explored sources of soybean yield variability in 2007 for China associated with severe drought; furthermore, Waheed et al. [59], Shepherd and Walsh [57], and Tittonell [60] used classification and regression trees to derive better soil and crop management information. At least one paper provided an explorative use of these techniques in agricultural economics, specifically applied to understanding reactions to policy changes [61].
In the context of this work, the CHAID analysis allows the investigation of the relations between the level of social acceptability, the perception of risks and advantages (our two response variables which are categorical), and structural and personal characteristics of farmers, as well as farmers’ beliefs (explanatory variables having different unit of measures). The specification of the dependent variables is reported in Table 2, while factors proving to be statistically significant from the CHAID analysis can be found in Table 3. Appendix B presents classification tables illustrating classification scores for each tree.

3. Results

3.1. Major Sample Characteristics

The socio-demographic characteristics of our sample well represent those portrayed in the regional and provincial statistics offered by the 6th Italian Agriculture Census (ISTAT, 2013) (6th General Census on Agriculture. Italian Atlas of Agriculture; accessible at: https://www.istat.it/it/files/2014/03/Atlante-dellagricoltura-italiana.-6%C2%B0-Censimento-generale-dellagricoltura.pdf). In the Emilia-Romagna region, the percentage of farmers older than 75 years is 20.2%, while in the province of Reggio Emilia, where the tertiary treatment was developed, the figure is 23.8%, versus 24% of our sample. Young farmers (i.e., under 40 years old) represent around 11% of the population, both in our sample and in official statistics at the provincial level.
According to the descriptive statistics of the variables presented in Appendix A, around 17% of respondents have only attended primary school (five schooling years) and the same percentage is older than 65 years. A lower secondary education (eight schooling years) was achieved by 37% of respondents, while 43% completed the upper levels of secondary school (13 schooling years); only 4% achieved a bachelors degree (18 schooling years). As expected, a negative correlation applies between the level of education and age: ρ: −0.34; p-value: 0.0110. (The correlation amongst variables was derived using STATA® (StataCorp., version 14). The statistic calculated is the Pearson coefficient (denoted as ρ) with associated p-values (0.05 significance level), which is a measure of the strength and direction of association existing between two variables.) The UAA amounts to about six hectares per farm; almost 80% of the sample has a farm size lower than eight hectares, while only 4% of the farms exceed 20 hectares. A greater land extension positively correlates with a more diverse crop allotment (ρ: 0.40; p-value: 0.0023). Larger farms are managed by younger farmers (six of which were aged between 35 and 44 years), while elderly farmers (aged between 75 and 84) tend to run smaller farms. The majority of farmers grow a single crop, while the rest show somewhat more diversity, with two (22%) or three crops (6%). The most widely cultivated crops are, in order: grapes, alfalfa, forage, grass, and maize. A total of 74% of respondents, mainly young farmers, intend to continue farming over the next 10 years, and 91% show no intention to carry out a change in crop mix.
Perceptions of water quality are elicited by asking a qualitative judgement of farmers, who could select one of the following responses: (1) very bad; (2) poor; (3) sufficient; (4) good; or (5) do not know. In analysing the results of this qualitative categorical variable, we observe that water quality in the area is perceived as good by 57% of the sample, while 43% of the farmers declare it to be of poor/very bad quality. Water availability conditions in the next 10 years are assumed to remain unchanged by 32 farmers (59%), while 11 (20%) believe that problems will increase in intensity and frequency and 10 (19%) do not know (Table 1).
Over 60% of the sample claimed to have a good level of information about the project, although a significant portion of the total sample (37%) were unable to provide an answer. This is despite the fact that 50% of them were unaware both of the existence of the WWTP and of the project of wastewater reuse for agriculture irrigation. In general, a higher level of education corresponds to a perception of information scarcity.

3.2. Results of the CHAID Analysis

To align with findings from the literature, four trees were computed to consider both positive and negative attitudes towards recognising risks and benefits. As a result, we have four dependent or response variables, as described in Table 2.

3.2.1. Risk Perceptions about the WWTP

In the first part of the CHAID analysis, aimed at understanding the perception of risk, the two response variables used were d19_yesrisk (in the first tree) and d19_norisk (in the second tree). The first is a binary variable that takes a value of 1 if the farmer believes that wastewater treatment may imply risk, while the second takes a value of 1 if no risks are envisaged. The use of both variables in our analysis is motivated by the need to understand both positions and by the evidence of the empirical finding showing that explanatory variables are different in the two cases.
In general, believing that risks may exist, which is the case for a relatively small share of respondents, can be explained mainly through a set of opinion variables on the environmental characteristics of water resources and farmers’ education (Figure 2).
More in detail, when considering the response variable expressing risk acknowledgement, the factor that best classifies the first node is that of the opinion on the quality of treated wastewater (d17_potential_waterquality). This variable distinguishes a group (of only four farmers), of which 50% believe that the wastewater treatment process entails impacts on water bodies, from a bigger group (of 50 farmers) that envisions no effects. More than 90% of the latter group considers that the reuse of wastewater in agriculture does not imply any risk. The first and smaller group (four farmers) is further split into two terminal nodes depending on the achievement of the lower secondary school diploma, as the highest educational qualification obtained (d3_lsdiploma). This split highlights a relation between education and farmers’ perceptions, despite the fact that the group is rather small. The second group, showing a lower risk perception, is further divided in subgroups. At first, depending on belief regarding future water availability (those considering that conditions will remain unchanged supports the presence of risks; variable d13_invariate); then, it is separated according to the upper secondary school diploma (those who obtained a diploma believe there are more risks; variable d3_diploma), showing again that risk perception relates to a higher education level. The final partitioning variables refer to cropping choices (d4_grapes, d4_garden_park, d4_permanent_pasture), which, however, show lower explanatory power compared to the variables located in the upper nodes.
When looking at the attitude to recognise the absence of risks (i.e., using d19_norisk as a response variable), alfalfa cultivation (d4_alfaalfa) proves to be the major determinant (93% of producers do not perceive any risks). The following partitioning variable relates to information disposal (Figure 3). Farmers were asked whether they had enough information to use treated water for irrigation. Amongst those believing that information is sufficient (d21_insufficient_information), there is a higher share of farmers who perceive some risks. After node splitting the sample according to sufficiency of information, only one branch continues; this is further divided according to future expectations regarding negative impacts from the treatment on water quality (d17_impactyes) and the cultivation of grapes (d4_grapes).

3.2.2. Perception of Advantages from Wastewater Treatment

Almost half of the farmers believe that there are benefits from the use of purified water (Figure 4). This opinion is explained, in the first instance, according to whether respondents expect local companies to be favourable (or not) to the use of treated water for agricultural purposes (variable d23_acceptabilityes). A good degree of social acceptability identifies a group where a high share believes in the existence of benefits, while the opposite applies for those who do not expect a good degree of acceptance from local companies. The group in the lower percentage of farmers, that considers that advantages apply (Node 1), is further divided according to the need to adapt existing irrigation practices (to use wastewater) (variable d22_noadaptation). When farmers envisage no need for adjustment, more advantages for local farms are perceived. This group is further partitioned according to the knowledge of the wastewater reuse project (variable d18_knowledge_reuse_project), with the answer “yes” associated with the perception of further benefits. The latter group is additionally separated based on the lower secondary school diploma (variable d3_lsdiploma), confirming that lower education is associated with fewer perceived advantages. Moving from the top to the bottom of the tree, within the group of farmers not knowing of the project, factors generating further repartition are the percentage of water obtained by the consortium (d6_water_consortium), and the types of crops grown (d4_alfaalfa). By contrast, the group consisting of those who support the existence of advantages and local wastewater acceptability (Node 2), is further fractionated according to the whether they grow tomatoes and other horticultural crops (d4_tomato), with a much greater proportion of farmers seeing advantages among those who do not grow tomatoes. The latter are then divided according to the perception of the need to implement adaptation practices (d22_noadaptation): no need for adaptation is associated (not surprisingly) with the perception of greater benefits.
When looking at the propensity not to recognise advantages (response variable d20_noadvantages), the lower secondary school diploma (variable d3_lsdiploma) creates the strongest grouping: it divides the sample into one group having the highest, versus one showing the lowest, percentage of answers indicating “no advantages” (Figure 5). Perceiving advantages is also a function of beliefs on sufficiency of information: the first group is divided based on opinions on the adequacy of information at farmers’ disposal, and on the growing of soy. Most of the farmers who consider the information to be sufficient also recognise the existence of advantages. The second partition splits those who support that episodes of water scarcity will continue at the same intensity from those who think the opposite: the latter show a higher propensity to recognise advantages. Additionally, amongst the latter, further classification variables relate, once more, to the perceptions of water quality and to the awareness of the water reuse project.

4. Discussion

The overall results of this paper reveal the existence of a more pronounced perception of benefits rather than risks from wastewater reuse in agriculture among farmers in the case study area. In accordance with the literature [23], this leads to more positive perceptions on wastewater, favouring higher acceptance levels. From a different perspective, the results also seem to report that a greater openness towards recycled water is linked to a lower perception of risk [32,62], rather than the identification of benefits.
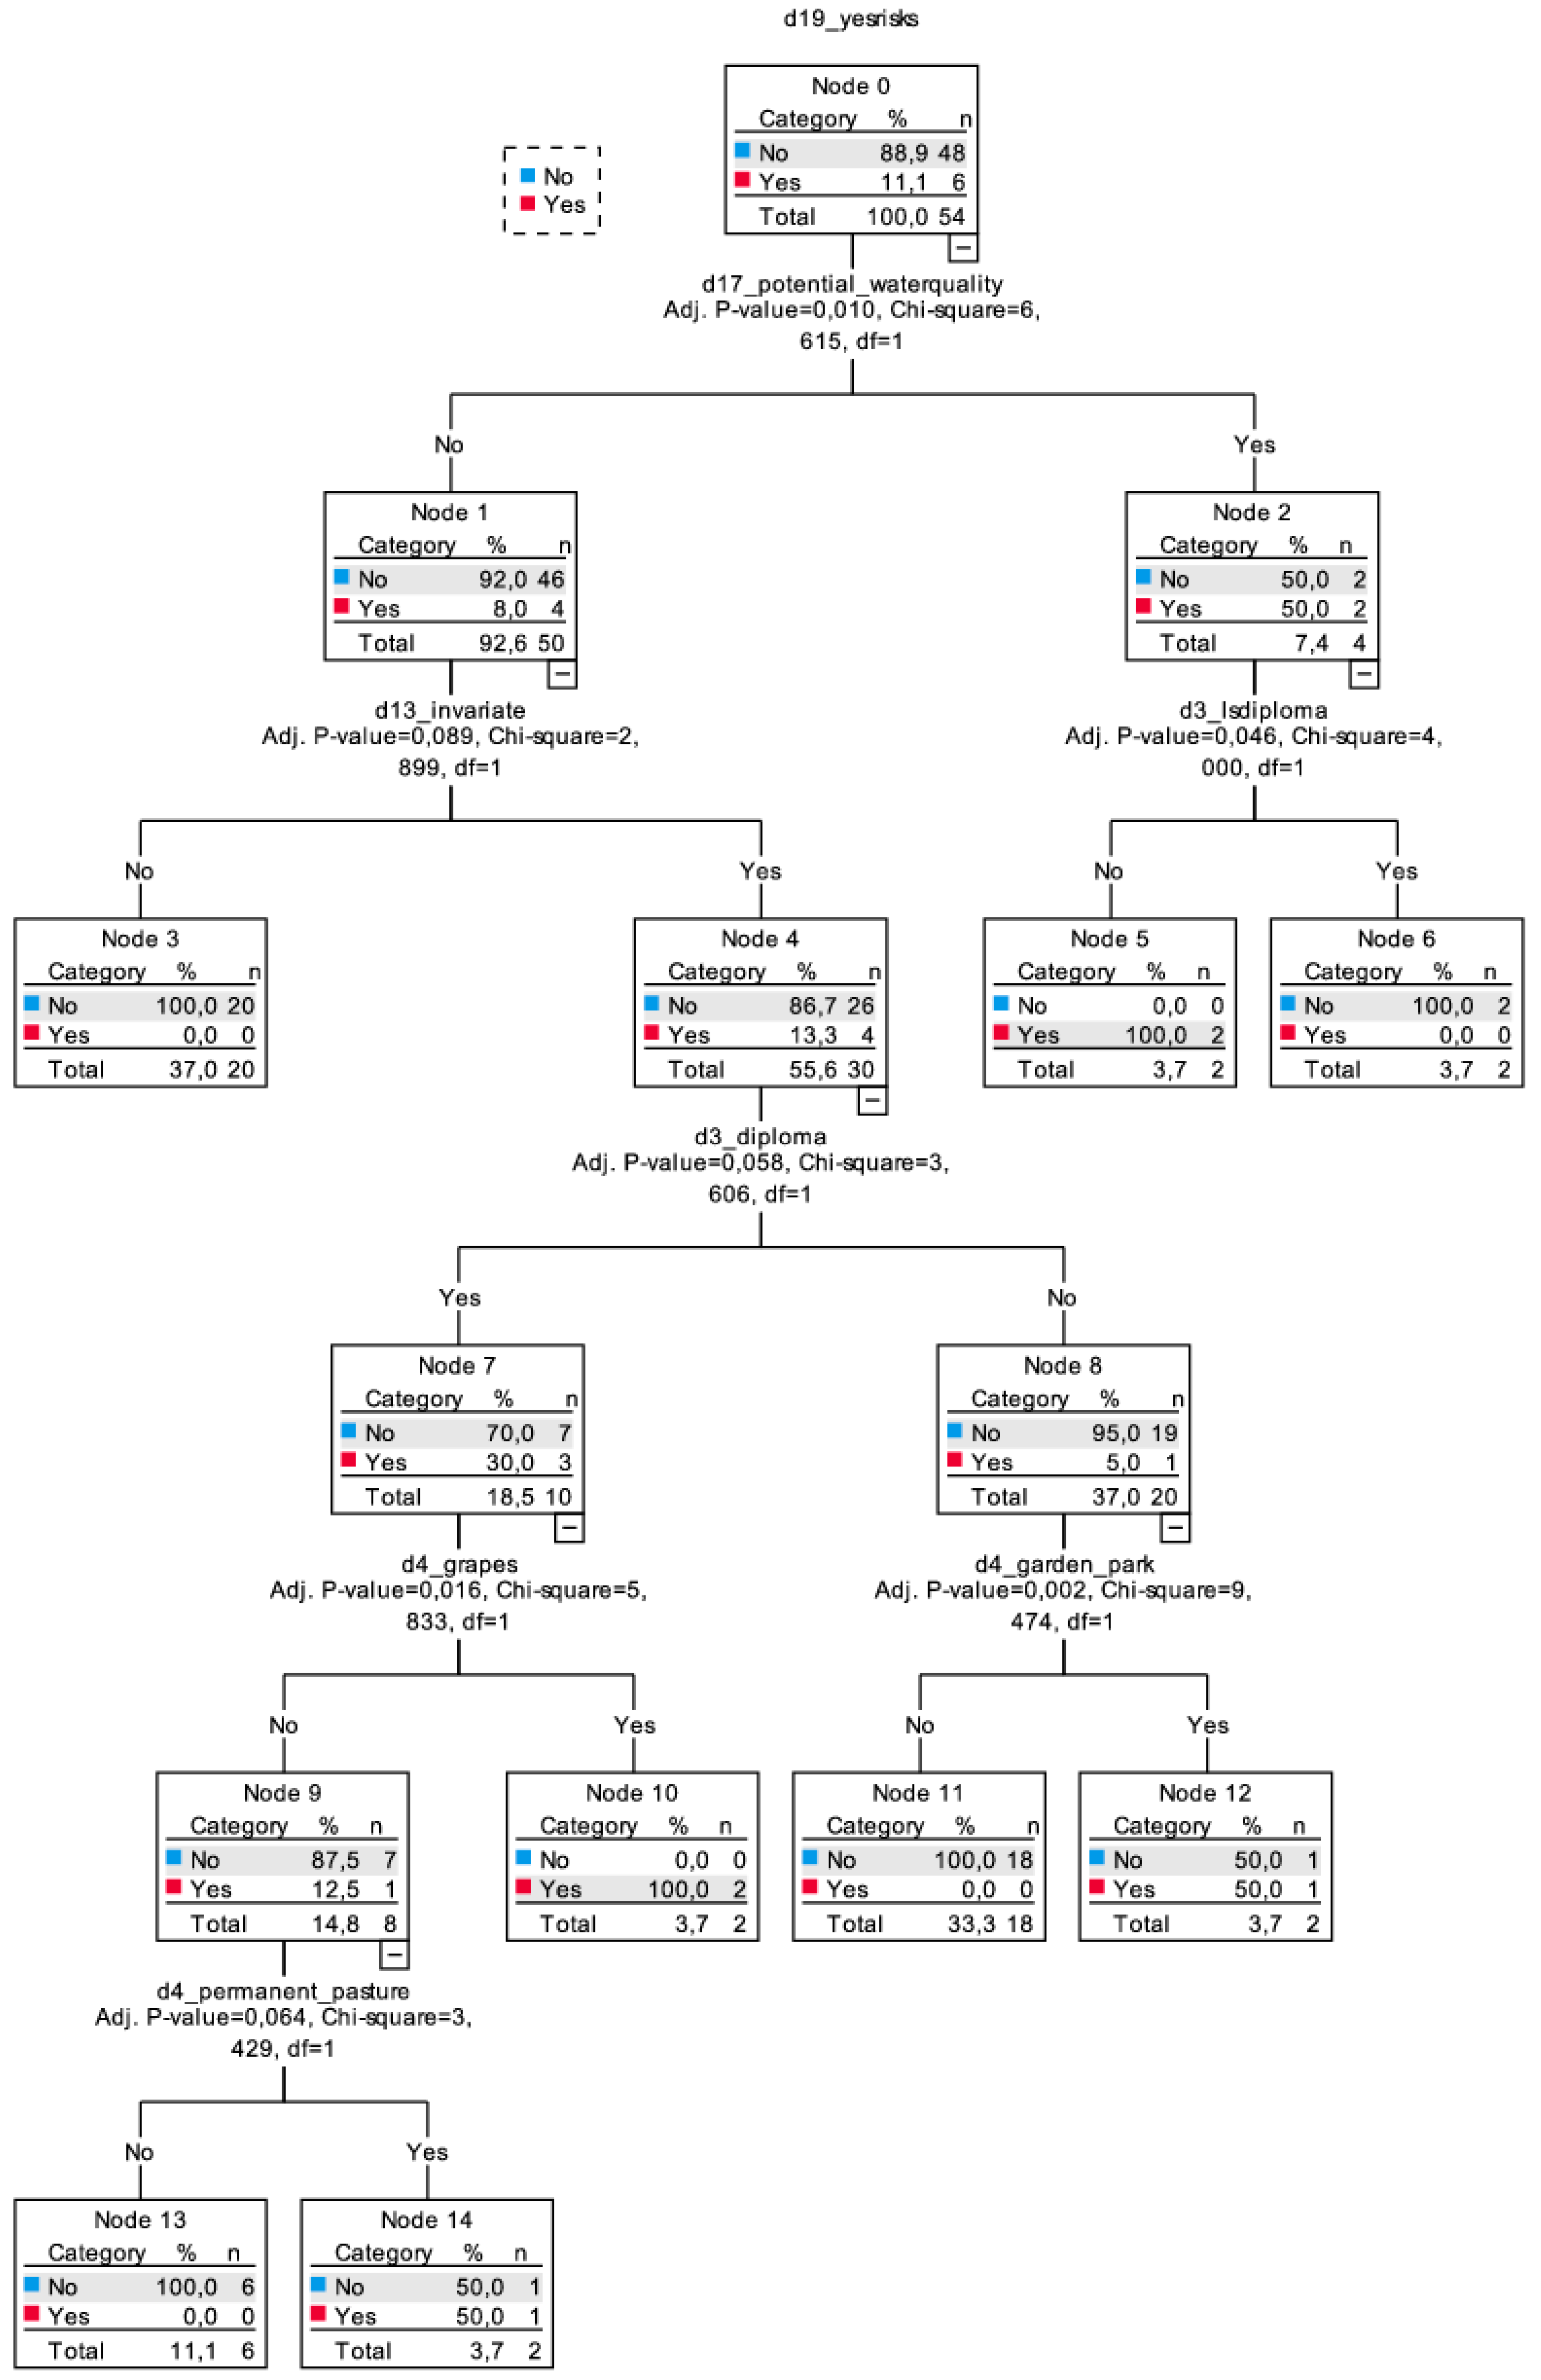
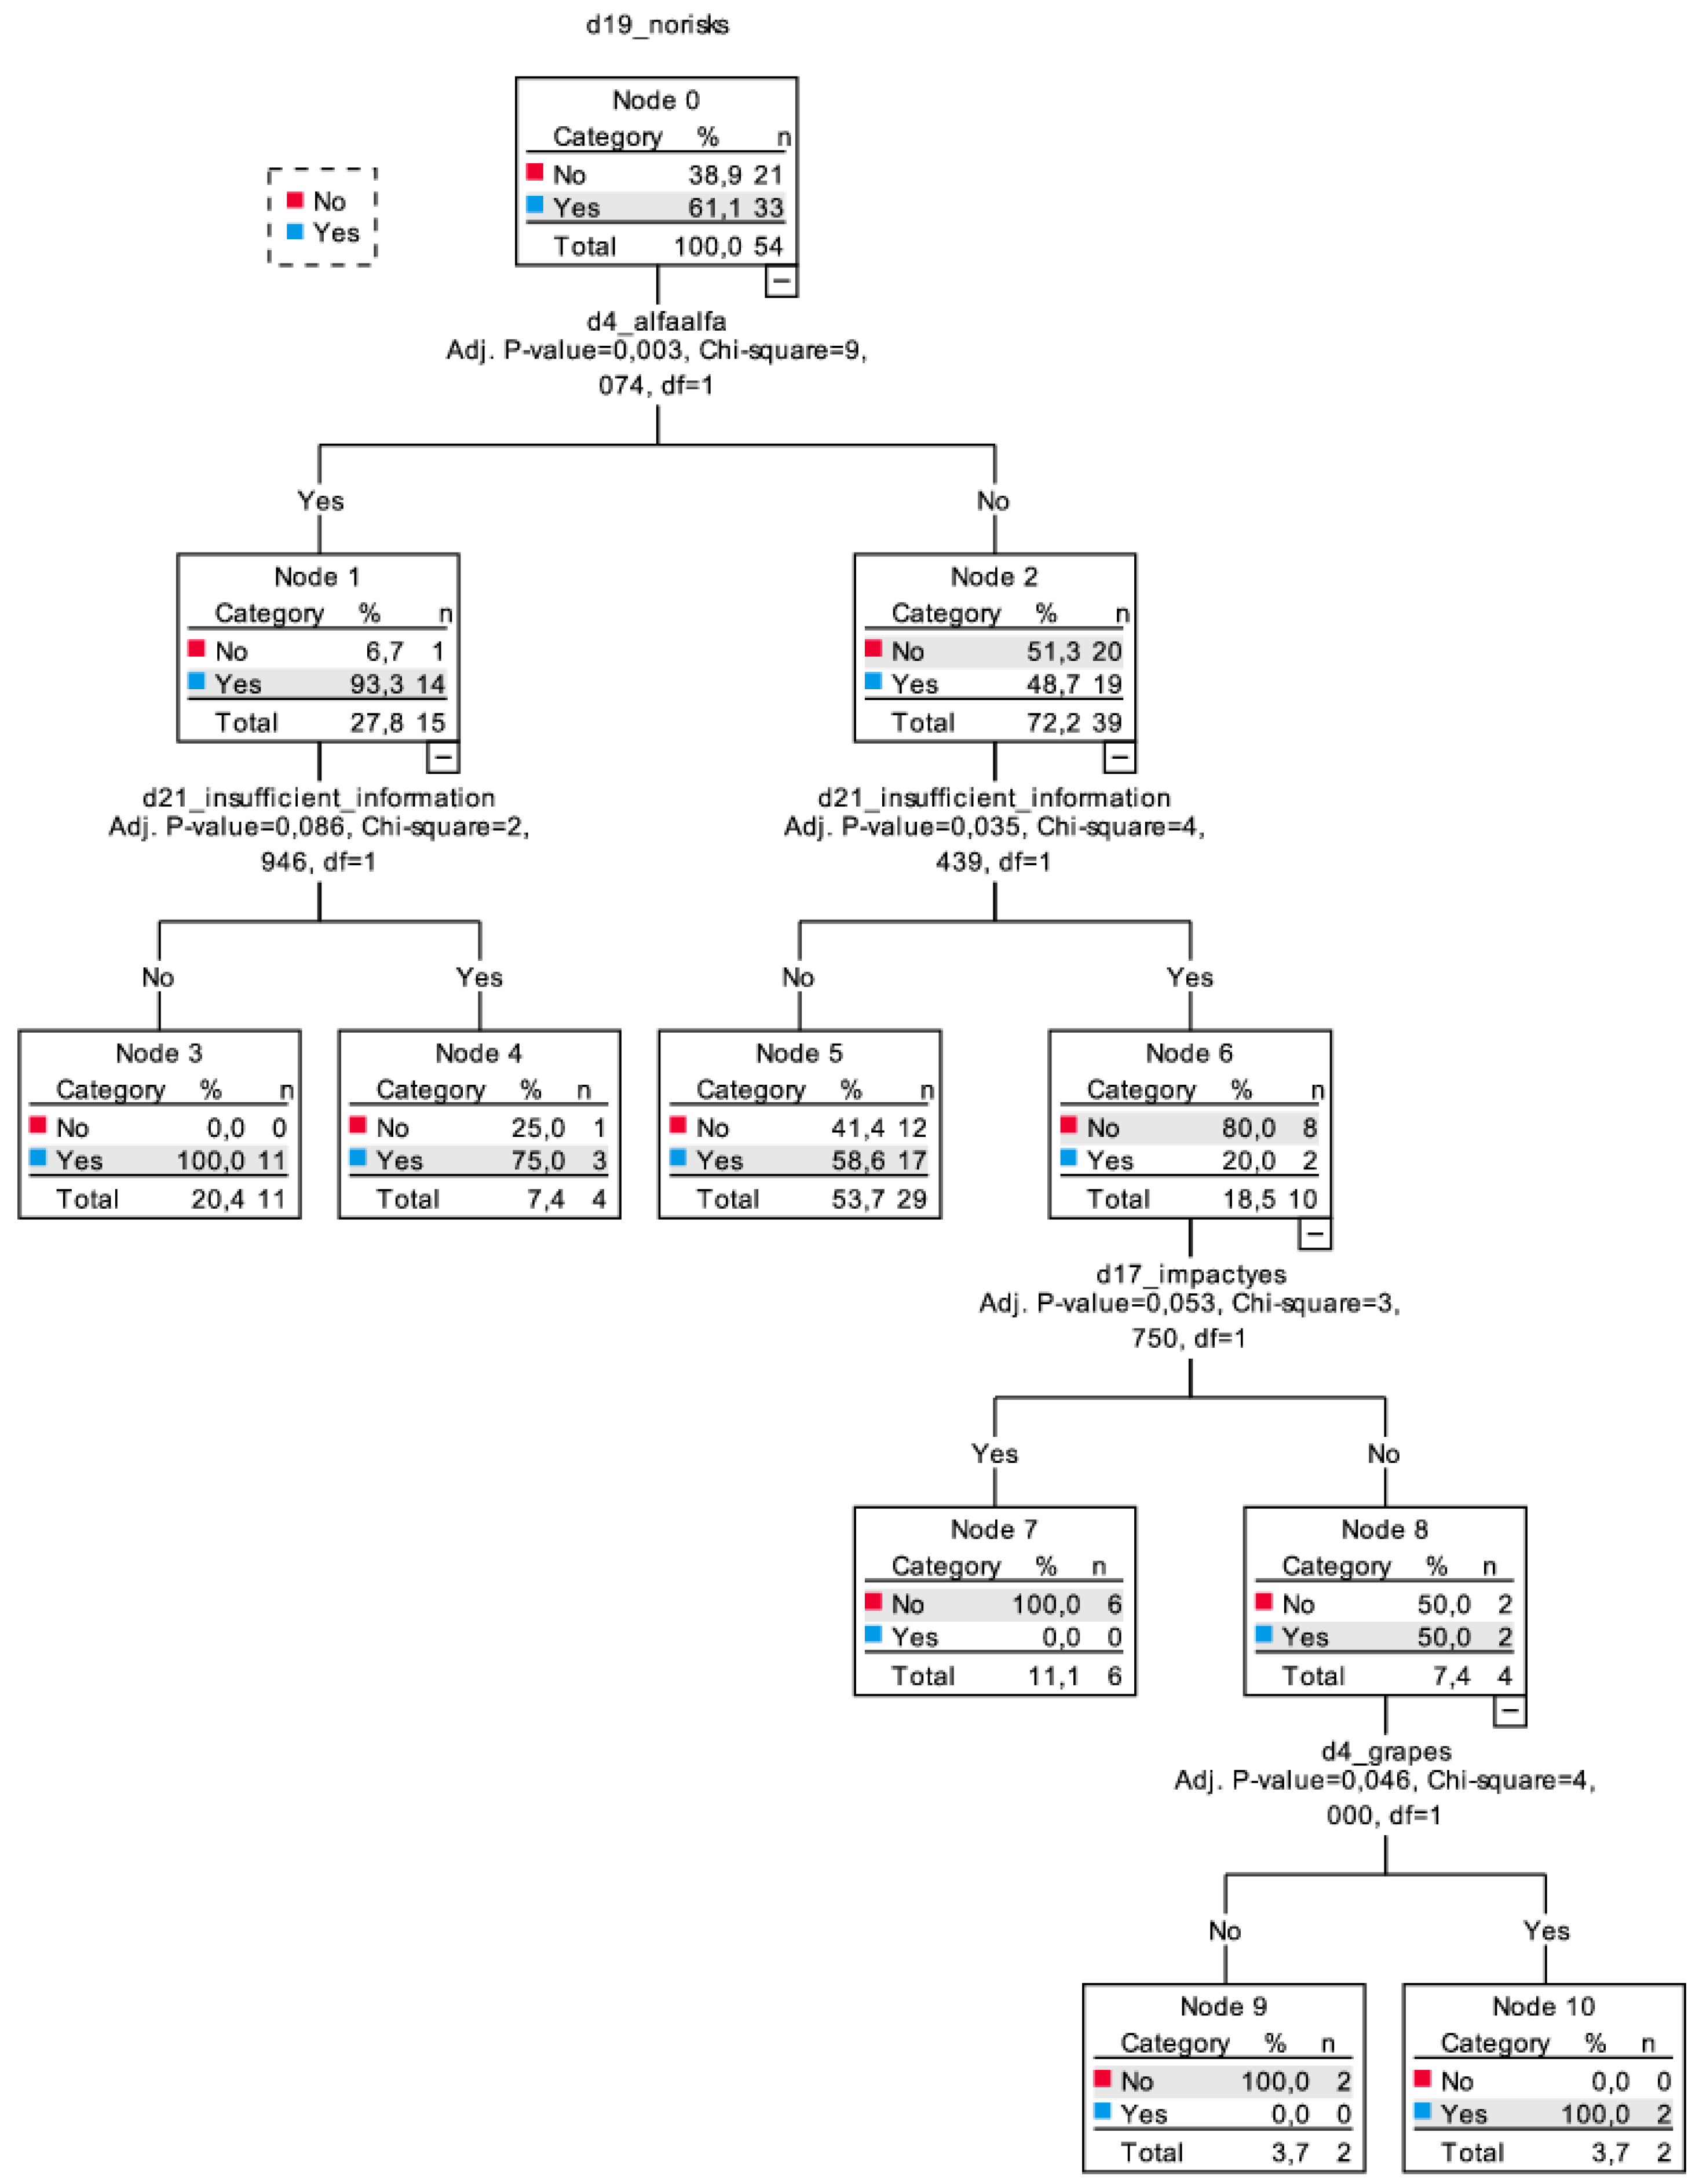
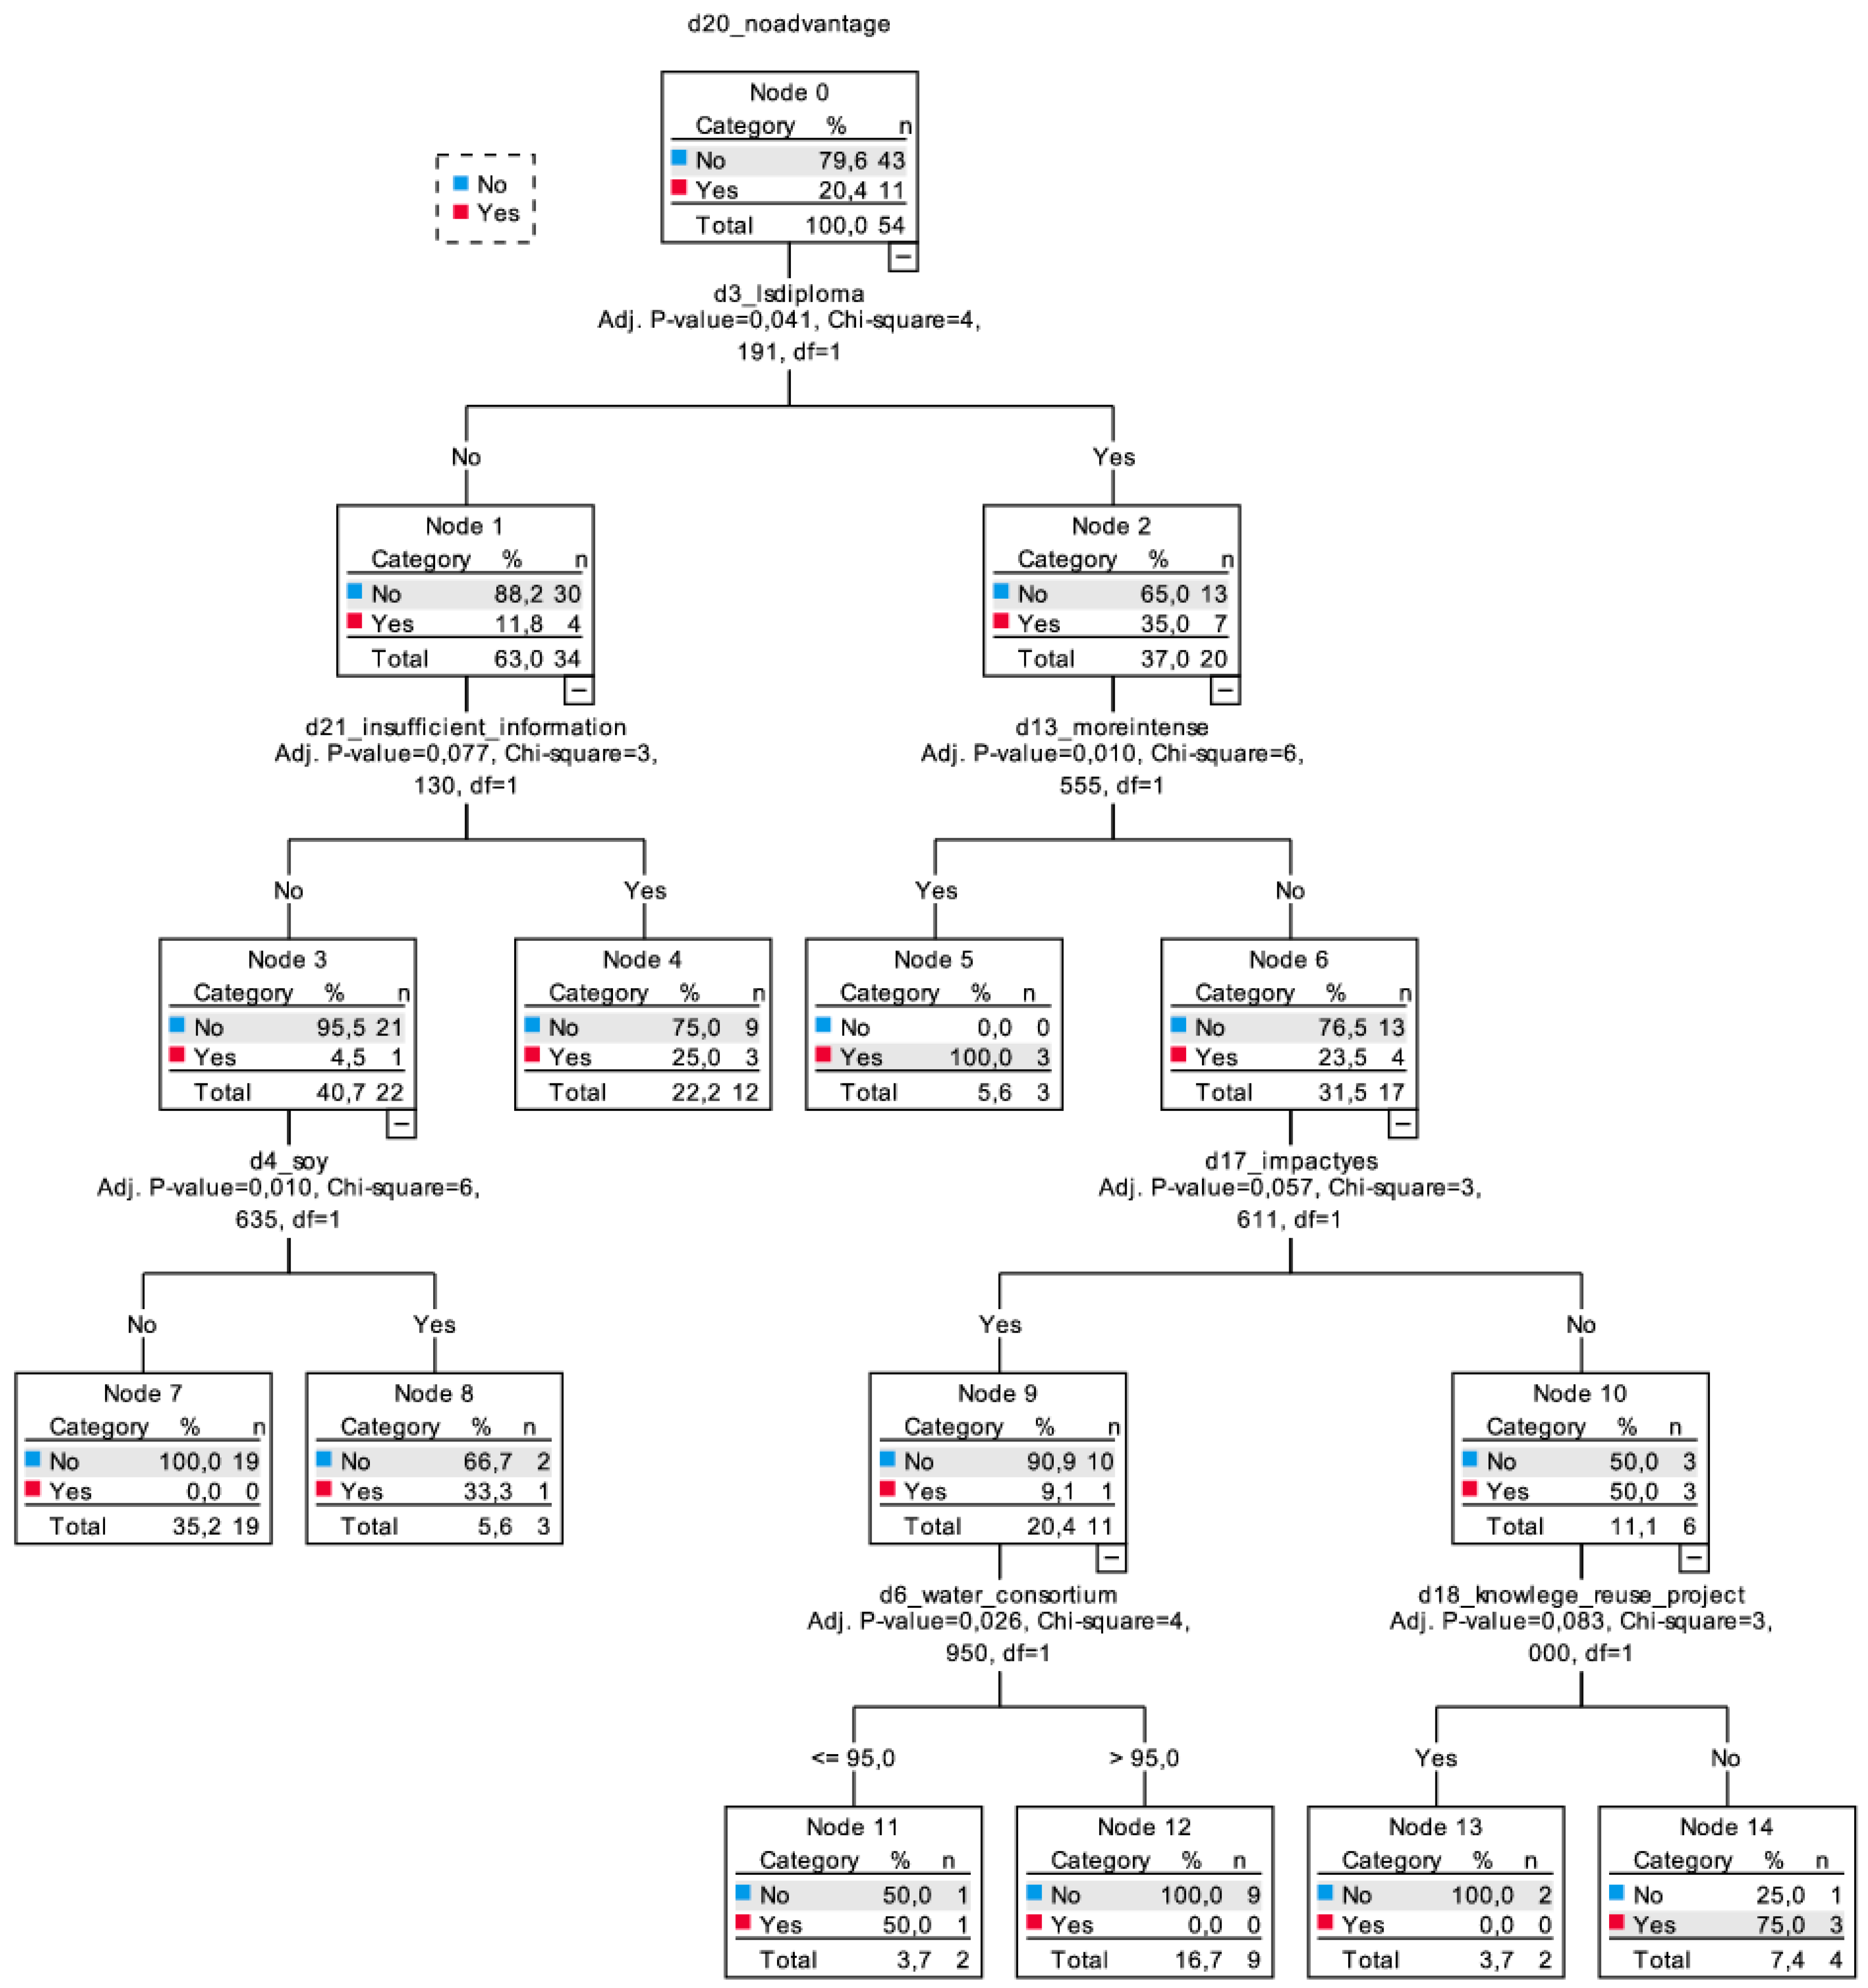
The CHAID analysis shows that different variables contribute to explain the different positions on risks and benefits. Table 3 summarizes the partitioning variables and output of the CHAID analysis: explanatory variables are depicted in rows and response variables in columns. Within the table, we report the hierarchic level of the splitting nodes resulting for each explanatory variable, for every tree. The higher the ranking (position identified by a lower number), the greater the explanatory power of one variable in explaining the response variable.
The results corroborate the primary relevance of the perceptions about water quality as a factor influencing the acceptance of recycled water [30,31,62,63]. However, this applies to the perception of risks only. The wastewater treatment can be seen as a technology that enhances the quality of water, compared to the status quo, despite the fact that, in our case, information about this topic seems to be positively related to higher perception of risks.
As for socio-demographic variables, we are in line with the stream of research reporting an inverse relationship between risk perception and levels of education [23,39,64]. We are also able to endorse the notion that higher information and knowledge (e.g., about the project) increase openness towards adopting the innovation, by increasing acceptance levels [32,50,65]. In the context of our study, this outcome can be related to both perceived greater benefits and perceived lower risk. A possible reason is that, even in the case in which knowledge does not emerge as a factor directly influencing people’s decisions, the provision and availability of information can be seen as an intervening factor engendering trust, which in turn contributes to acceptability [26,66].
Additional drivers explaining the recognition of advantages are cropping choices, neutral expectations on impacts, and low adaptation requirements of current water management practices. In particular, growing alfalfa is the stronger factor explaining the perception of no risk, which can be easily associated with the fact that this crop is not directly used for human consumption. Growers of processed tomatoes have claimed to require water beyond the irrigation season. This could justify producers’ inclination towards the recognition of advantages from the use of a complementary water source, which would fill this gap. On the other hand, in the case of land allocated to grapes, gardens/parks, and permanent pasture, the lack of recognition of specific advantages may be connected to both the lower importance of irrigation for these crops and the lack of interaction between irrigation water and production aimed at human consumption. However, it must be noted that, except for alfalfa, cropping choices are captured by intermediate-to-final nodes of the classification trees, i.e., represent partitioning variables with lower explanatory power compared to other factors located in upper nodes.
Finally, greater advantages are perceived by those believing that local farms would accept the innovation, confirming Siegrist and Cvetkovich’s [26] assertion that people tend to conform with others’ behaviour. Therefore, the extent to which consequences are accepted may depend on the knowledge that others will eventually be subject to the same effects or that acceptance prevails among the local community.
This paper is subject to at least two limitations. The first concerns the size of the sample (though representative of almost the whole population of the case study) and the emphasis on a narrowly defined area. However, this latter limit could, at the same time, be seen as a strength of our work. Focusing on a well-identified case study, our approach and results are suitable to identify concrete reactions by actors, while taking real life decisions precisely on the use of water.
A second limitation could be the number and type of variables considered, in particular the fact that we decided to leave aside aspects such as wastewater regulation and economic aspects such as the redistribution of treatment costs and water price. The reason lies in that these aspects are traditionally considered more by the economic literature than in the context of social acceptance, accounting for more subjective and hard-to-track elements related to beliefs and perceptions [15]. On the other hand, water price for farmers in the area is almost negligible, so that relative changes in this variable are not expected to strongly drive farm choices.
Additionally, according to the current law, the burden of the investment cost for water reuse (tertiary treatment) is not charged to farmers; rather, it is paid by households. Therefore, the fact that farmers can currently benefit from a ‘free lunch’, besides contributing to explain their openness towards WWT technology, also made the question of costs rather irrelevant. Similarly, in the study area, water competition amongst different uses is limited. The freshwater used in urban centres is derived from the aquifer, while irrigation water comes from the Po River, which usually brings enough water, except in exceptionally dry years. As a result, farmers in the area are not vitally afraid of water scarcity conditions, even though climate change is hinting at the possibility that things will quickly worsen in the near future. This also hints at a rather low resource cost (in the meaning of WFD) of water. As a result of the above, it is reasonable that farmers neither have special economic motivations to be against water reuse, nor do they expect major economic benefits that would push them to be strongly in favour.
The picture would likely be different if the WWT technology was implemented in other parts of the region, where water scarcity is more relevant, or under future climate conditions, due to the expected increase in frequency and intensity of seasonal water shortages or droughts due to climate change. In these cases, a much higher marginal value for treated wastewater would make it more appealing to dispose of additional alternative sources, which may be expected to positively affect public acceptance [23] and justify greater investments in WWTP.

5. Conclusions

Using micro-level information, this study performed an evaluation of the perceptions about benefits and risks associated with treated wastewater reuse for irrigated agriculture, focusing attention on opinion variables and beliefs, as well as farmer and farm characteristics, as potential factors explaining farmers’ opinions.
The results show that drivers of risk/benefit perception are linked, amongst other aspects, with information-related variables (level of knowledge about the water reuse scheme and information available to users). Our results also show the relationship between technical aspects and farmers’ opinions: the type of crops cultivated and the burden to adapt current technologies to use treated wastewater are found to be related to perceptions, though the full understanding of the related causal mechanisms is beyond the scope of this paper.
In terms of policy implications, this confirms the importance of raising stakeholders’ awareness and encouraging their involvement to leverage public acceptance to foster technology diffusion. However, raising the public’s knowledge of water reuse alone could prove to be insufficient to ensure acceptance. Policy measures aimed at informing local actors should look more carefully at local water needs by potential users, build on personal experiences, and address business-specific water-related concerns. This should build on a more thorough assessment of how farms and crops can benefit the most from water reuse. The specific case of farm specialised in feed crops or needing water outside the season in which irrigation water is normally delivered can represent an important basis to build consensus about water reuse. It should also be acknowledged that, in some cases, firms may have good reasons for having no special preferences. In such cases, information about others’ views may in fact affect individual opinion. Transparency in information may be relevant in particular in cases in which doubts can be raised with respect to technical aspects of reusing purified wastewater. Also, an appropriate approach may potentially help increasing trust over time and reduce people’s concerns about risk, while simultaneously acknowledging better potential benefits.
This mix of approaches, focusing the needs of potential users, needs to be contextualised in a shared vision of global and long-term challenges associated with water scarcity, in particular facing climate change.
In the context of Integrated Water Management, these results may inform the decision making process on how to better target efforts to increase acceptance levels. This in turn may support the implementation of the EU 60/2000 Water Framework Directive and favour the competitiveness of the local water industry.
Further research through micro-level investigations should be carried out to more systematically map target variables affecting public acceptance across Europe. This would allow for the development of a knowledge base for the water reuse sector in Europe, especially in more water-scarce regions where the value added of this option is higher. Finally, these insights integrate and do not substitute incentive considerations related to prices, policies, and costs. These remain key drivers, especially in a business environment. The interplay between value proposition, the social dimension of acceptability, profitability, and the role of regulation will be a strategic topic for further research.

Supplementary Materials

The following supplementary material is available online at https://www.mdpi.com/2073-4441/11/1/108/s1: Questionnaire Design S1: Farmers’ survey: A model to Reclaim and reuse wastewater for Quality crop production.

Author Contributions

This paper constitutes the collective effort of the four authors. E.G. designed and tested the survey structure and organised the references; M.M. structured the database, analysed the data, and produced results for descriptive statistics; M.R. conceived the methodology producing results with the CHAID algorithm; D.V. and M.M. described and interpreted the CHAID results; M.M. wrote the paper with the support of D.V. All authors have read and approved the final manuscript.

Funding

This research was funded by the European Commission, LIFE11 ENV/IT/000156. ReQpro—A model to reclaim and reuse wastewater for quality crop production.

Conflicts of Interest

The authors declare no conflict of interest.

Appendix A. Variables and Main Statistics

Table A1. Variables and main statistics: Farmer and farm characteristics.
VariableDescriptionRange of ValuesObsMeanSDMinMax
MultiplecroppingNumber of planted cropsCategorical: 1–3 crops54 13
UAA_mais (ha)Utilized agricultural area UAA (ha)Continuous variable86.8637.0780.720
UAA_alfaalfa (ha)UAA devoted to alfalfa and other forage crops (ha)Continuous variable157.679.099130
UAA_soy (ha)UAA devoted to soybean and other protein crops (ha)Continuous variable37.26711.0440.320
UAA_grapes (ha)UAA devoted to grapes (ha)Continuous variable161.3990.9490.055
UAA_wheat (ha)UAA devoted to durum and soft wheat (ha)Continuous variable41.6681.7260.054
UAA_garden_park (ha)UAA devoted to gardening and park (ha)Continuous variable40.1950.0950.10.3
UAA_permanent_pasture (ha)UAA devoted to permanent grassland (ha)Continuous variable102.443.8180.213
UAA_beet (ha)UAA devoted to beet (ha)Continuous variable116 1616
UAA_tomato (ha)UAA devoted to tomato and other horticultural crops (ha)Continuous variable86.1697.5080.0520
UAA_fruit (ha)UAA devoted to fruit (ha)Continuous variable10.25 0.250.25
UAA_other (ha)UAA devoted to playing and hunting ground (ha)Continuous variable21.6551.9160.33.01
UAA_tot (ha)Total UAA: sum of the UAA across crops (ha)Continuous variable545.89710.3580.0564
Age_classesAge Classes: 35–44, 45–54, 55–64, 65–74, 75–84546213.63584
d3_schooling_yearsEducation level: schooling years5; 8; 13; 18 schooling years54103.47518
Notes: Obs = observations; SD = standard deviation.
Table A2. Variables and main statistics: Agriculture and water management.
VariableDescriptionRange of ValuesObsMeanSDMinMax
d5_agritradTraditional (non-organic) farmingBinary: No (0), Yes (1)540.9630.19101
d5_agribioOrganic farmingBinary: No (0), Yes (1)540.0370.19101
d5_agrintegratedIntegrated farmingBinary: No (0), Yes (1)540.0550.23101
d6_water_consortiumPercentage of water used from the irrigation bureau0–100%5499.3881.88790100
d6_water_wellPercentage of water used from other sources0–100%540.61111.886010
d7_waterproblemsExperience of problems related to water useBinary: No (0), Yes (1)540.6111.88801
d11_water_out_seasonUse of water outside the irrigation seasonBinary: No (0), Yes (1)540.0550.23101
d12_agri_go_onContinuity of the agricultural business for the next 10 yearsBinary: No (0), Yes (1)540.7410.44201
d14_changeincropChange in crop allocation in the next 10 yearsCategorical: Yes (1), No (2), Don’t Know (3)54 13
d22_adaptationRequired adaptation of existing irrigation practices to use treated wastewater Categorical: Yes (1), No (2), Don’t know (3)54 13
Table A3. Variables and main statistics: Information and awareness.
VariableDescriptionRange of ValuesObsMeanSDMinMax
d16_knowledge_plantKnowledge of wastewater treatment plant Binary: No (0), Yes (1)530.5090.50401
d18_knowledge_projectKnowledge of wastewater treatment project for reuse in agricultureBinary: No (0), Yes (1)540.4810.50401
Table A4. Variables and main statistics: Opinion variables.
VariableDescriptionRange of ValuesObsMeanSDMinMax
d18_knowledge_projectKnowledge of wastewater treatment project for reuse in agricultureBinary: No (0), Yes (1)540.4810.50401
d13_futurecondh2oBeliefs on problems related to future water availabilityCategorical: more Intense = 1; less Intense = 2; Invariant = 3; Don’t know = 454 14
d15_current_waterqualityOpinion on water qualityCategorical: 1 = Bad, 2 = Poor, 3 = Fair, 4 = Good54 04
d19_risksBeliefs on the existence of risks relative to wastewater reuse in agricultureCategorical: Yes (1), No (2), Don’t know (3)54 13
d20_advantagesBeliefs on the existence of advantages relative to wastewater reuse in agricultureCategorical: Yes (1), No (2), Don’t know (3)54 13
d21_informationBeliefs on the sufficiency of the informationCategorical: Yes (1), No (2), Don’t know (3)54 13
d23_acceptabilityAcceptability of wastewater reuse for agricultural purposesCategorical: Yes (1), No (2), Don’t know (3)54 13

Appendix B. Classification Tables

Table A5. Classification score for the dependent variable d19_yesrisks.
Classification
ObservedPredicted
NoYesPercent Correct
No480100.0%
Yes2466.7%
Overall Percentage92.6%7.4%96.3%
Table A6. Classification score for the dependent variable d19_norisks.
Classification
ObservedPredicted
NoYesPercent Correct
No81338.1%
Yes033100.0%
Overall Percentage14.8%85.2%75.9%
Table A7. Classification score for the dependent variable d20_yesadvantage.
Classification
ObservedPredicted
NoYesPercent Correct
No27293.1%
Yes61976.0%
Overall Percentage61.1%38.9%85.2%
Table A8. Classification score for the dependent variable d20_noadvantage.
Classification
ObservedPredicted
NoYesPercent Correct
No42197.7%
Yes5654.5%
Overall Percentage87.0%13.0%88.9%

References

  1. United Nations. Water for People, Water for Life; World Water Development Report (WWDR); UNESCO Pub.: Paris, France, 2003. [Google Scholar]
  2. EEA. Towards Efficient Use of Water Resources in Europe; EEA: Copenhagen, Denmark, 2012.
  3. Kristensen, P. The European Environment: State and Outlook 2010. Water Resources: Quantity and Flows; European Environment Agency: Copenhagen, Denmark, 2010. [Google Scholar]
  4. United Nations. The United Nations World Water Development Report 2017. Wastewater: The Untapped Resource; United Nations: New York, NY, USA, 2017. [Google Scholar]
  5. FAO. World Agriculture: An FAO Study; Taylor and Francis: Abingdon, UK, 2003; ISBN 1351536346. [Google Scholar]
  6. Forzieri, G.; Feyen, L.; Rojas, R.; Flörke, M.; Wimmer, F.; Bianchi, A. Ensemble projections of future streamflow droughts in Europe. Hydrol. Earth Syst. Sci. 2014, 18, 85–108. [Google Scholar] [CrossRef] [Green Version]
  7. Cambridge University Press. IPCC Climate Change 2014: Impacts, Adaptation, and Vulnerability. Part B: Regional Aspects. Contribution of Working Group II to the Fifth Assessment Report of the Intergovernmental Panel on Climate Change; Cambridge University Press: Cambridge, UK, 2014; Volume 688. [Google Scholar]
  8. Holmgren, K.E.; Li, H.; Verstraete, W.; Cornel, P. State of the Art Compendium Report on Resource Recovery from Water; International Water Association: London, UK, 2015. [Google Scholar]
  9. EUE Union. European Commission Common Implementation Strategy for the Water Framework Directive and the Floods Directive; Guidelines on Integrating Water Reuse into Water Planning and Management in the context of the WFD; EUE Union: Brussels, Belgium, 2016. [Google Scholar]
  10. Hernández-Sancho, F.; Molinos-Senante, M.; Sala-Garrido, R. Economic valuation of environmental benefits from wastewater treatment processes: An empirical approach for Spain. Sci. Total Environ. 2010, 408, 953–957. [Google Scholar] [CrossRef] [PubMed]
  11. Kunz, N.C.; Fischer, M.; Ingold, K.; Hering, J.G. Drivers for and against municipal wastewater recycling: A review. Water Sci. Technol. 2016, 73, 251–259. [Google Scholar] [CrossRef] [PubMed]
  12. Kanyoka, P.; Eshtawi, T. Analysing the Trade-Offs of Wastewater Re Use in Agriculture: An Analytical Framework; Interdisciplinary Term Paper, Enter for Fevelopment Research: Bonn, Germany, 2012. [Google Scholar]
  13. United Nations. Wastewater Management: A UN-Water Analytical Brief; United Nations: New York, NY, USA, 2015. [Google Scholar]
  14. Intriago, J.C.; López-Gálvez, F.; Allende, A.; Vivaldi, G.A.; Camposeo, S.; Nicolás Nicolás, E.; Alarcón, J.J.; Pedrero Salcedo, F. Agricultural reuse of municipal wastewater through an integral water reclamation management. J. Environ. Manag. 2018, 213, 135–141. [Google Scholar] [CrossRef] [PubMed]
  15. Salgot, M. Water reclamation, recycling and reuse: Implementation issues. Desalination 2008, 218, 190–197. [Google Scholar] [CrossRef]
  16. Dikinya, O.; Areola, O. Comparative analysis of heavy metal concentration in secondary treated wastewater irrigated soils cultivated by different crops. Int. J. Environ. Sci. Technol. 2010, 7, 337–346. [Google Scholar] [CrossRef] [Green Version]
  17. Huibers, F.P.; Van Lier, J.B. Use of wastewater in agriculture: The water chain approach. Irrig. Drain. 2005, 54. [Google Scholar] [CrossRef]
  18. Makropoulos, C.; Rozos, E.; Tsoukalas, I.; Plevri, A.; Karakatsanis, G.; Karagiannidis, L.; Makri, E.; Lioumis, C.; Noutsopoulos, C.; Mamais, D.; et al. Sewer-mining: A water reuse option supporting circular economy, public service provision and entrepreneurship. J. Environ. Manag. 2018, 216, 285–298. [Google Scholar] [CrossRef] [PubMed]
  19. Leonard, R.; Mankad, A.; Alexander, K. Predicting support and likelihood of protest in relation to the use of treated stormwater with managed aquifer recharge for potable and non-potable purposes. J. Clean. Prod. 2015, 92, 248–256. [Google Scholar] [CrossRef]
  20. Aitken, V.; Bell, S.; Hills, S.; Rees, L. Public acceptability of indirect potable water reuse in the south-east of England. Water Sci. Technol. Water Supply 2014, 14, 875–885. [Google Scholar] [CrossRef] [Green Version]
  21. Po, M.; Nancarrow, B.E.; Leviston, Z.; Porter, N.B.; Syme, G.J.; Kaercher, J. Water for a Healthy Country Predicting Community Behaviour in Relation to Wastewater Reuse; CSIRO: Perth, Australia, 2005. [Google Scholar]
  22. Garrone, P.; Grilli, L.; Groppi, A.; Marzano, R. Barriers and drivers in the adoption of advanced wastewater treatment technologies: A comparative analysis of Italian utilities. J. Clean. Prod. 2018, 171, S69–S78. [Google Scholar] [CrossRef]
  23. Dolnicar, S.; Hurlimann, A.; Grün, B. What affects public acceptance of recycled and desalinated water? Water Res. 2011, 45, 933–943. [Google Scholar] [CrossRef] [PubMed] [Green Version]
  24. Dolnicar, S.; Hurlimann, A. Drinking water from alternative water sources: Differences in beliefs, social norms and factors of perceived behavioural control across eight Australian locations. Water Sci. Technol. 2009, 60, 1433–1444. [Google Scholar] [CrossRef] [PubMed]
  25. Carr, G.; Potter, R.B.; Nortcliff, S. Water reuse for irrigation in Jordan: Perceptions of water quality among farmers. Agric. Water Manag. 2011, 98, 847–854. [Google Scholar] [CrossRef]
  26. Siegrist, M.; Cvetkovich, G. Perception of hazards: The role of social trust and knowledge. Risk Anal. 2000, 20, 713–720. [Google Scholar] [CrossRef] [PubMed]
  27. Italian Ministry of the Environment D.M. 12 Giugno 2003, n. 185. Available online: http://www.depurare.it/normativa/DM_12-6-2003_n-185%20.pdf (accessed on 8 January 2019).
  28. Shakir, E.; Zahraw, Z.; Al-Obaidy, A.H.M.J. Environmental and health risks associated with reuse of wastewater for irrigation. Egypt. J. Pet. 2017, 26, 95–102. [Google Scholar] [CrossRef] [Green Version]
  29. World Health Organization. Who Guidelines for the Safe Use of Wastewater, Excreta and Greywater—Policy and Regutatory Aspects; World Health Organization: Geneva, Switzerland, 2006; Voloume I, p. 114. ISBN 92-4-154685-9. [Google Scholar]
  30. Baggett, S.; Jeffrey, P.; Jefferson, B. Risk perception in participatory planning for water reuse. Desalination 2006, 187, 149–158. [Google Scholar] [CrossRef]
  31. Higgins, J.; Warnken, J.; Sherman, P.P.; Teasdale, P.R. Survey of users and providers of recycled water: Quality concerns and directions for applied research. Water Res. 2002, 36, 5045–5056. [Google Scholar] [CrossRef]
  32. Hurlimann, A.; Hemphill, E.; McKay, J.; Geursen, G. Establishing components of community satisfaction with recycled water use through a structural equation model. J. Environ. Manag. 2008, 88, 1221–1232. [Google Scholar] [CrossRef]
  33. Eiser, J.R.; Miles, S.; Frewer, L.J. Trust, Perceived Risk, and Attitudes Toward Food Technologies1. J. Appl. Soc. Psychol. 2002, 32, 2423–2433. [Google Scholar] [CrossRef]
  34. Mankad, A.; Tapsuwan, S. Review of socio-economic drivers of community acceptance and adoption of decentralised water systems. J. Environ. Manag. 2011, 92, 380–391. [Google Scholar] [CrossRef] [PubMed]
  35. Robinson, K.G.; Robinson, C.H.; Raup, L.A.; Markum, T.R. Public attitudes and risk perception toward land application of biosolids within the south-eastern United States. J. Environ. Manag. 2012, 98, 29–36. [Google Scholar] [CrossRef] [PubMed]
  36. Siegrist, M.; Keller, C.; Kastenholz, H.; Frey, S.; Wiek, A. Laypeople’s and Experts’ Perception of Nanotechnology Hazards. Risk Anal. 2007, 27, 59–69. [Google Scholar] [CrossRef] [PubMed]
  37. Genius, M.; Menegaki, A.N.; Tsagarakis, K.P. Assessing preferences for wastewater treatment in a rural area using choice experiments. Water Resour. Res. 2012, 48. [Google Scholar] [CrossRef] [Green Version]
  38. Genius, M.; Manioudaki, M.; Mokas, E.; Pantagakis, E.; Tampakakis, D.; Tsagarakis, K.P. Estimation of willingness to pay for wastewater treatment. In Water Science and Technology: Water Supply; IWA Publishing: London, UK, 2005; Volume 5, pp. 105–113. [Google Scholar]
  39. Menegaki, A.N.; Hanley, N.; Tsagarakis, K.P. The social acceptability and valuation of recycled water in Crete: A study of consumers’ and farmers’ attitudes. Ecol. Econ. 2007, 62, 7–18. [Google Scholar] [CrossRef]
  40. Tziakis, I.; Pachiadakis, I.; Moraitakis, M.; Xideas, K.; Theologis, G.; Tsagarakis, K.P. Valuing benefits from wastewater treatment and reuse using contingent valuation methodology. Desalination 2009, 237, 117–125. [Google Scholar] [CrossRef]
  41. Wustenhagen, R.; Wolsink, M.; Burer, M. Social acceptance of renewable energy innovation: An introduction to the concept. Energy Policy 2007, 35, 2683–2691. [Google Scholar] [CrossRef] [Green Version]
  42. Alhumoud, J.M.; Behbehani, H.S.; Abdullah, T.H. Wastewater reuse practices in Kuwait. Environmentalist 2003, 23, 117–126. [Google Scholar] [CrossRef]
  43. Dolnicar, S.; Schäfer, A.I. Desalinated versus recycled water: Public perceptions and profiles of the accepters. J. Environ. Manag. 2009, 90, 888–900. [Google Scholar] [CrossRef]
  44. Lohman, L.C.; Milliken, J.G. Informational/Educational Approaches to Public Attitudes on Potable Reuse of Wastewater; Denver Research Institute, University of Denver: Denver, CO, USA, 1985. [Google Scholar]
  45. McKay, J.; Hurlimann, A. Attitudes to reclaimed water for domestic use: Part 1. Age. Water 2003, 30, 45–49. [Google Scholar]
  46. Ross, V.L.; Fielding, K.S.; Louis, W.R. Social trust, risk perceptions and public acceptance of recycled water: Testing a social-psychological model. J. Environ. Manag. 2014, 137, 61–68. [Google Scholar] [CrossRef] [PubMed]
  47. Ajzen, I. From Intentions to Actions: A Theory of Planned Behavior. In Action Control; Springer: Berlin/Heidelberg, Germany, 1985; pp. 11–39. [Google Scholar]
  48. Ajzen, I. Attitudes, Personality and Behavior, 2nd ed.; Manstead, T., Ed.; Open University Press: New York, NY, USA, 2005; ISBN 0335217036. [Google Scholar]
  49. Mankad, A. Decentralised water systems: Emotional influences on resource decision making. Environ. Int. 2012, 44, 128–140. [Google Scholar] [CrossRef]
  50. Jeffrey, P.; Jefferson, B. Public receptivity regarding “in-house” water recycling: Results from a UK survey. In Water Science and Technology: Water Supply; IWA Publishing: London, UK, 2003; Volume 3, pp. 109–116. [Google Scholar]
  51. Gregory, R.; Mendelsohn, R. Perceived Risk, Dread, and Benefits. Risk Anal. 1993, 13, 259–264. [Google Scholar] [CrossRef]
  52. Slovic, P.; Fischhoff, B.; Lichtenstein, S. Why Study Risk Perception? Risk Anal. 1982, 2, 83–93. [Google Scholar] [CrossRef]
  53. Wu, X.; Kumar, V.; Ross, Q.J.; Ghosh, J.; Yang, Q.; Motoda, H.; McLachlan, G.J.; Ng, A.; Liu, B.; Yu, P.S.; et al. Top 10 algorithms in data mining. Knowl. Inf. Syst. 2008, 14, 1–37. [Google Scholar] [CrossRef]
  54. Kass, G.V. An Exploratory Technique for Investigating Large Quantities of Categorical Data. Appl. Stat. 1980, 29, 119–127. [Google Scholar] [CrossRef]
  55. Loh, W.-Y. Classification and regression trees. WIREs Data Min. Knowl. Discov. 2011, 1, 14–23. [Google Scholar] [CrossRef]
  56. Tsien, C.L.; Fraser, H.S.; Long, W.J.; Kennedy, R.L. Using classification tree and logistic regression methods to diagnose myocardial infarction. Stud. Health Technol. Inform. 1998, 52 Pt 1, 493–497. [Google Scholar]
  57. Shepherd, K.D.; Walsh, M.G. Development of Reflectance Spectral Libraries for Characterization of Soil Properties. Soil Sci. Soc. Am. J. 2002, 66, 988–998. [Google Scholar] [CrossRef]
  58. Zheng, H.; Chen, L.; Han, X.; Zhao, X.; Ma, Y. Classification and regression tree (CART) for analysis of soybean yield variability among fields in Northeast China: The importance of phosphorus application rates under drought conditions. Agric. Ecosyst. Environ. 2009, 132, 98–105. [Google Scholar] [CrossRef] [Green Version]
  59. Waheed, T.; Bonnell, R.B.; Prasher, S.O.; Paulet, E. Measuring performance in precision agriculture: CART-A decision tree approach. Agric. Water Manag. 2006, 84, 173–185. [Google Scholar] [CrossRef]
  60. Tittonell, P.; Shepherd, K.D.; Vanlauwe, B.; Giller, K.E. Unravelling the effects of soil and crop management on maize productivity in smallholder agricultural systems of western Kenya-An application of classification and regression tree analysis. Agric. Ecosyst. Environ. 2008, 123, 137–150. [Google Scholar] [CrossRef]
  61. Viaggi, D.; Raggi, M.; y Paloma, S.G. Understanding the determinants of investment reactions to decoupling of the Common Agricultural Policy. Land Use Policy 2011, 28, 495–505. [Google Scholar] [CrossRef]
  62. Po, M.; Kaercher, J.; Nancarrow, E. Literature Review of Factors Influencing Public Perceptions of Water Reuse. CSIRO Land Water 2003, 54, 1–44. [Google Scholar]
  63. European Commission. Guide to Cost-Benefit Analysis of Investment Projects. Economic Appraisal Tool for Cohesion Policy 2014–2020; European Commission: Brussels, Belgium, 2014. [Google Scholar]
  64. Robinson, K.G.; Robinson, C.H.; Hawkins, S.A. Assessment of public perception regarding wastewater reuse. In Water Science and Technology: Water Supply; IWA Publishing: London, UK, 2005; Volume 5, pp. 59–65. [Google Scholar]
  65. Tsagarakis, K.P.; Georgantzis, N. The role of information on farmers’ willingness to use recycled water for irrigation. In Water Recycling in the Mediterranean Region; IWA Publishing: London, UK, 2003; Volume 3, pp. 105–113. ISBN 1606-9749r1-84339-457-X. [Google Scholar]
  66. Siegrist, M.; Cvetkovich, G.; Roth, C. Salient Value Similarity, Social Trust, and Risk/Benefit Perception. Risk Anal. 2000, 20, 353–362. [Google Scholar] [CrossRef]
Figure 1. Study area with the indication of irrigated allotments (on the left) and crop allocations (on the right). Courtesy of the Water Consortium of Reggio Emilia (Consorzio di Bonifica dell’Emilia Centrale: http://www.emiliacentrale.it/).
Water 11 00108 g001
Figure 2. Determinants of the positive perception of risks derived from the use of purified wastewater (d19_yesrisk: Beliefs on the existence of risks: 1 = Yes, 0 = otherwise (no + don’t know)). df: degrees of freedom.
Water 11 00108 g002
Figure 3. Determinants of the negative perception of risks derived from the use of purified wastewater (d19_norisk: Beliefs on the inexistence of risks: 1 = Yes, 0 = otherwise (no + don’t know)). df: degrees of freedom.
Water 11 00108 g003
Figure 4. Determinants of the positive perception of benefits/advantages derived from the use of purified wastewater (d20_yesadvantages: Beliefs regarding the existence of advantages: 1 = Yes, 0 = otherwise (no + don’t know)). df: degrees of freedom.
Water 11 00108 g004
Figure 5. Determinants of the negative perception of benefits/advantages from the use of purified wastewater (d20_noadvantages: Beliefs on their inexistence: 1 = Yes, 0 = otherwise (no + don’t know)). df: degrees of freedom.
Water 11 00108 g005
Table 1. Perceptions on future availability of water resources.
BeliefsFrequencyFrequency (%)Age (mean)Schooling Years (Mean)Utilized Agricultural Area (UAA)Number of Crops Grown (mean)Water Quality *
Problems higher in intensity/frequency112056118.161.42.46
Problems lower in intensity/frequency12508312
Situation remains the same325966103.51.32.63
Don’t know1019561111.271.52.3
* Perceptions on water quality is measured on a scale going from 0 to 4 (from bad to good).
Table 2. Dependent variables of the Chi-squared Automatic Interaction Detector (CHAID) analysis.
Variable NameVariable Description
d19_norisksBeliefs on the existence of risks in using treated wastewater: NO = 1; 0 otherwise
d19_yesrisksBeliefs on the existence of risks to using treated wastewater: YES = 1; 0 otherwise
d20_noadvantageBeliefs on the existence of advantages in using treated wastewater: NO = 1; 0 otherwise
d20_yesadvantageBeliefs on the existence of advantages in using treated wastewater: YES = 1; 0 otherwise
Table 3. Partitioning variables and hierarchic levels, by classification tree (hierarchy of the splitting node in parentheses).
Response/Opinion Variables
d19_yesrisksd19_norisksd20_yesadvantaged20_noadvantage
Explanatory VariablesVariable DescriptionFigure 2
First tree
Figure 3
Second tree
Figure 4
Third tree
Figure 5
Fourth tree
d3_lsdiplomaLower secondary school diploma obtained: YES = 1; 0 otherwise(2th) (4th)(1st)
d3_diplomaUpper secondary school diploma obtained: YES = 1; 0 otherwise(3rd)
d4_garden_parkFarmer devotes land to gardening and parks: YES = 1; 0 otherwise(4th) (6th)
d4_grapesFarmer devotes land to grapes: YES = 1; 0 otherwise(4th)(4th)
d4_permanent_pastureFarmer devotes land to permanent grassland production: YES = 1; 0 otherwise(5th)
d4_alfaalfaFarmer devotes land to alfalfa production: YES = 1; 0 otherwise (1st)(5th)
d4_soyFarmer devotes land to soybean production: YES = 1; 0 otherwise (3rd)
d4_tomatoFarmer devotes land to tomato production: YES = 1; 0 otherwise (2nd)
d6_water_consortium% of water used from the irrigation bureau (4th)(4th)
d13_invariateWater availability conditions are expected to remain unchanged in the future. YES = 1; 0 otherwise(2nd)
d13_moreintenseMore intense and frequent problems of water availability are expected in the future. YES = 1; 0 otherwise (2nd)
d17_potential_waterqualityWastewater treatment has impacts on effluent water quality: YES = 1; 0 otherwise(1st)
d17_impactyesWastewater treatment can have negative impacts on local environment: YES = 1; 0 otherwise (3rd) (3rd)
d18_knowlege_reuse_projectPercentage of water used from the irrigation bureau (3rd)(4th)
d21_insufficient_informationFarmer believes local firms will accept wastewater reuse for agricultural purposes: YES = 1; 0 otherwise (2nd) (2nd)
d22_noadaptationNo adaptation of current practices is needed to reuse wastewater for irrigation: YES = 1; 0 otherwise (2nd); (3rd)
d23_acceptabilityesFarmer has knowledge of the wastewater reuse project: YES = 1; 0 otherwise (1st)

