Comparison of Optimal Hedging Policies for Hydropower Reservoir System Operation


1
Environmental Health Engineering Research Centre, Kerman University of Medical Sciences, Kerman 76169-13555, Iran
2
Department of Water Resources Engineering, College of Engineering, University of Baghdad, Jadriya 10070, Iraq
3
Department of Civil, Environmental and Natural Resources Engineering, Lulea University of Technology, 971 87 Lulea, Sweden
4
Department of Environmental Health, School of Public Health, Kerman University of Medical Sciences, Kerman 76169-13555, Iran
*
Authors to whom correspondence should be addressed.
Water 2019, 11(1), 121; https://doi.org/10.3390/w11010121
Submission received: 19 October 2018
/
Revised: 31 December 2018
/
Accepted: 3 January 2019
/
Published: 10 January 2019
(This article belongs to the Special Issue Water Resources Management Strategy Under Global Change)
Abstract
:Reservoir operation rules play an important role in regions economic development. Meanwhile, hedging policies are mostly applied for municipal, industrial, and irrigation water supplies from reservoirs and it is less used for reservoir operation for hydropower generation. The concept of hedging and rationing factors can be used to maintain the water in a reservoir for the sake of increasing water storage and water head for future use. However, water storage and head are the key factors in operation of reservoir systems for hydropower generation. This study investigates the applicability of seven competing hedging policies including four customary forms of hedging (1PHP, 2PHP, 3PHP, DHP) and three new forms of hedging rules (SOPHP, BSOPHP, SHPHP) for reservoir operation for hydropower generation. The models were constructed in MATLAB R2011b based on the characteristics of the Batang Padang hydropower reservoir system, Malaysia. In order to maximize the output of power generation in operational periods (2003–2009), three optimization algorithms namely particle swarm optimization (PSO), genetic algorithm (GA), and hybrid PSO-GA were linked to one of the constructed model (1PHP as a test) to find the most effective algorithm. Since the results demonstrated the superiority of the hybrid PSO-GA algorithm compared to either PSO or GA, the hybrid PSO-GA were linked to each constructed model in order to find the optimal decision variables of each model. The proposed methodology was validated using monthly data from 2010–2012. The results showed that there are no significant difference between the output of monthly mean power generation during 2003–2009 and 2010–2012.The results declared that by applying the proposed policies, the output of power generation could increase by 13% with respect to the historical management. Moreover, the discrepancies between mean power generations from highest to lowest months were reduced from 49 MW to 26 MW, which is almost half. This means that hedging policies could efficiently distribute the water-supply and power-supply in the operational period and increase the stability of the system. Among the studied hedging policies, SHPHP is the most convenient policy for hydropower reservoir operation and gave the best result.
1. Introduction
Water is an environmentally-friendly source of energy generation. Hydropower has undeniably been the cleanest and most efficient source of renewable energy, which has a significant value for sustainable development [1]. In recent years, most developed and developing countries use cheap and confident hydropower reservoir systems for power generation [2]. To achieve the highest system efficiency, researchers seek to apply the most convenient operation to gain good performance with highest energy production. Many rule curves and decision policies are applied and investigated such as standard operation policy, hedging rule, space rule, pack rule, linear decision rule, neural networks based rule, etc. [3,4]. Among the mentioned policies, hedging policies have got more attention due to more recent drought events, water demand increment, and also uncertainty in water sources [5]. The main reason for the appeal of hedging policies is to uniformly distribute the water deficiency to decrease the future severe shortages. To explain more, hedging policies keep some water in a reservoir at present to diminish greater water deficits in the future [6]. Therefore, these policies have usually use a reservoir with the aim of serving municipal, irrigation, industrial, and drinking water needs, using less water in the hydropower reservoir system.
The ideology of hedging policies can also be used in the hydropower reservoir systems. Since the concept of hedging and rationing factors are used to maintain the water at present to increase the water storage and water head in the future, which are the key factors in hydropower reservoir systems [7]. There are custom forms of hedging policies such as continuous hedging policies (one-point hedging policy, two-point hedging policy, and three-point hedging policy [8,9]), and discrete hedging policy [10]. These policies have been used for all types of reservoir operation. Tayebiyan [11] proposed exclusive forms of hedging policies, namely modified standard hedging policy, modified standard operating policy, and binary standard operating policy, which can be applied to hydropower reservoir systems. According to previous study, it can be concluded that the idea of hedging and rationing can be used in hydropower reservoir systems.
Moreover, it seems that application of hedging rules is always accompanied with optimization algorithms. There have been many studies which used heuristic algorithms to find the optimal hedging policies. For example, Spiliotis [12] used particle swarm optimization to find the optimal hedging policies in four water reservoir system in Spain. Sadat Ashofteh [13] applied a logical genetic programming to specify hedging rules for the Aidoghmoush single-purpose reservoir in northeastern Iran. Meanwhile, the application of hybrid algorithms attracts attention due to their power and accuracy compared to using a single algorithm. For example, Aboutalebi [14] present the combination of the non-dominated sorting genetic algorithm with support vector regression and nonlinear programming to find the optimum operational policies of Karoon-4 reservoir, Iran.
Ehteram proposed a new algorithm by merging the genetic algorithm with the krill algorithm to discover the optimal operation policy in both single and multi-purposes reservoirs to converge to global optimum in shorter time [15]. The idea of using coupled or hybrid algorithm is to use the advantages of algorithms simultaneously.
In this research, the applicability of seven competing hedging policies including four customary forms of hedging policy (1PHP, 2PHP, 3PHP, DHP) and three new forms of hedging rule (SOPHP, BSOPHP, SHPHP) for hydropower reservoir operation were investigated and compared. The proposed methodology has never been applied to any reservoir system particularly for maximization of power generation. In order to compare the competing hedging policies, Batang Padang hydro scheme, Malaysia was selected as a case study. Meanwhile, daily mathematical models that are based on hedging rules and optimization of power generation from operation of reservoir system were constructed in MATLAB R2011b. Afterwards, three optimization algorithms—namely particle swarm optimization (PSO), genetic algorithm (GA), and combination of PSO and GA, which is called hybrid PSO-GA—were linked to one of the constructed model (1PHP as a test) in order to find the most effective algorithm. Since the results demonstrated the superiority of the hybrid optimization algorithm compared to either PSO or GA, the hybrid PSO-GA were linked to each constructed model in order to find the global maximization. Maximizing the total power generation over the operational periods is chosen as an objective function, while physical and operational limitations were satisfied.
2. Materials and Methods
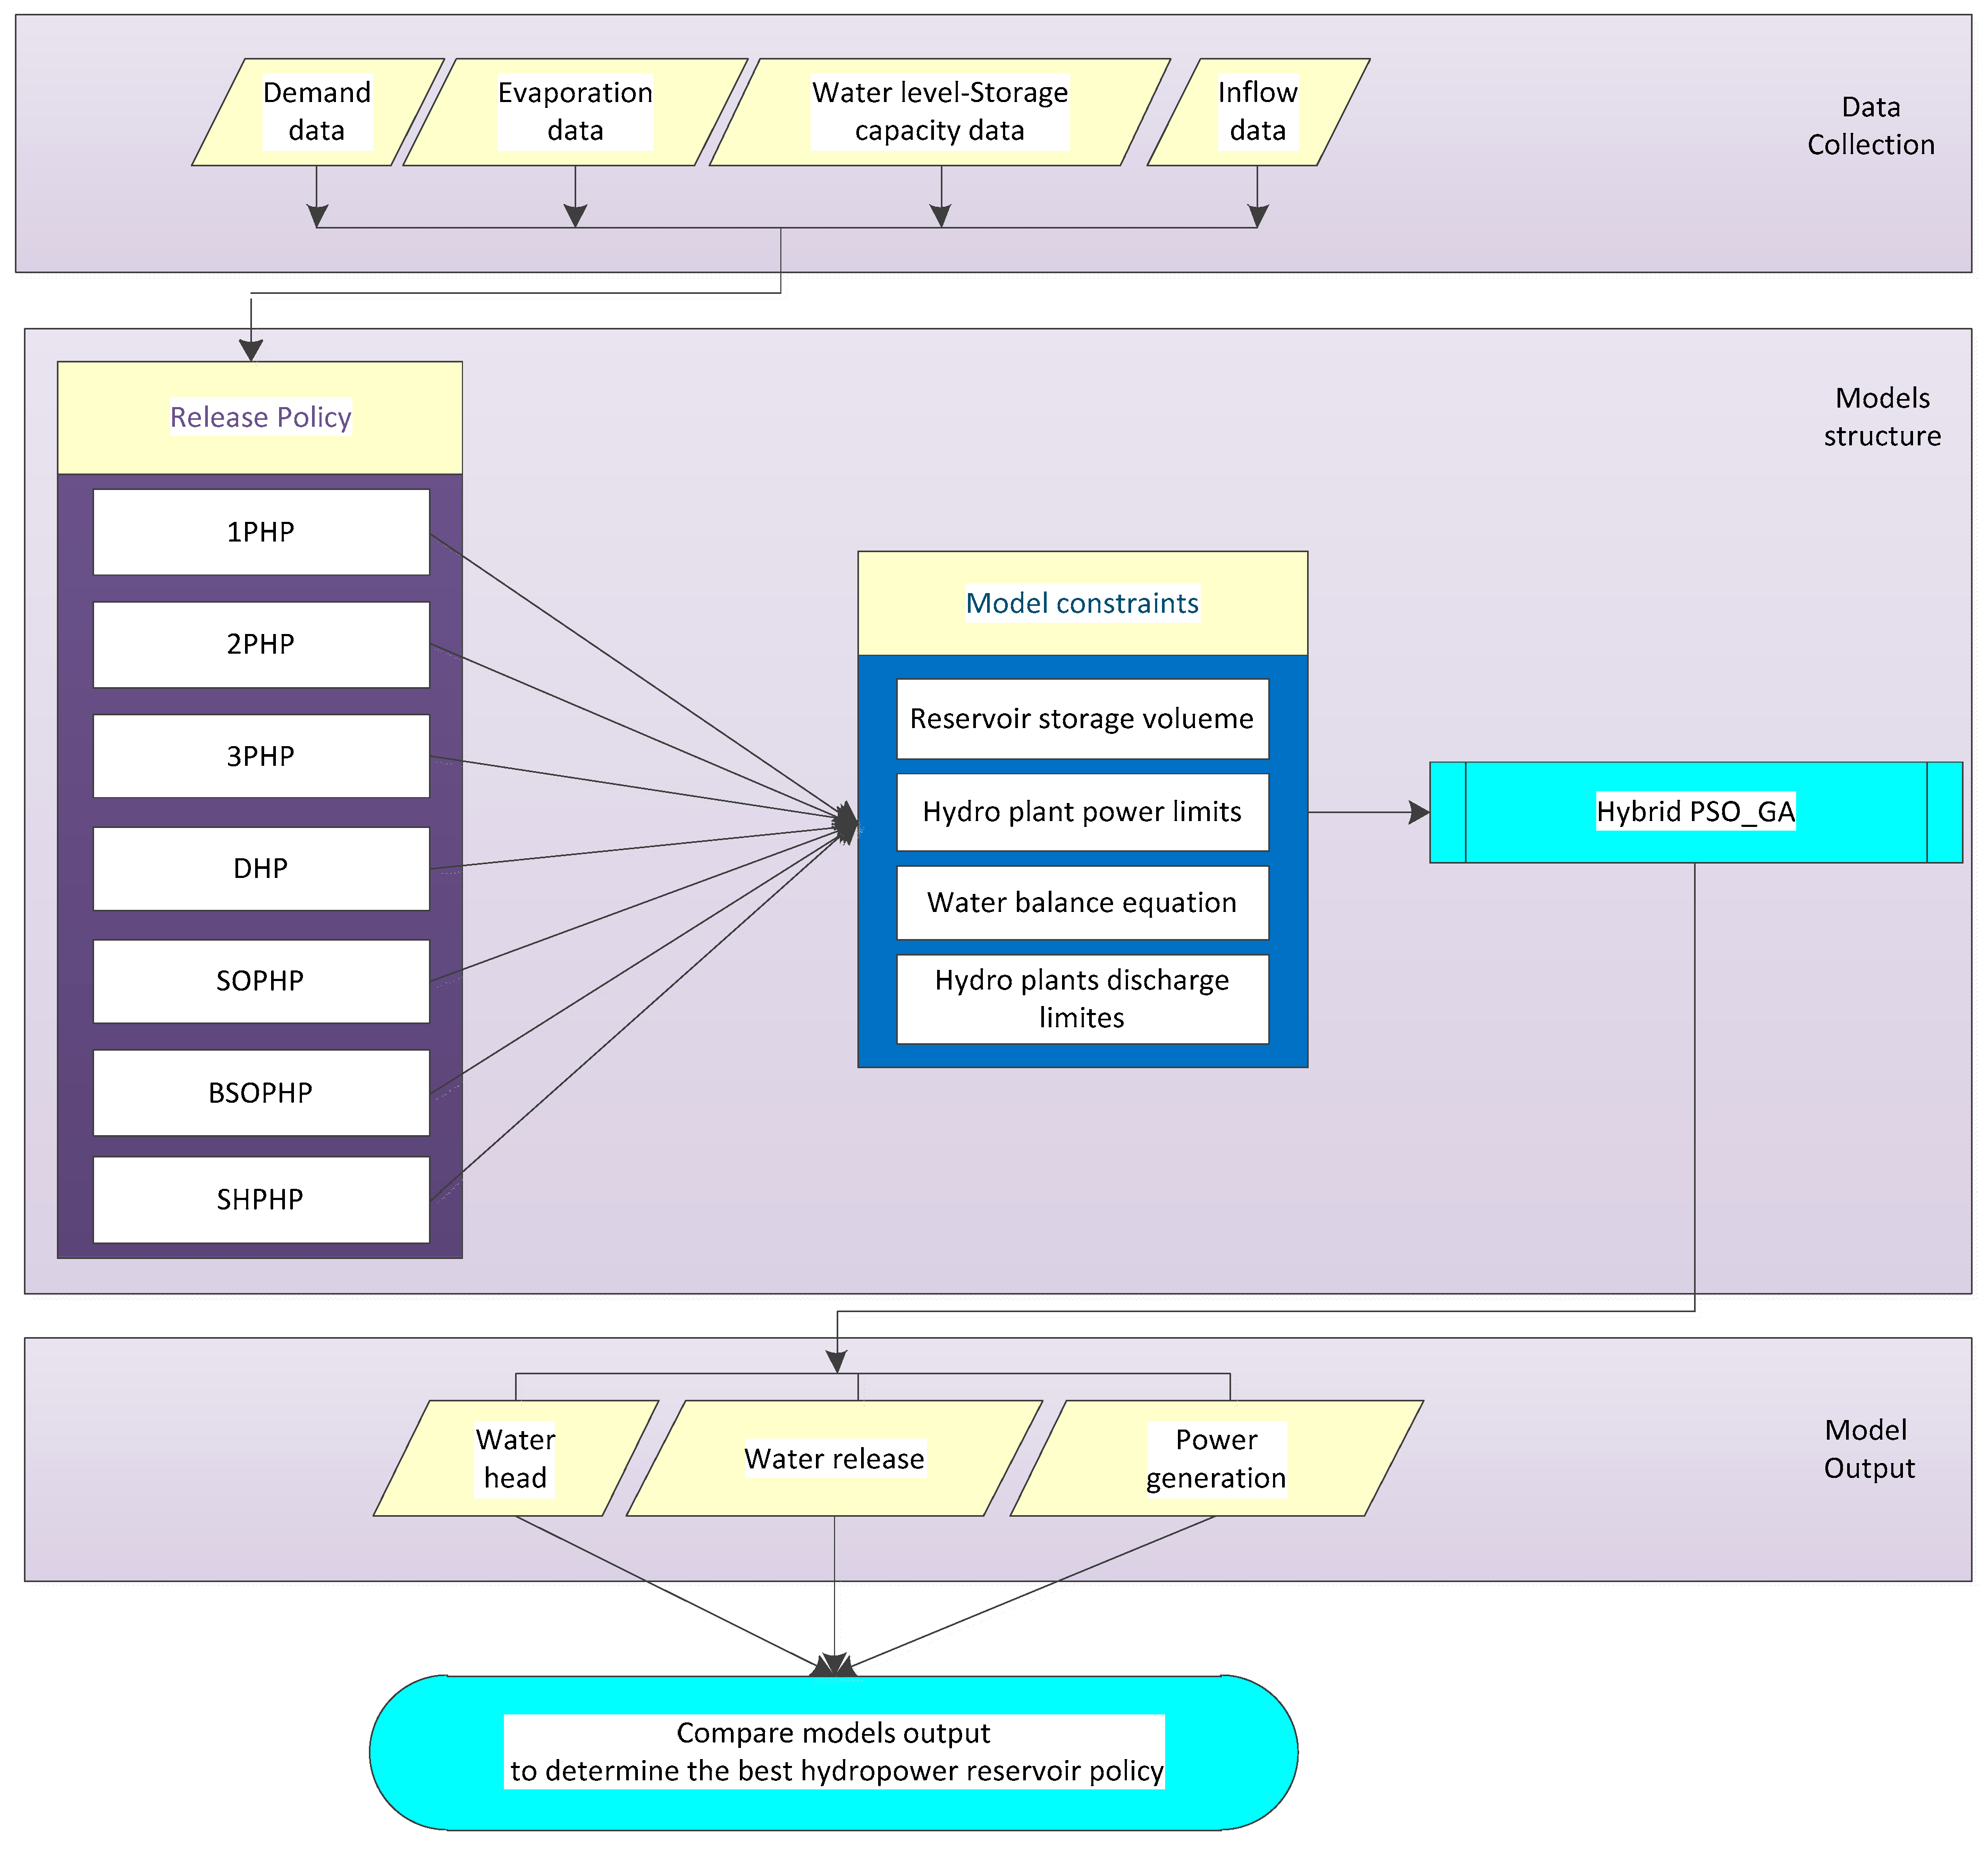
The flowchart of the present work is summarized in Figure 1, which is comprised of four sections. Data collection includes demand data, evaporation data, water elevation-storage capacity, and daily inflow data. These data were used as input data of the models. The model structure is comprised of different forms of hedging policies based on the release rules, while all constraints are the same. The constructed models thereafter were linked to the hybrid PSO-GA algorithm. The outputs of models are daily water head, water release, and power generation. Afterwards, the results of constructed models were analyzed and compared to determine the best policy among the studied policies.
2.1. Data Collection
The required data for implementing this research are demand data, evaporation data, water elevation-storage capacity, and daily inflow data, which should be gathered or estimated. The first parameter is target demand data. In terms of water demand, Reservoirs with the purpose of hydropower are completely different with other types of reservoirs. To explain more, in a case of reservoir operation for municipal use, the amount of water demand is fixed and release is based on water availability and demand. Regarding irrigation requirements, the demand varies from season to season depending on weather conditions and the annual demand pattern is repeated year after year. However, in the case of operation of a reservoir for hydropower generation, the water demand is not fixed and varies though the constant power demand. This means that when more water is stored in the reservoir, the head is also greater and hence a smaller discharge from the reservoir may be sufficient to produce the power demand. However, if the storage is lower, to produce the power demand, a large quantity of water must be discharged. To sum up the foregoing, the water demand for hydropower production is changeable and depends on the water head or water availability. So, there is not any specific target demand pattern available for hydropower reservoir system. Meanwhile, in order to determine the target demand in the case study, the historical data of release were analyzed and the average of reservoir release during the operation period (2003–2012) was taken as a target demand (constant value:1 Mm3).
The daily evaporation data (mm) was collected from site 1030 (Latitude: 4.466, Longitude: 101.366, Altitude: 1545 m) Cameron Highlands at Tanah Rata, Pahang, Malaysia.
The relation between water elevation-storage capacity is presented in Figure S1 (Supplementary file).
The next parameter that is so essential for study of reservoir operation is stream flow. However, TNB did not have any stream flow gages to record river discharge coming into reservoir systems, some estimation has made for stream flow data based on the daily power station, which pass the turbines. It is remarkable to note that all the data were taken from Tenaga Nasional Berhad (TNB), Malaysia.
2.2. Study Area
Ringlet reservoir in the district of Cameron Highlands, Malaysia impounds the waters of Bertam River and its tributaries and also those of the Telom River and its tributaries, which have been diverted from their original course and now pass through the Telom tunnel into the Bertam catchment. From the Ringlet reservoir, the water is led through the Bertam tunnel (6.8 km in length) to the high-pressure penstocks of the Sultan Yusuf Power Station (SYPS), which has a total installed capacity of 100 MW. After leaving the SYPS, the water is carried through a tailrace tunnel into the Jor reservoir of the Batang Padang Hydro Scheme (BPHS). The BPHS is situated in the Tapah Hills Forest Reserve in the state of Perak. The system impounds the discharge from the SYPS together with the waters of the Jor River, Sekam River, and Batang Padang River within the Jor reservoir, which is situated near the 28.16 km on the Tapah-Cameron Highlands road in the state of Perak. The characteristics of Jor dam and Jor reservoir is summarized in Table S2.
From Jor reservoir, the water will enter Menglang tunnel and after travelling a distance of 14.5 km through this tunnel, will generate power in the Sultan Idris II underground power station (SIPS) with an installed capacity of 150 kW. SIPS is an underground station, the natural ground level being about 274 m vertically above the station itself. The three turbines in the station are vertical shaft Francis turbines, running at a speed of 600 (rev/min). The static head on these turbines is 420.6 m, which is amongst the highest heads in the world for this type of turbine. The turbines are directly coupled to vertical shaft alternators, each capable of delivering 50 MW.
Small side stream intakes are situated along the line of Menglang tunnel where additional water is flowing to this tunnel. The monthly flow of Jor River and side stream Rivers is shown in Figure 2. The BPHS utilizes water from a total catchment area of 396.27 km2 and the average flow for power generation is around 16.6 m3/s. These data were taken from the Tenaga Nasional Berhad, Malaysia.
2.3. Reservoir Operation Policies
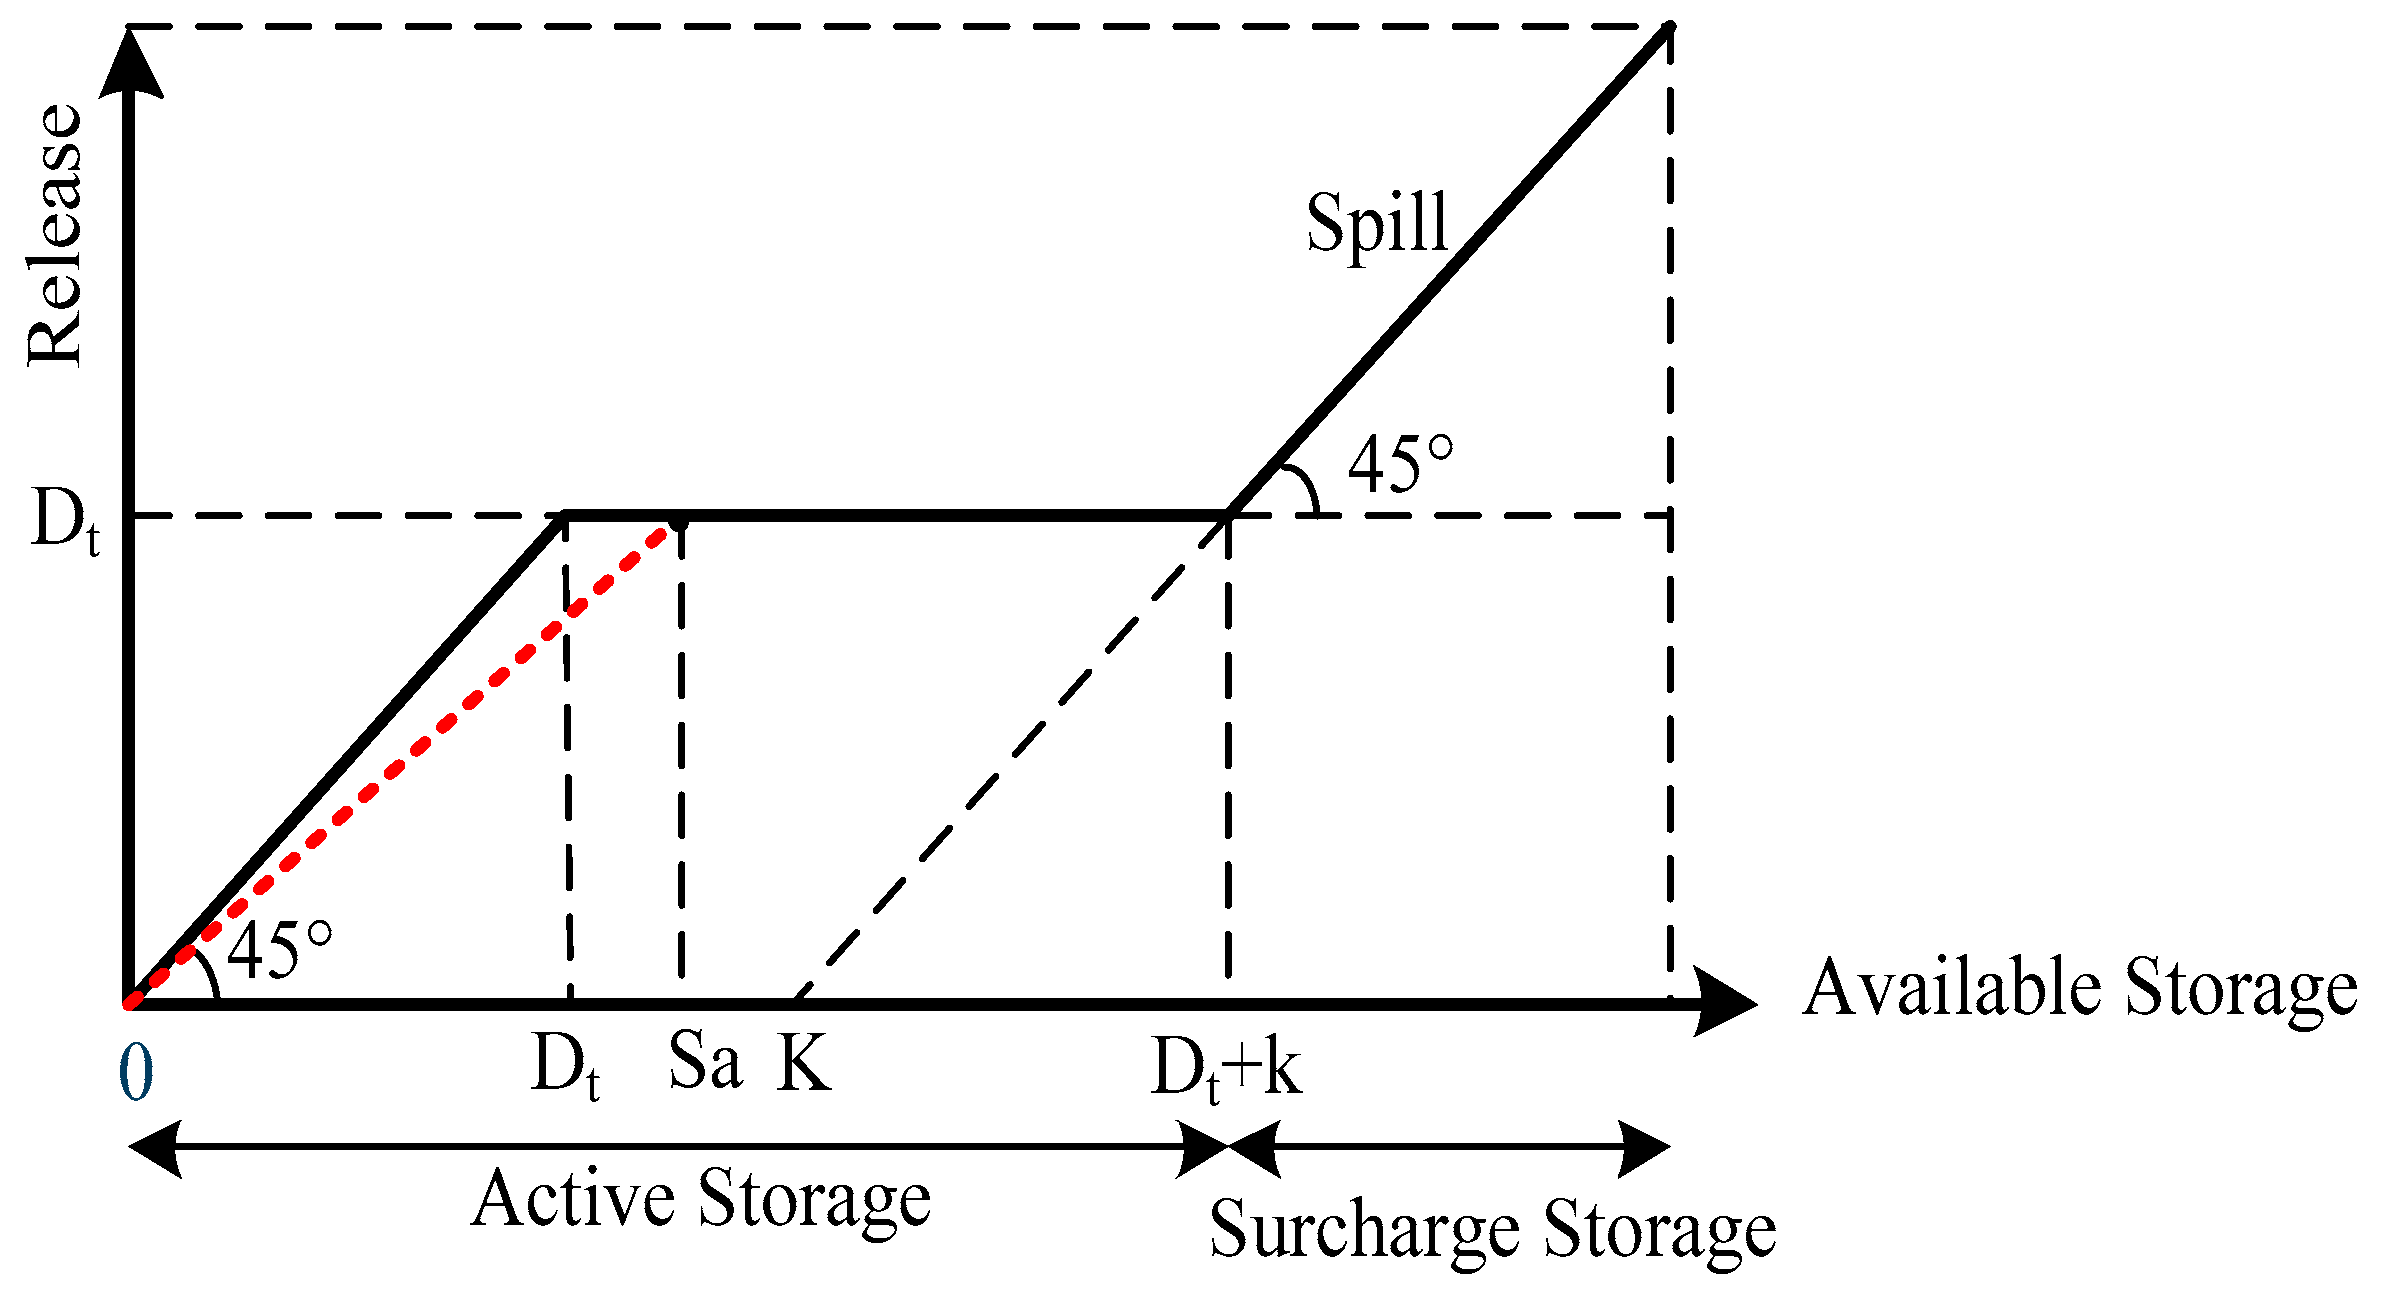
2.3.1. One Point Hedging Policy (1PHP)
There is only one rationing stage in 1PHP (Figure 3), which the slope of this line (red line) is less than 45°. As a result, the amount of water release (Rt) will be less than the available storage (Wt) and release cannot fulfil the target demand (Dt). Sa represents the changing point on the target demand line specified as a decision variable for the 1PHP, which must be simulated or optimized. Moreover, when the amount of available storage touches Sa in 1PHP, the water release could fulfil the target demand until the available storage equals the target demand plus the reservoir capacity. The last stage of hedging policies is the same. If the available storage surpasses the summation of target demand (Dt) and active storage (K), spill (SPt) will occur [9]. For more information about the formulation of this policy, refer to Table S1 (1PHP).
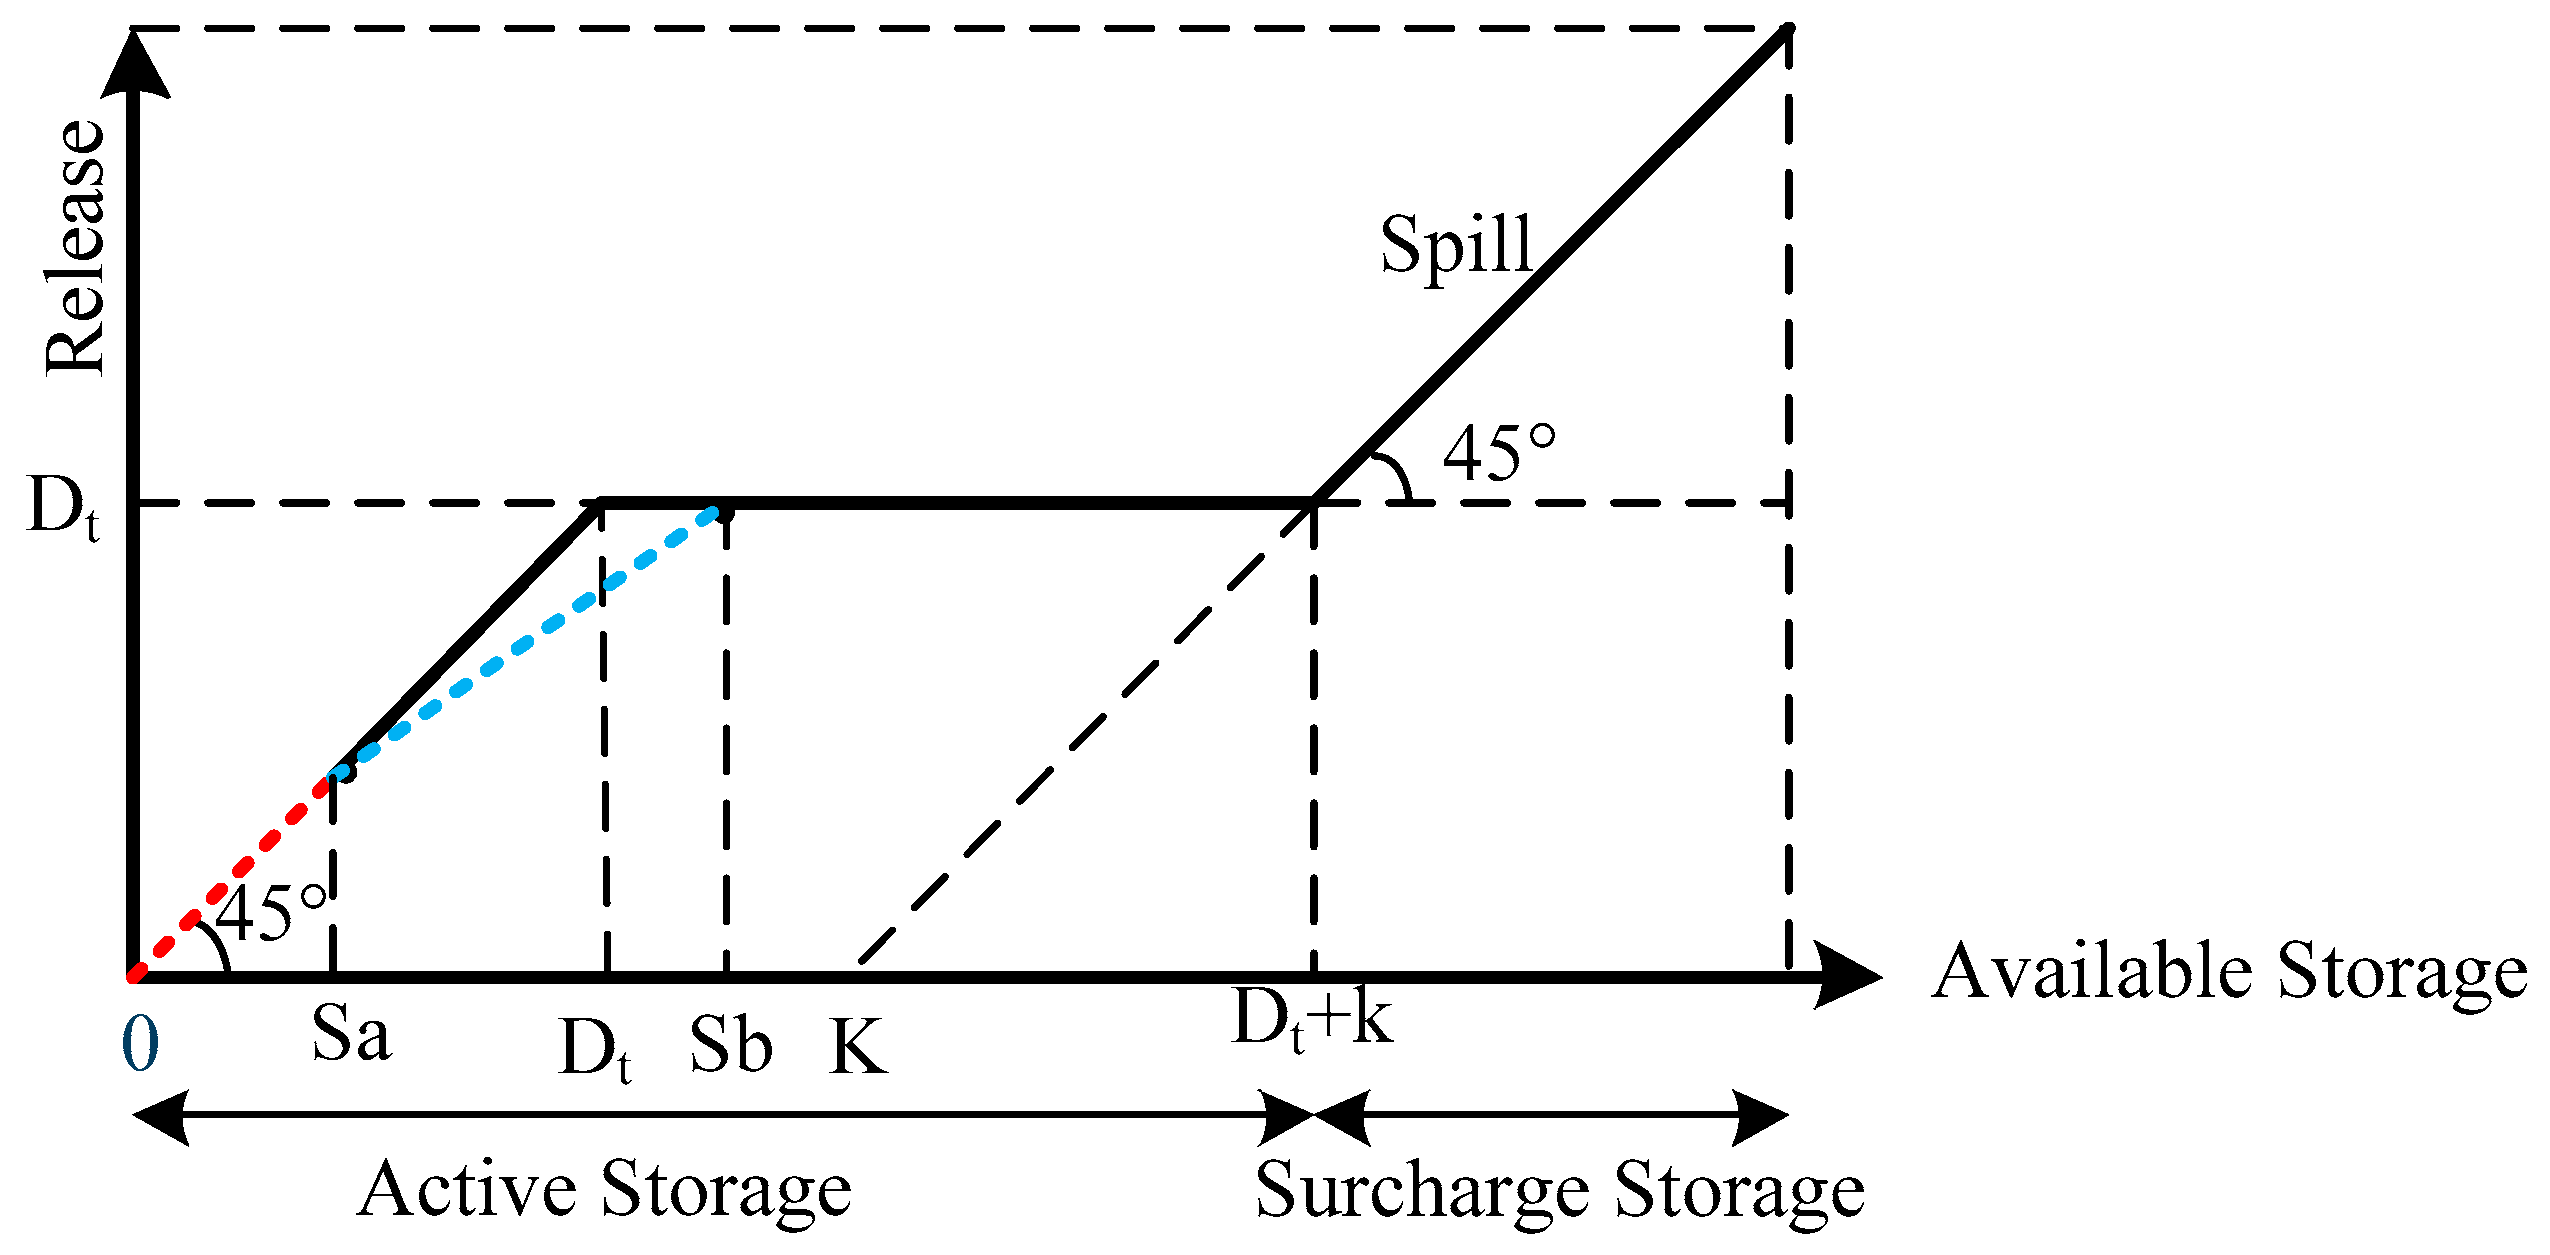
2.3.2. Two Point Hedging Policy (2PHP)
There are two rationing stages in 2PHP, which the rationing lines are smoother than the 1PHP. It means in a case of same available storage, if we compare the 1PHP with 2PHP policy, the amount of release in 2PHP is higher than 1PHP and less water will be saved for the future. The parameters Sa and Sb indicate reservoir storage at the first and second changing points respectively. These two parameters afterwards should be optimized to form the 2PHP for the specific reservoir. Whenever the available storage exceeds Sb, the water release could satisfy the target demand until the available storage goes beyond the sum of Dt + K and the spill occurs (Figure 4). The rest of the parameters were introduced earlier. For more information about the formulation of this policy, refer to Table S1 (2PHP) [16].
2.3.3. Three-Point Hedging Policy (3PHP)
The 3PHP is the moderate form of the 2PHP (Figure 5). Therefore, the whole process is the same excepting the number of rationing stages, which is three. In these areas, water release could not satisfy the target demand. The parameters Sa, Sb, and Sc display reservoir storage are the first, second, and third changing points of the 3PHP respectively. These three parameters should be simulated or optimized to shape the 3PHP policy for specific reservoir. Whenever the available storage passes Sc, the water release could totally meet the target demand. The rest of the procedure is the same as in the 2PHP policy. For more information about the formulation of this policy, refer to Table S1 (3PHP).
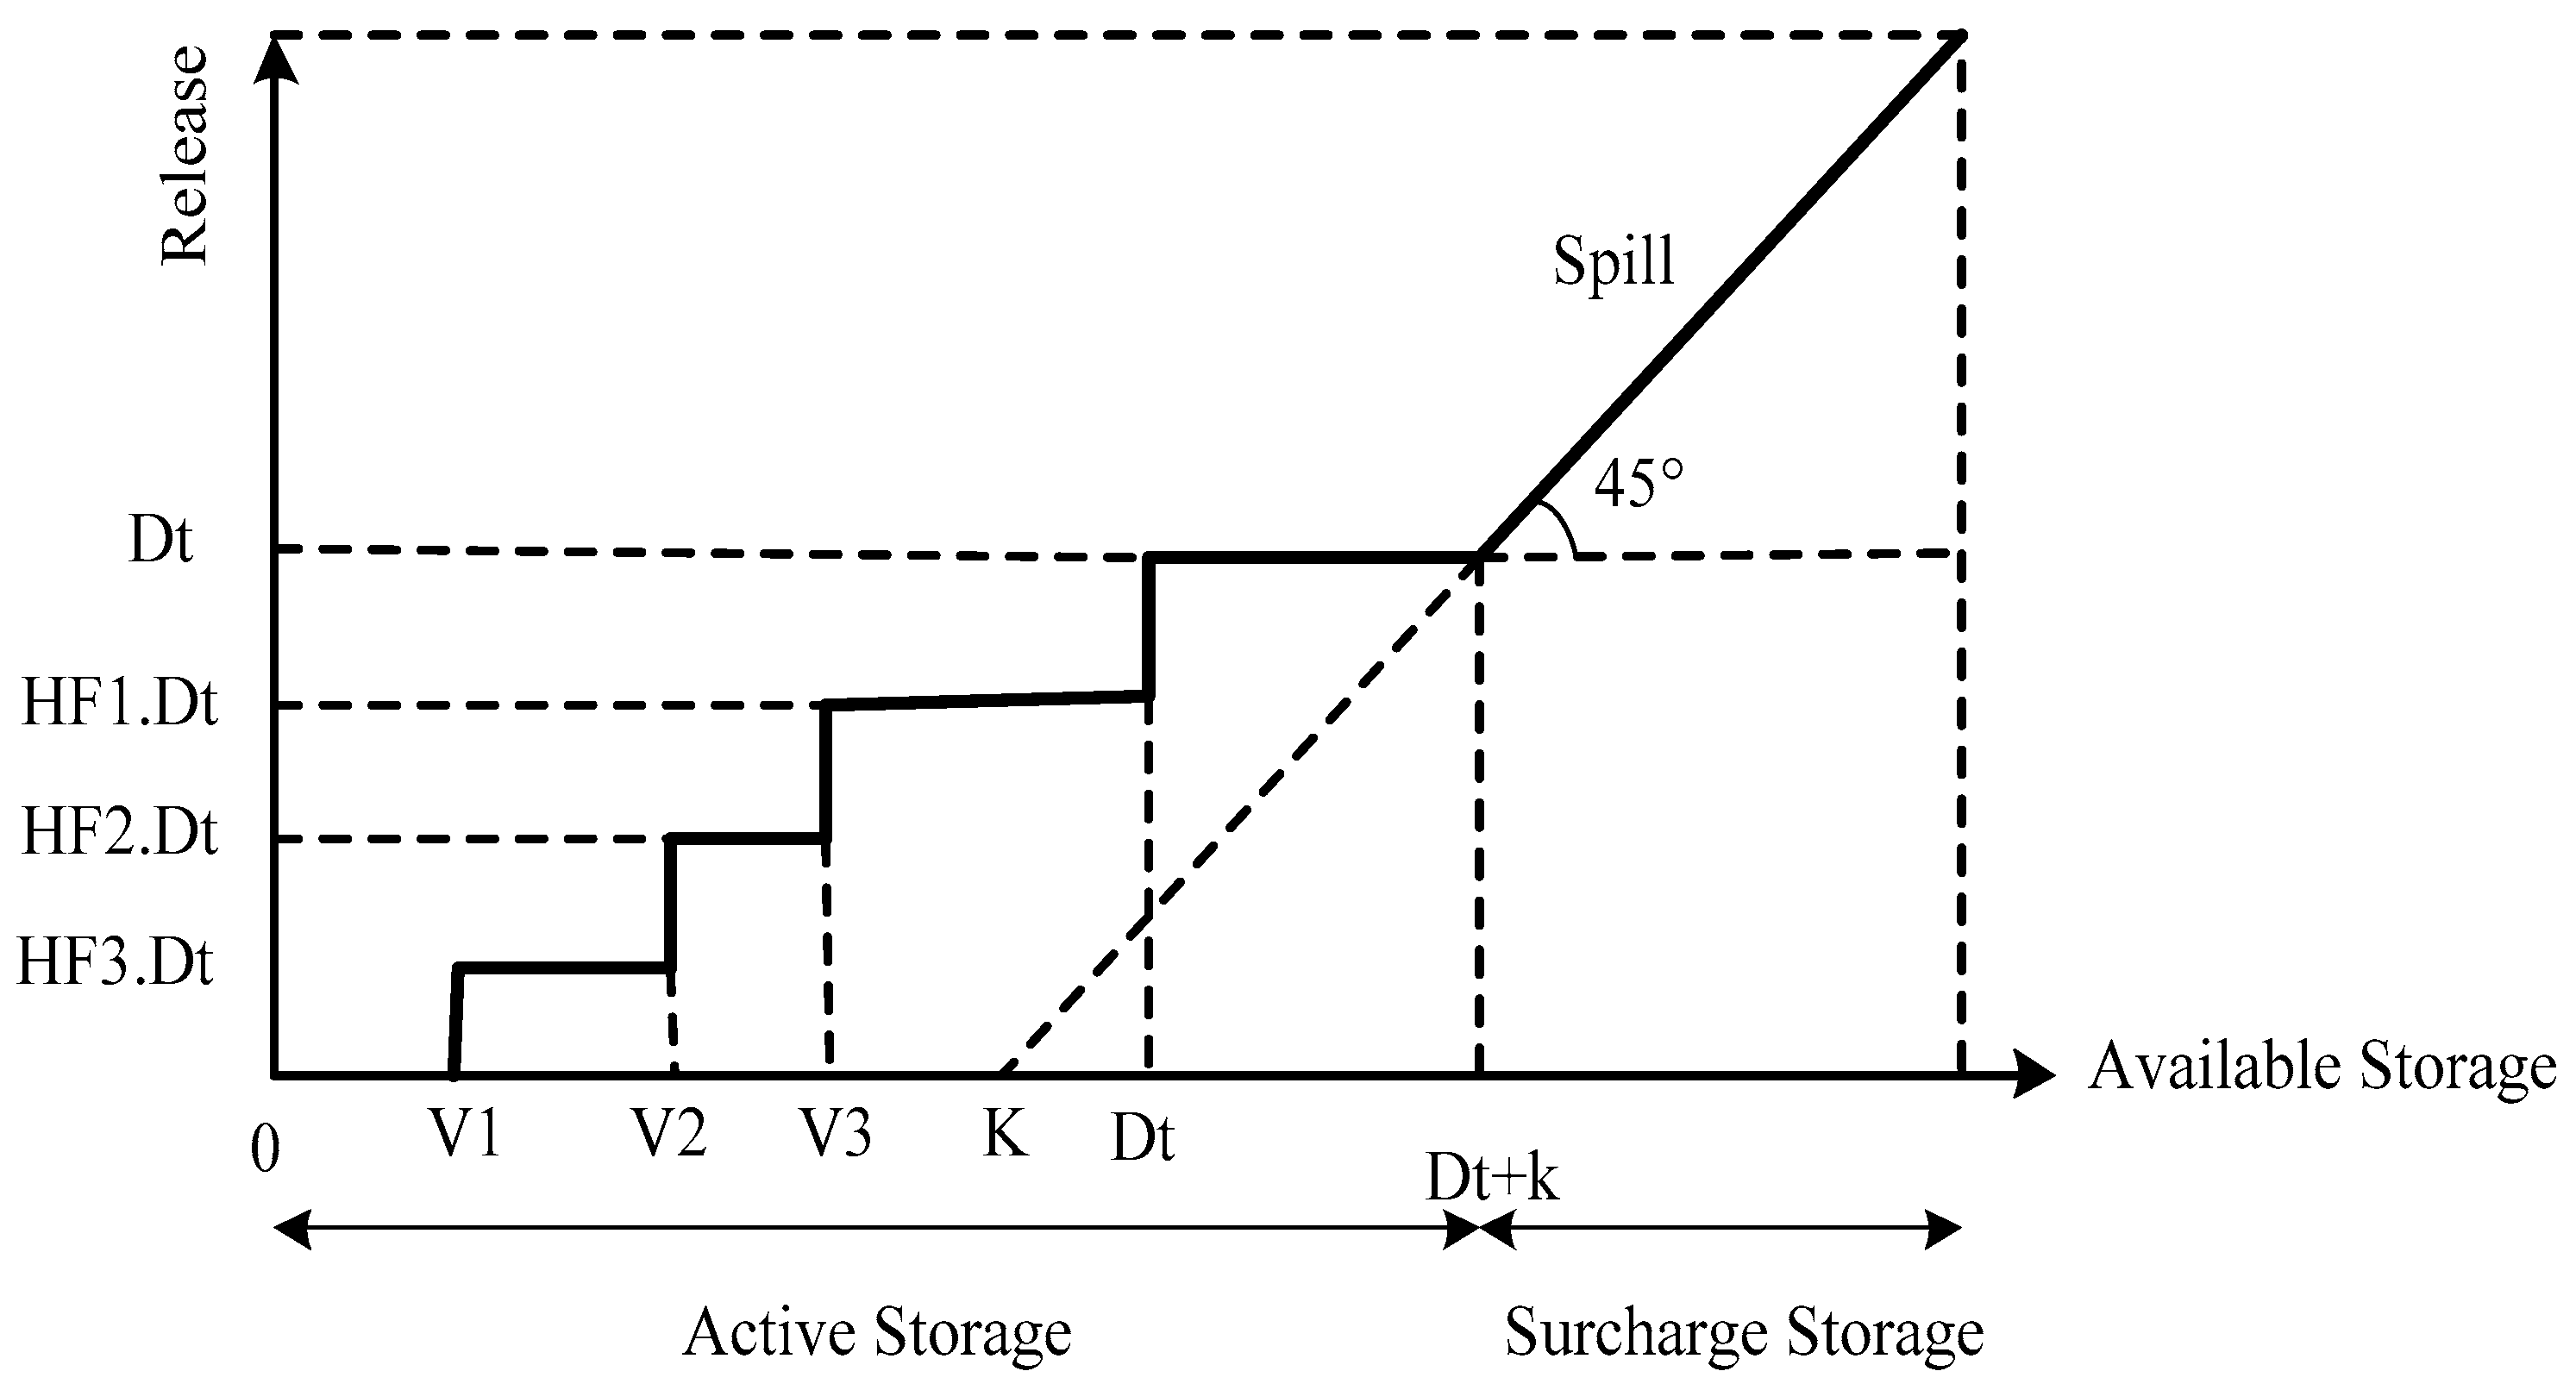
2.3.4. Discrete Hedging Policies (DHP)
To make the hedging policies more practical, another type of hedging, which called the discrete hedging rule was developed. The discrete form of hedging policy is more feasible and practicable since the operators do not usually have an option to release water gradually. Accordingly, water hedging applies in discrete steps. Moreover, it is much easier to explain the rationing to the public in a simple manner [6]. The procedure of DHP is presented in (Figure 6). For each time step, if available storage (WAt) is greater than Dt, available storage could fully satisfy target demand. If WAt is greater than V3 and less than Dt, then the rationing will be happening for the coming time step and only the HF1 of target demand will be provided. If V2 < WAt < V3, the target demand defines as a fraction of HF2. If WAt is greater than V1 but less than V2, then the stage-III of rationing will be occurring and the fraction HF3 of target demand will be discharged. In DHP, it is supposed that the minimum trigger-volume always sustain in a reservoir. The trigger-volumes are determined based on flow regime requirement and amount of demand reduction due to water savings [17]. It is worth noting that in order to determine the optimize DPH policy for any reservoir, if the numbers of discrete steps are assumed three steps, six parameters should be optimized including V1, V2, V3 and HF1, HF2, HF3. V1, V2, and V3 are determined as a coefficient of active storage (K), while HF1, HF2, HF3 are defined as a coefficient of target demand (D). The formulations of water release based on discrete hedging policy are described in Table S1 (DHP).
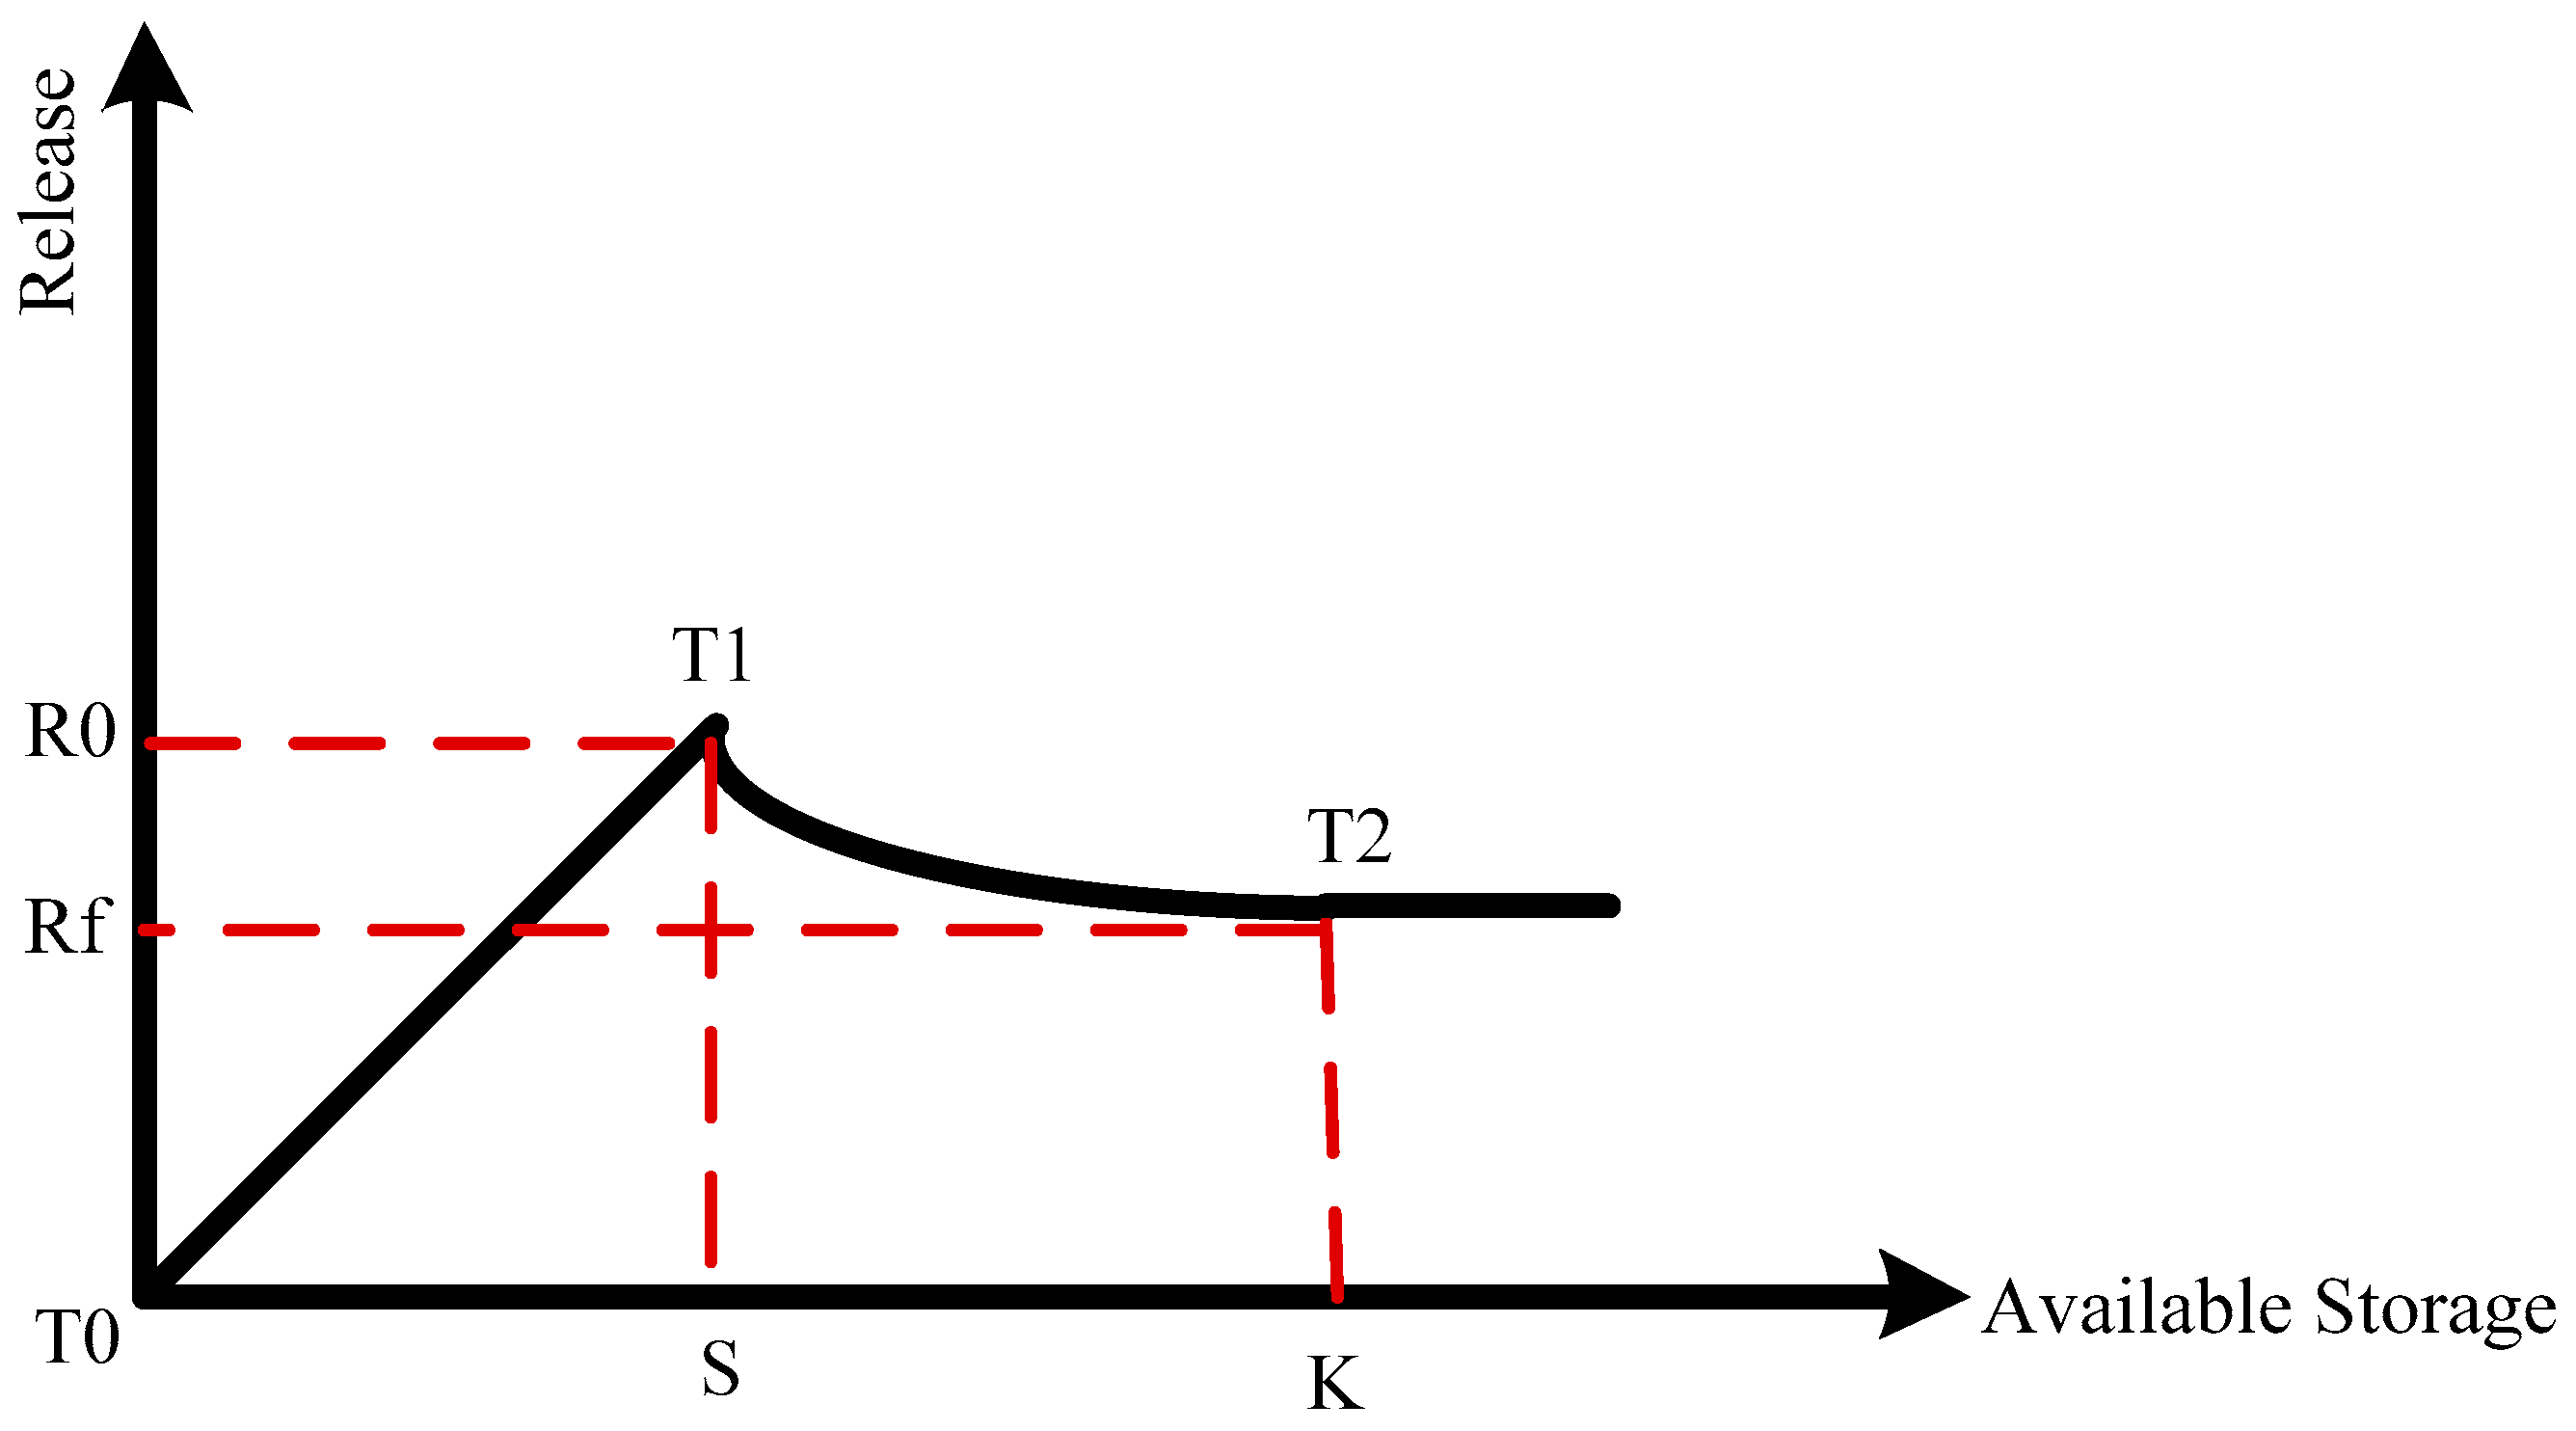
2.3.5. Standard Operating Policy for Hydropower Production (SOPHP)
The overall scheme of standard operating policy for hydropower production (SOPHP) is displayed in Figure 7. The principle discrepancy of exclusive hedging policies for hydropower generation compare to the customary hedging policies is target demand, which is variable. In the case of hydropower operation, the target demand is a function of a head (or storage) and is not fixed. To explain more, assume that the power must be generated in the coming period is named ‘target power’ (TP). Then, the amount of release (R0), which could produce the target power will be specified based on water availability (S). Therefore, the product of mean head (due to S and zero available storage), S and unit weight of water should produce the target power. The S parameter should be estimated or optimized for a specific reservoir based on the relation between head and storage. The mentioned parameters (head and storage) have a non-linear relationship. It means that when stored in the reservoir is more than S, a head is also more and hence a smaller discharge (R < R0) is enough to produce the target power (TP). While, with lower storage, a large quantity of water must be discharged to produce the same power. These explanations prove that the water demand is not constant in a case of hydropower reservoir system and vary by water head (or storage availability). Whenever the reservoir reaches the maximum reservoir elevation, the head cannot increase. Hence, if the water availability is more than D + K, the required release to produce TP will be constant [18]. It can be concluded whether available storage is less than S, the release is the same as available storage. Therefore, the system cannot regenerate the target power. When T1 < WAt < T2, the release is falling due to head increase. If WAt > T2, the release and head become constant (Rf). The formulations of this policy are described in Table S1 (SOPHP). It is worth noting that this policy allows the managers to produce either TP or less. The definitions of parameters used in this policy are as follows:
Where Rt: release at time t, WAt: Water availability at time t, K: active storage, S: minimum required storage to produce target power, Rf: minimum required release to produce target power at a time of maximum net head.
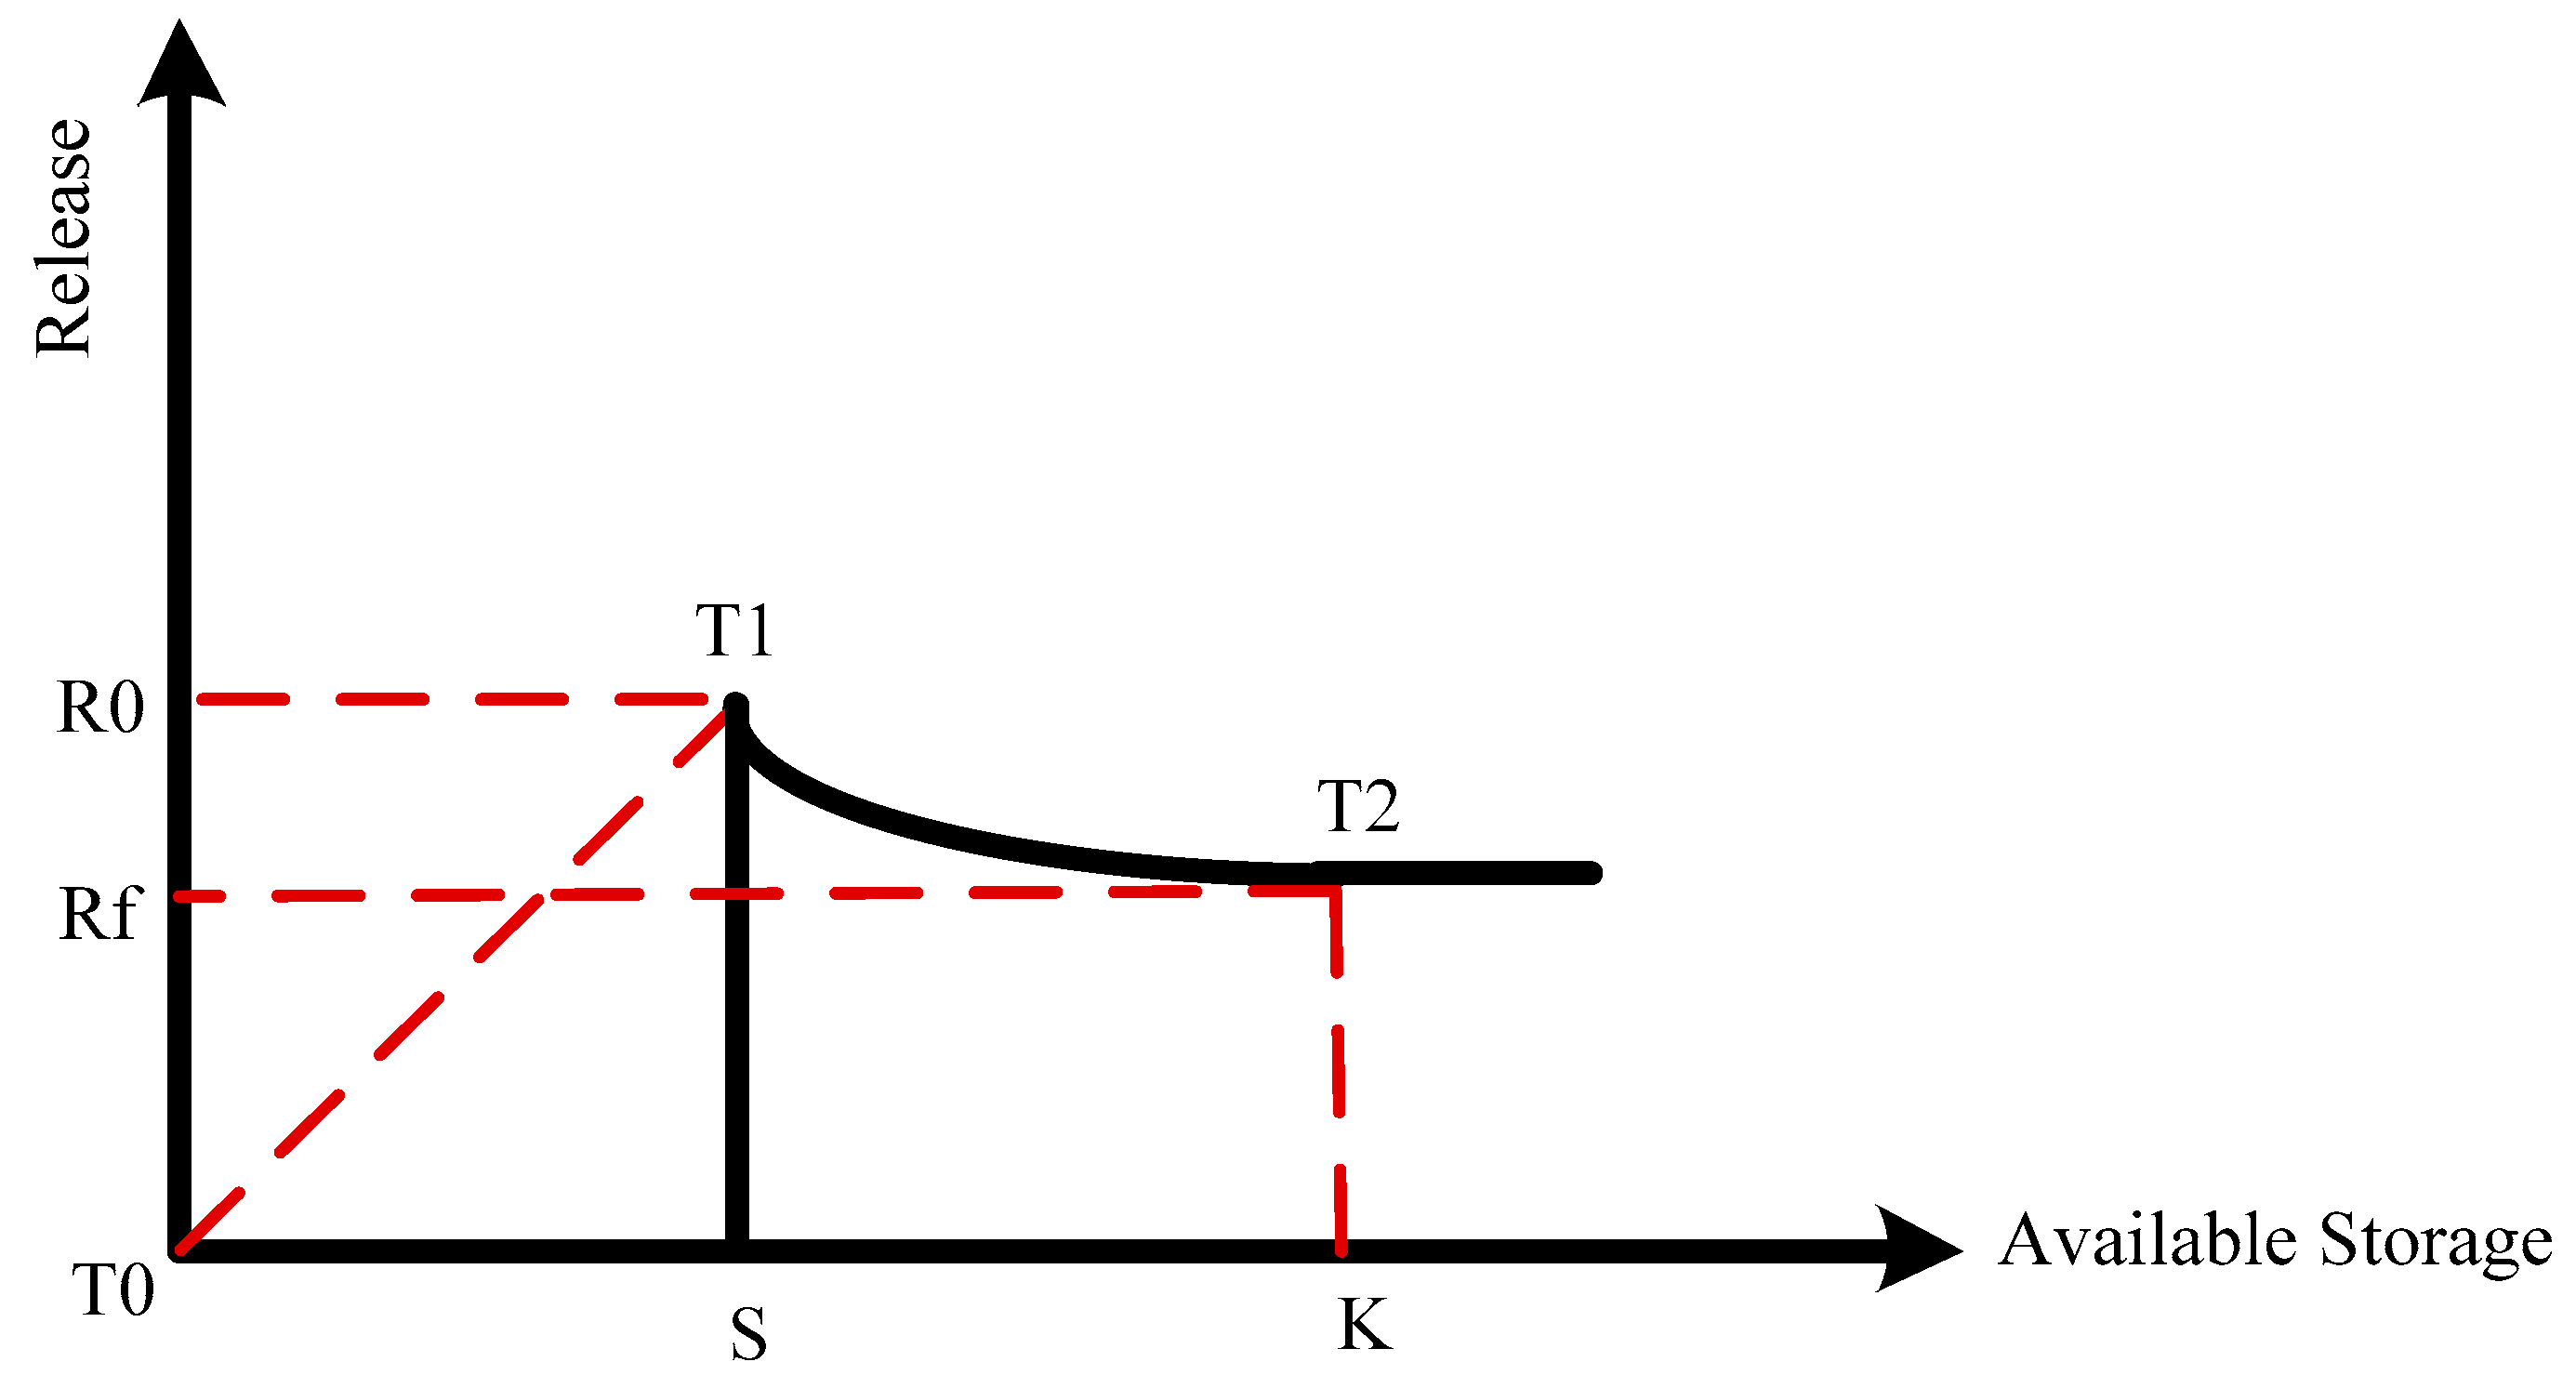
2.3.6. Binary Standard Operating Policy for Hydropower Production (BSOPHP)
The managers usually do not want to release the available water if the system cannot generate the target power and want to keep the water for future use. This decision may be occurred due to economic issues. Since saving the water in the reservoir for future use and add them to the future flows, the water head will be heightened and may economically have more benefits. This scope brings the idea to modify the SOPHP. This rule allows the system to produce only 0 or TP and the production below TP is not permitted (Figure 8). It is considerable to note that in order to shape this policy, the S parameter should be simulated or optimized. The formulations of this policy are expanded in Table S1 (BSOPHP).
2.3.7. Standard Hedging Policy for Hydropower Production (SHPHP)
Using more than one turbine is ordinary in a hydropower reservoir system [11]. When available-storage is not adequate to produce target power, it is economical to utilize fewer turbines with full discharge load rather than partial discharge in all turbines. Assume that there is a hydropower reservoir system with four turbines with the same power capacity. Therefore, each turbine can only produce 25% of full capacity. The form of standard hedging policy for hydropower production (SHPHP) indicates in Figure 9. To clarify more, S1 is the quantity of available-water to produce 25% of the full capacity and S2 is equal the amount of water to produce 50% of the full capacity. If WAt < S1, no turbine is running for operation and output of power is zero. If the available water is between S1 and S2, only one turbine can be employed in generation, which means the power production is 25% of full capacity. Whenever S1 < WAt < S2, the amount of release to produce (1/4) full capacity will decrease as the head increases. Meanwhile, the release rule has a curve from. A similar strategy is applied for S3 and S4. S3 and S4 are the quantity of available water to produce 75% and 100% of the full capacity respectively. If S2 < WAt < S3, two turbines utilize, which means the power production is equal to half full capacity. If the S3 < WAt <S 4, three turbines use for the operation to produce 75% of full capacity. If the WAt ≥ S4, four turbines are operated to produce 100% full capacity. Furthermore, beyond full reservoir capacity (K), the head is constant. Therefore, the release is only a function of available water and the line beyond T5 is a constant line. It is worth noting that the slope of the line which connecting T0, T1, T2, T3, and T4 is 45°. Moreover, the number of decision variables or optimization parameters in this policy depend on the number of turbines. In the above example, the system has four turbines. Therefore, four parameters—including S1, S2, S3, and S4—should be simulated or optimized. The formulations of water release are expanded in Table S1 (SHPHP).
2.4. Objective Function and Constraints
There are many objective functions were used by researchers in a case of optimizing hydropower reservoir systems. For example, Bozorg Hadad [19] tested the applicability and performance of the innovative honey-bee mating optimization in both single reservoir and multi-reservoir, to minimize the total present net cost of the system, while achieving the maximum possible ratio for generated power to installed capacity. Jahandideh-Tehrani [20] investigated the performance of hydropower production by reservoirs with and without climate change impacts on river discharge in the Khersan 1, Karoon 4, and Karoon 3 reservoirs in Iran. Reservoir systems were optimized to calculate hydropower production over the present and future times. The objective function is defined as the sum of squared differences between installed capacity of power plant and power generation. Brandao [21] investigates two methods in multi-reservoir hydroelectric system for power maximization considering individual reservoir characteristics without simplifications. Accordingly, in this research, maximizing the total power generation in an operational period is chosen as an objective function, while all physical and operational constraints are considered. This objective is expressed as a constrained nonlinear optimization problem as
- Gt: energy production in time t (kWh)
- η0: efficiency of the hydropower plant
- γ: the specific weight of water (9.81 kN/m3)
- rt: the discharge in a time interval (m3/s)
- Ht: average net head in a time interval
- t: shows the duration of release (h)
It is worth noting that Rt, which is used in the formulas such as hedging rules formulation, can be determined Rt = rt × t. In addition, the objective function must be satisfied with the following constraints during the optimization.
2.4.1. Hydro Plant Discharge Limits
After specifying the release based on hedging rules in each time step, the number of releases (Rt) must be placed in an allowable range.
Rmin ≤ Rt ≤ Rmax
Rmin is defined as the minimum permissible release and maximum permissible release (Rmax) is specified according to full capacity turbines and a capacity of diverting tunnel in a hydropower reservoir system, which is 20.5 m3/s
2.4.2. Water Balance Equation
According to Shiau (2009), after determining reservoir release, reservoir storage at the beginning of the subsequent time interval can be calculated using the water balance equation.
where, St: storage at time t, St−1: storage at time t − 1, It: inflow at time t, Et: evaporation at time t, Rt: release at time t, SPt: spill at time t.
St = St−1 + It − Et − Rt − SPt
2.4.3. Reservoir Storage Volumes
The volume of storage or water available in each time step must be placed in an allowable range.
where Smin: storage volume at minimum water level (1.6 Mm3) and Smax: storage at maximum operating level (2.8 Mm3).
Smin ≤ St ≤ Smax
2.4.4. Hydro Plant Power Limits
The amount of power generation in each time step must be placed between allowable ranges.
where, Gmin: minimum values of energy generation (0), Gmax: maximum values of power generation (150 MW). The mentioned parameters are determined based on turbine capacity (150 MW).
Gmin ≤ Gt ≤ Gmax
2.5. Optimization Algorithms
In order to find the optimal decision variables in each hedging policy, the constructed model should be linked to the optimization algorithm. Accordingly, three algorithms namely particle swarm optimization (PSO), genetic algorithm (GA), and their combination which is called hybrid PSO-GA were used and investigated in this research. Since the application of PSO and GA were widely used by researchers to figure out the global optimization, the details of standard PSO and GA were not discussed in this research and more details can be found in the published literature [22,23].
Both PSO and GA are population-based algorithms and mostly used to optimize complex systems [24]. Both algorithms have pros and cons. Studies declare that the main demerit of PSO is its weakness to find the global optimum and it usually converges prematurely and involves the local optimum (constant point), which is not necessarily maximum. While the merit of GA over PSO is the ability to control convergence, because GA operators such as mutation and crossover could effectively influence GA convergence. GA is so sensitive to the initial population, which whether the initial population is not selected well, the algorithm cannot coverage to the global optimum [25]. Garg compared the results of hybrid PSO-GA with PSO and GA [26]. In hybrid PSO-GA, the direction of PSO is to improve the vector, meanwhile, GA has been applied to modify the decision vectors by using its operators. Furthermore, the balance between exploration and exploitation abilities have been much better by synthesizing the GA operators such as crossover and mutation in the PSO algorithm. The experimental results show that the hybrid found better solutions compare to default algorithms [27,28]. In the present research, the main objective is to optimize the decision variables in different types of hedging policies to find the optimum solution. The main reason behind using a hybrid algorithm is to use the merits of both PSO and GA simultaneously. In order to avoid the local optimum, position update of the global best particles is changed. The position update is done through some hybrid mechanism of GA. The idea behind incorporating GA with PSO is to use genetic operator’s crossover and mutation. By applying crossover operation, information can be swapped between two particles to have the ability to fly to the new search area. The purpose of applying mutation to PSO is to increase the diversity of the population and the ability to have the PSO to avoid the local maximum [29]. The hybrid PSO-GA flowchart is presented in Figure 10.
3. Results
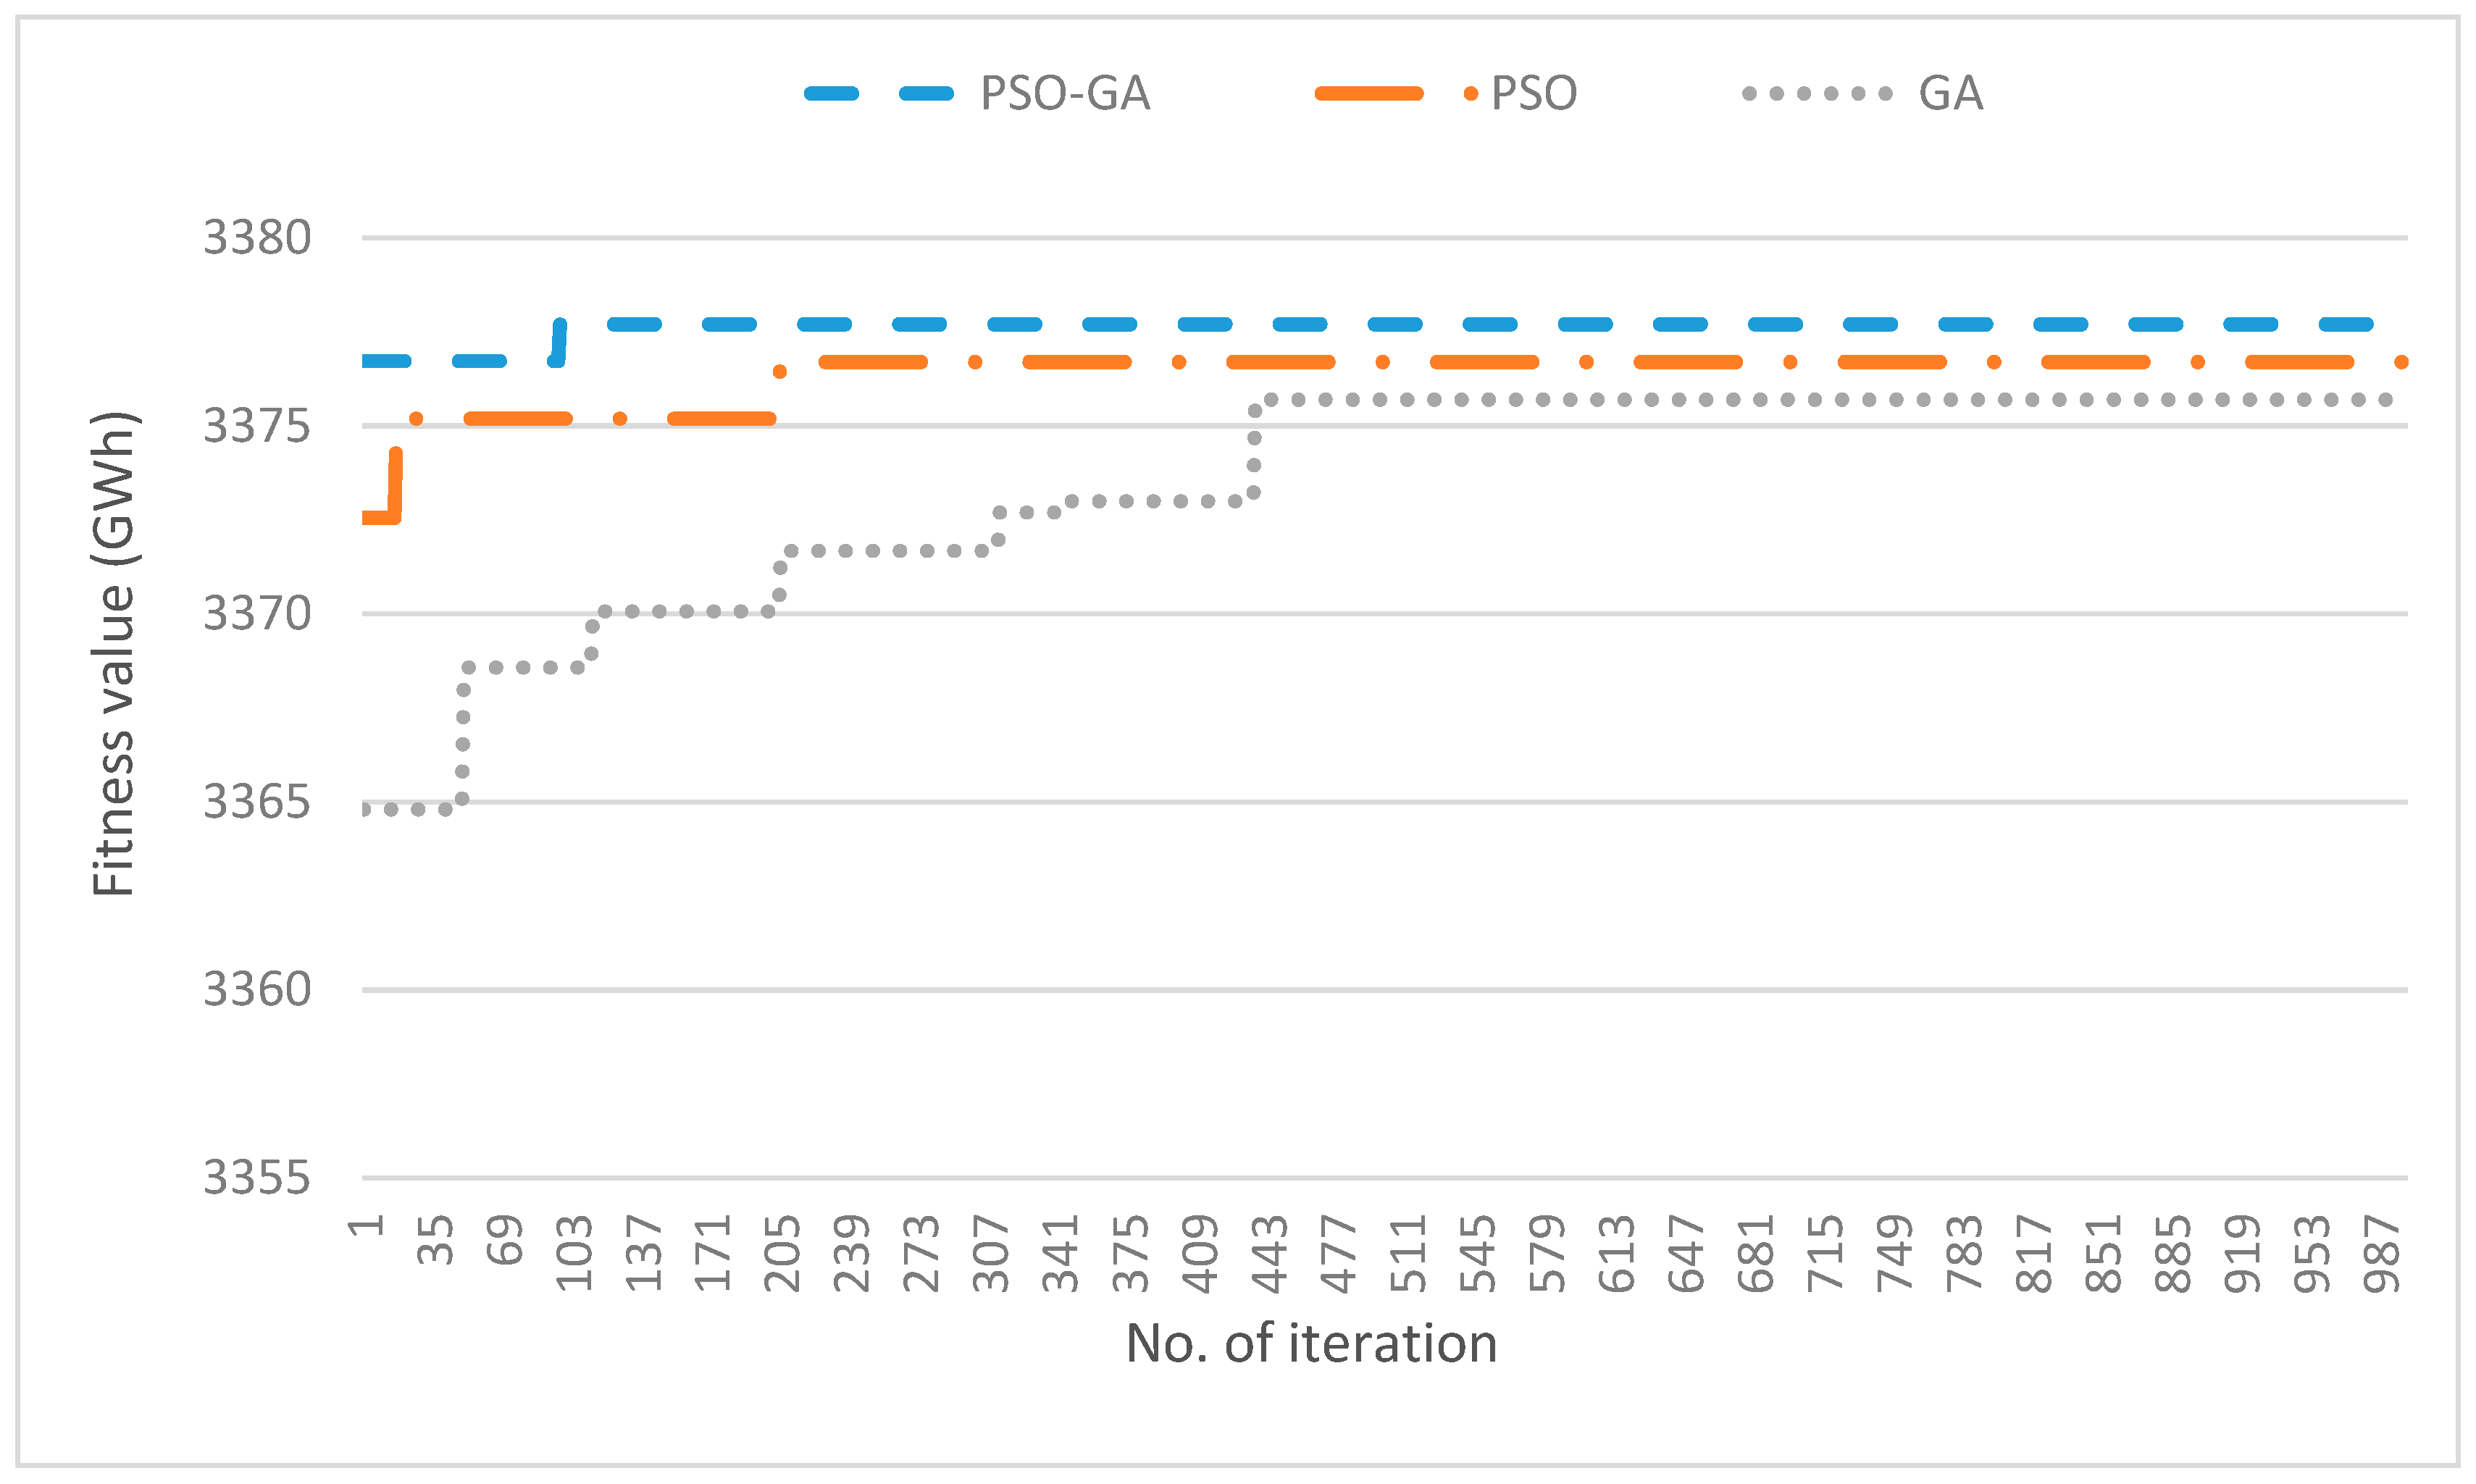
In order to choose the best algorithm among PSO, GA, and hybrid PSO-GA, the algorithms were linked to one of the constructed model (1PHP), in order to find the most effective optimization technique. Results of comparison showed that the hybrid PSO-GA can simultaneously find the promising solution and speeding up the convergence (Figure 11). Based on the given results, the hybrid PSO-GA algorithm found the highest fitness value in a lower number of iterations, which demonstrated the superiority of the hybrid optimization algorithm compared with PSO or GA. Based on this, the proposed algorithm (PSO-GA) was used in this research to optimize other constructed hedging policies
The flow diagram of the present study is summarized in Figure 1. The diagram includes four main processes and these are data collection, reservoir operation models and optimization, output results, and analysis of results. At first, daily stream flow, evaporation, water demand data from 2003 to 2012, and also water elevation-reservoir storage curve were collected. In order to construct and validate the model, the available data were divided in two groups. The data from 2003–2009 (70% of data) were used to construct the operational policies models namely, 1PHP, 2PHP, 3PHP, DHP, SOPHP, BSOPHP, and SHPHP models, while the data from 2010–2012 (30% of data) were used to validate the constructed models.
The mentioned policies have some constraints such as hydro plant discharge limits, water balance equation, reservoir storage volumes, and hydro plant power limits, which are defined based on the characteristics of BPHS system. These constraints should be satisfied during the model optimization. The model constraints are not different (same constraints), while the principal difference among the operating policies is the determination of release constraints based on various hedging policies.
The models were constructed using MATLAB and in order to find the best solution (maximum power generation), optimization algorithm is used for this purpose. Accordingly, the constructed models are linked to hybrid PSO-GA. The hybrid PSO-GA was used in water resources management particularly for finding optimum release from impounding reservoirs [23,28]. Also, it is used for constrained optimization problems including global maximization [22,26]. However, in this study, it is used for maximization of monthly power generation.
Based on the rules of each policy and optimal decision variables, the characteristics of the Jor reservoir system during 3003–2009 was determined. The output result is summarized in Table 1. For SOPHP and BSOPHP policies, the S point is optimized. In both operational policies, the S point was found to be 2,465,523 m3. This similarity shows that in a case of optimization, SOPHP is converted to (binary SOPHP). To clarify further, it seems that when the SOPHP model was optimized, the system allows to produce only 0 or target power (TP) and the production below TP is not permitted. So, SOPHP and BSOPHP policies will be the same. According to the characteristics of the SIPS station (which comprises three turbines), the number of decision variables in SHPHP policy is three. These variables are S1, S2, and S3. The constraints of S1 < S2 < S3 is also considered in the process of optimization.
These parameters S1, S2, and S3 were found 2,085,195; 2,203,957; and 2,318,751 m3 respectively. It means that when the available storage is less than 2,085,195 m3, there is no power output. When the available storage is between 2,085,195 and 2,203,957 m3, only one turbine with the capacity of 50 MW was working. When the available storage is between 2,203,957 and 2,318,751 m3, two turbines comprised in operation. Finally, if the available storage is more than 2,318,751 m3, all turbines with total capacity of 150 MW participate in power production.
Another form of hedging policy is continuous hedging policies, which comprise of three types such as as 1PHP, 2PHP, and 3PHP. Sa in 1PHP, Sa and Sb in 2PHP, and Sa, Sb, and Sc in 3PHP are decision variables, which were optimized. The additional constraint during the optimization process is employed in 2PHP, which is Sa < Sb and in a case of 3PHP is Sa < Sb < Sc.
At last, the results of discrete hedging policy was given. The numbers of steps are optional. In this research, three discrete steps were assumed. There are six decision points in this research, which must be optimized. Three of them are in X-axis including V1, V2, and V3 (volume of water availability) at fist and the end of steps, which were found 1,714,985; 2,451,289; and 2,463,421 respectively. The other three decision points are in Y-axis including HF1, HF2, and HF3 (coefficient of target demand), which were found 0.519, 0.868, and 0.961.
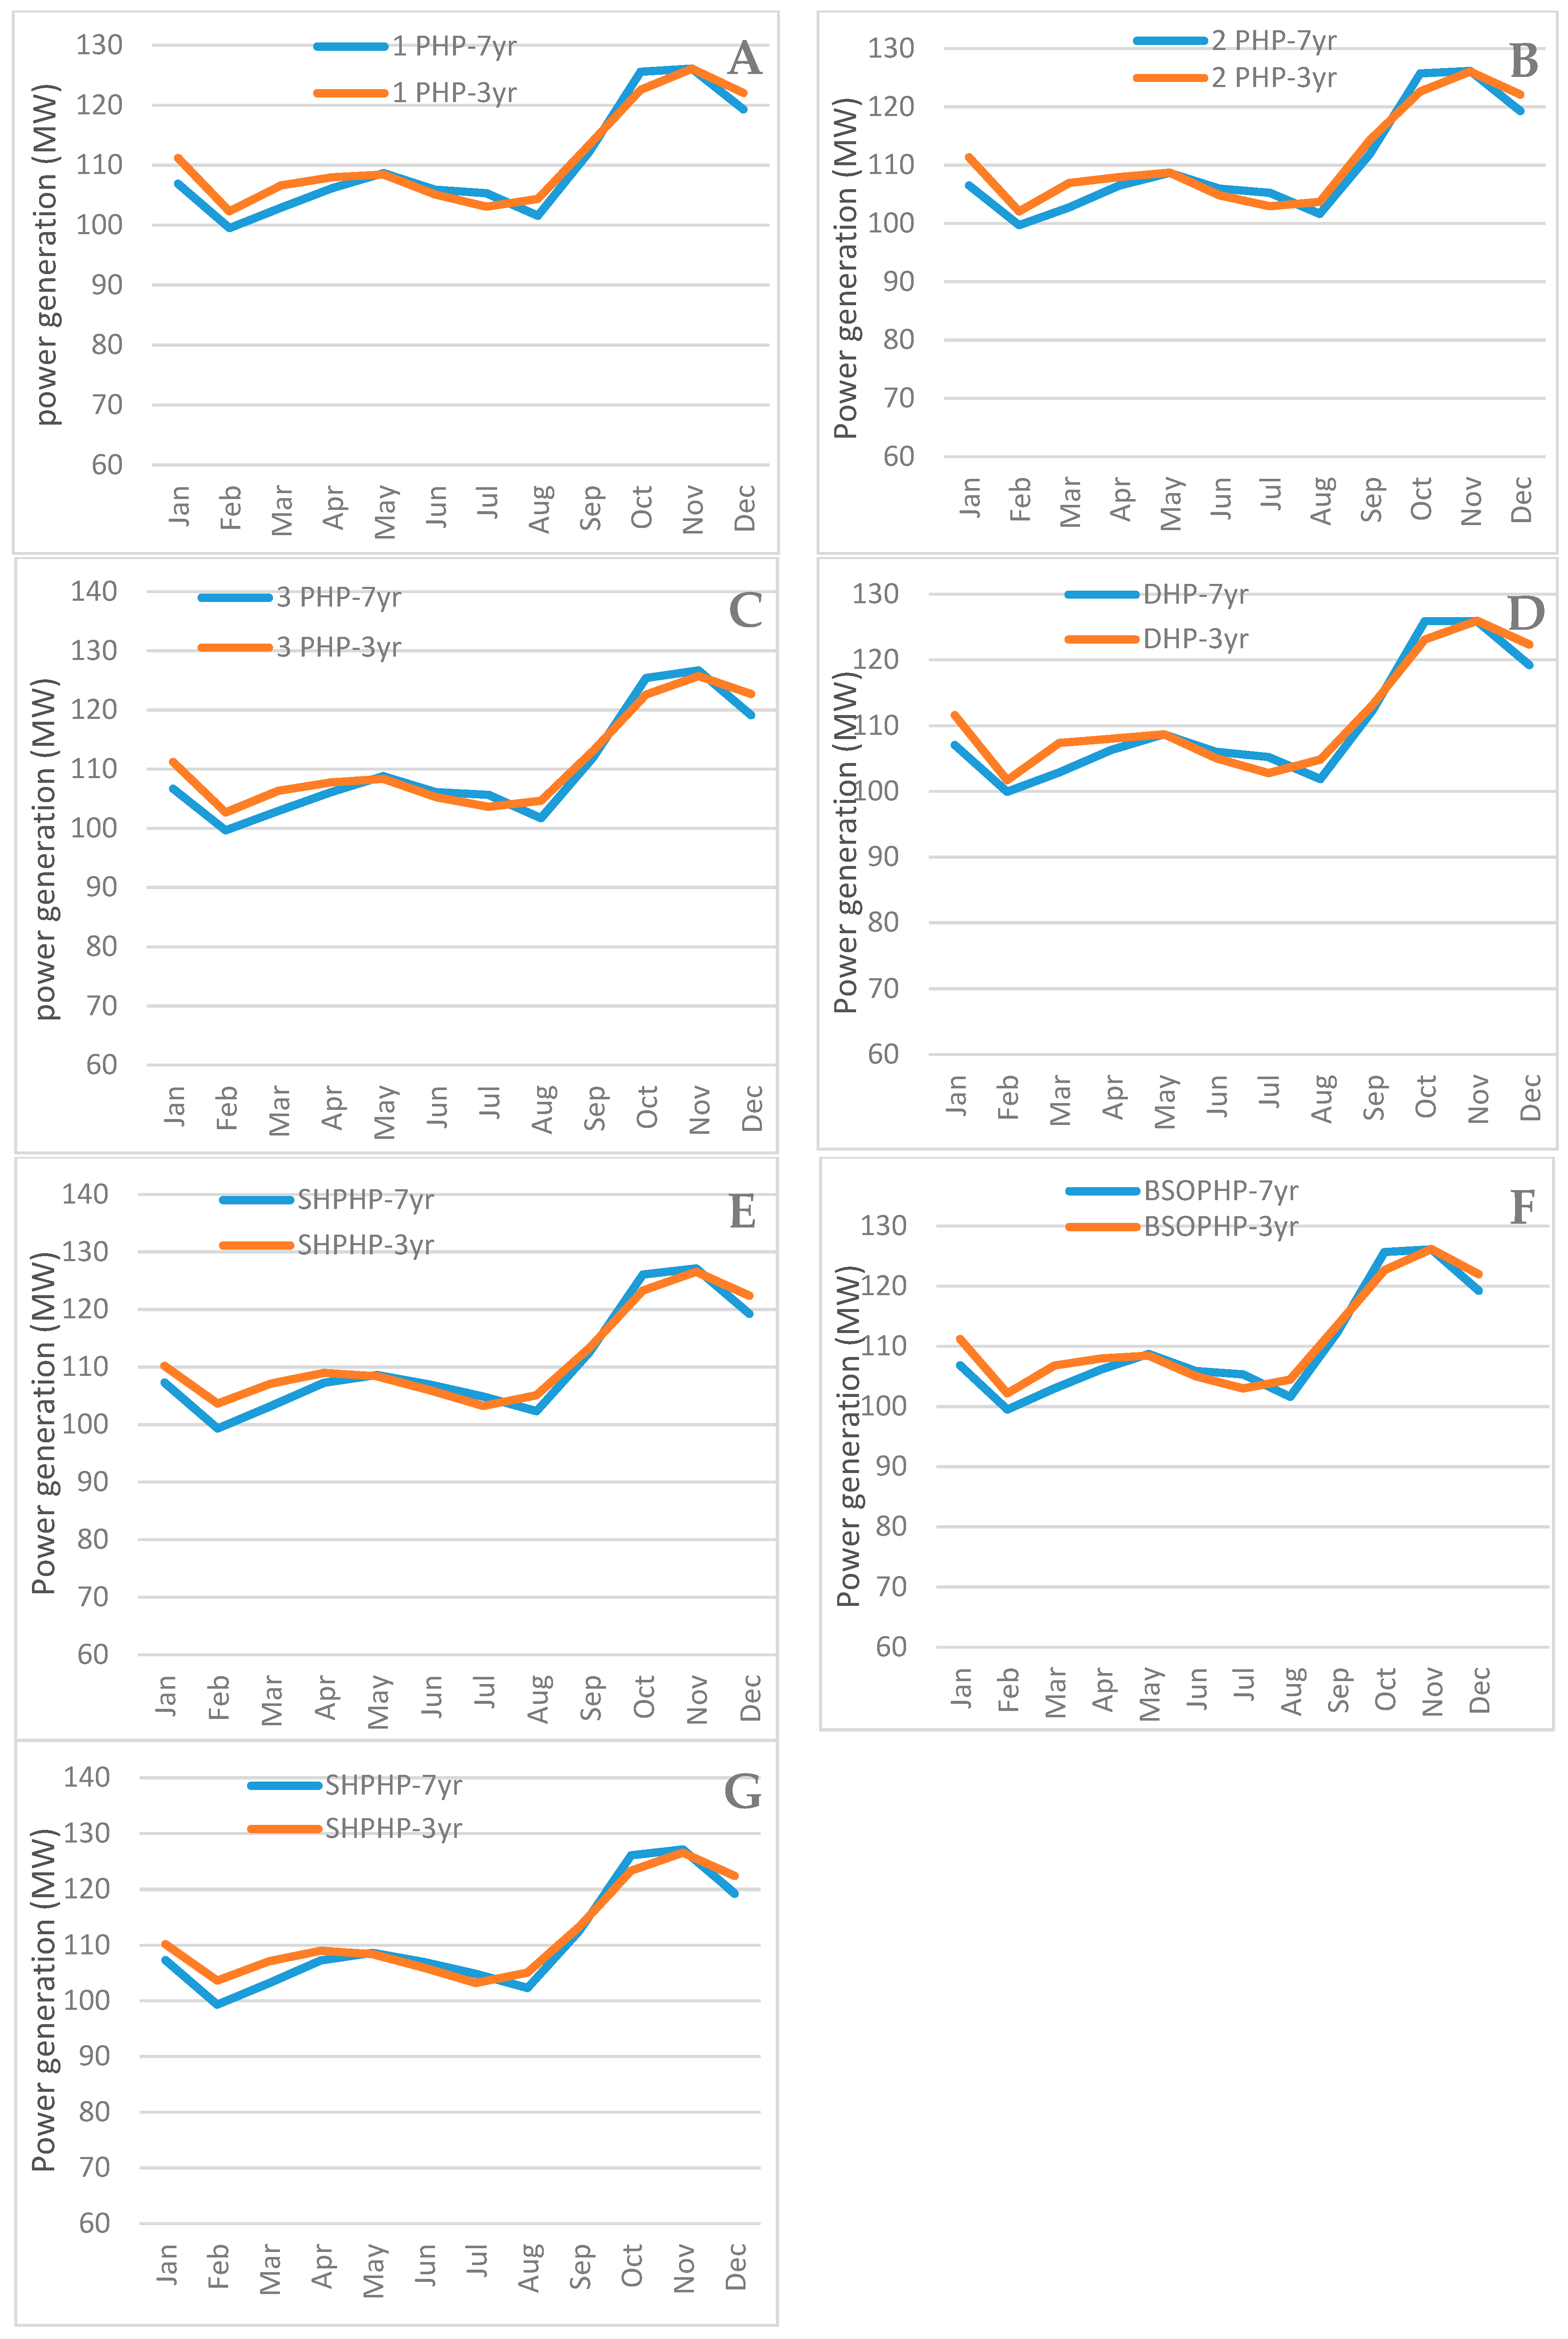
Whenever the optimal points in each model were found, the optimized hedging policies should be validated. Accordingly, the measured monthly mean power generation (MW) using data from 2003–2009 (period used for model construction) were compared with the predicted monthly mean power generation (MW) using the data from 2010–2012 and the comparisons are shown in Figure 12. The comparisons were made with seven models namely, 1PHP, 2PHP, 3PHP, DHP, SOPHP, BSOPHP, SHPHP and selected results are demonstrated in Figure 12. Also, model tests showed that there is no significant difference between the predicted and measured monthly mean power generations.
4. Discussion
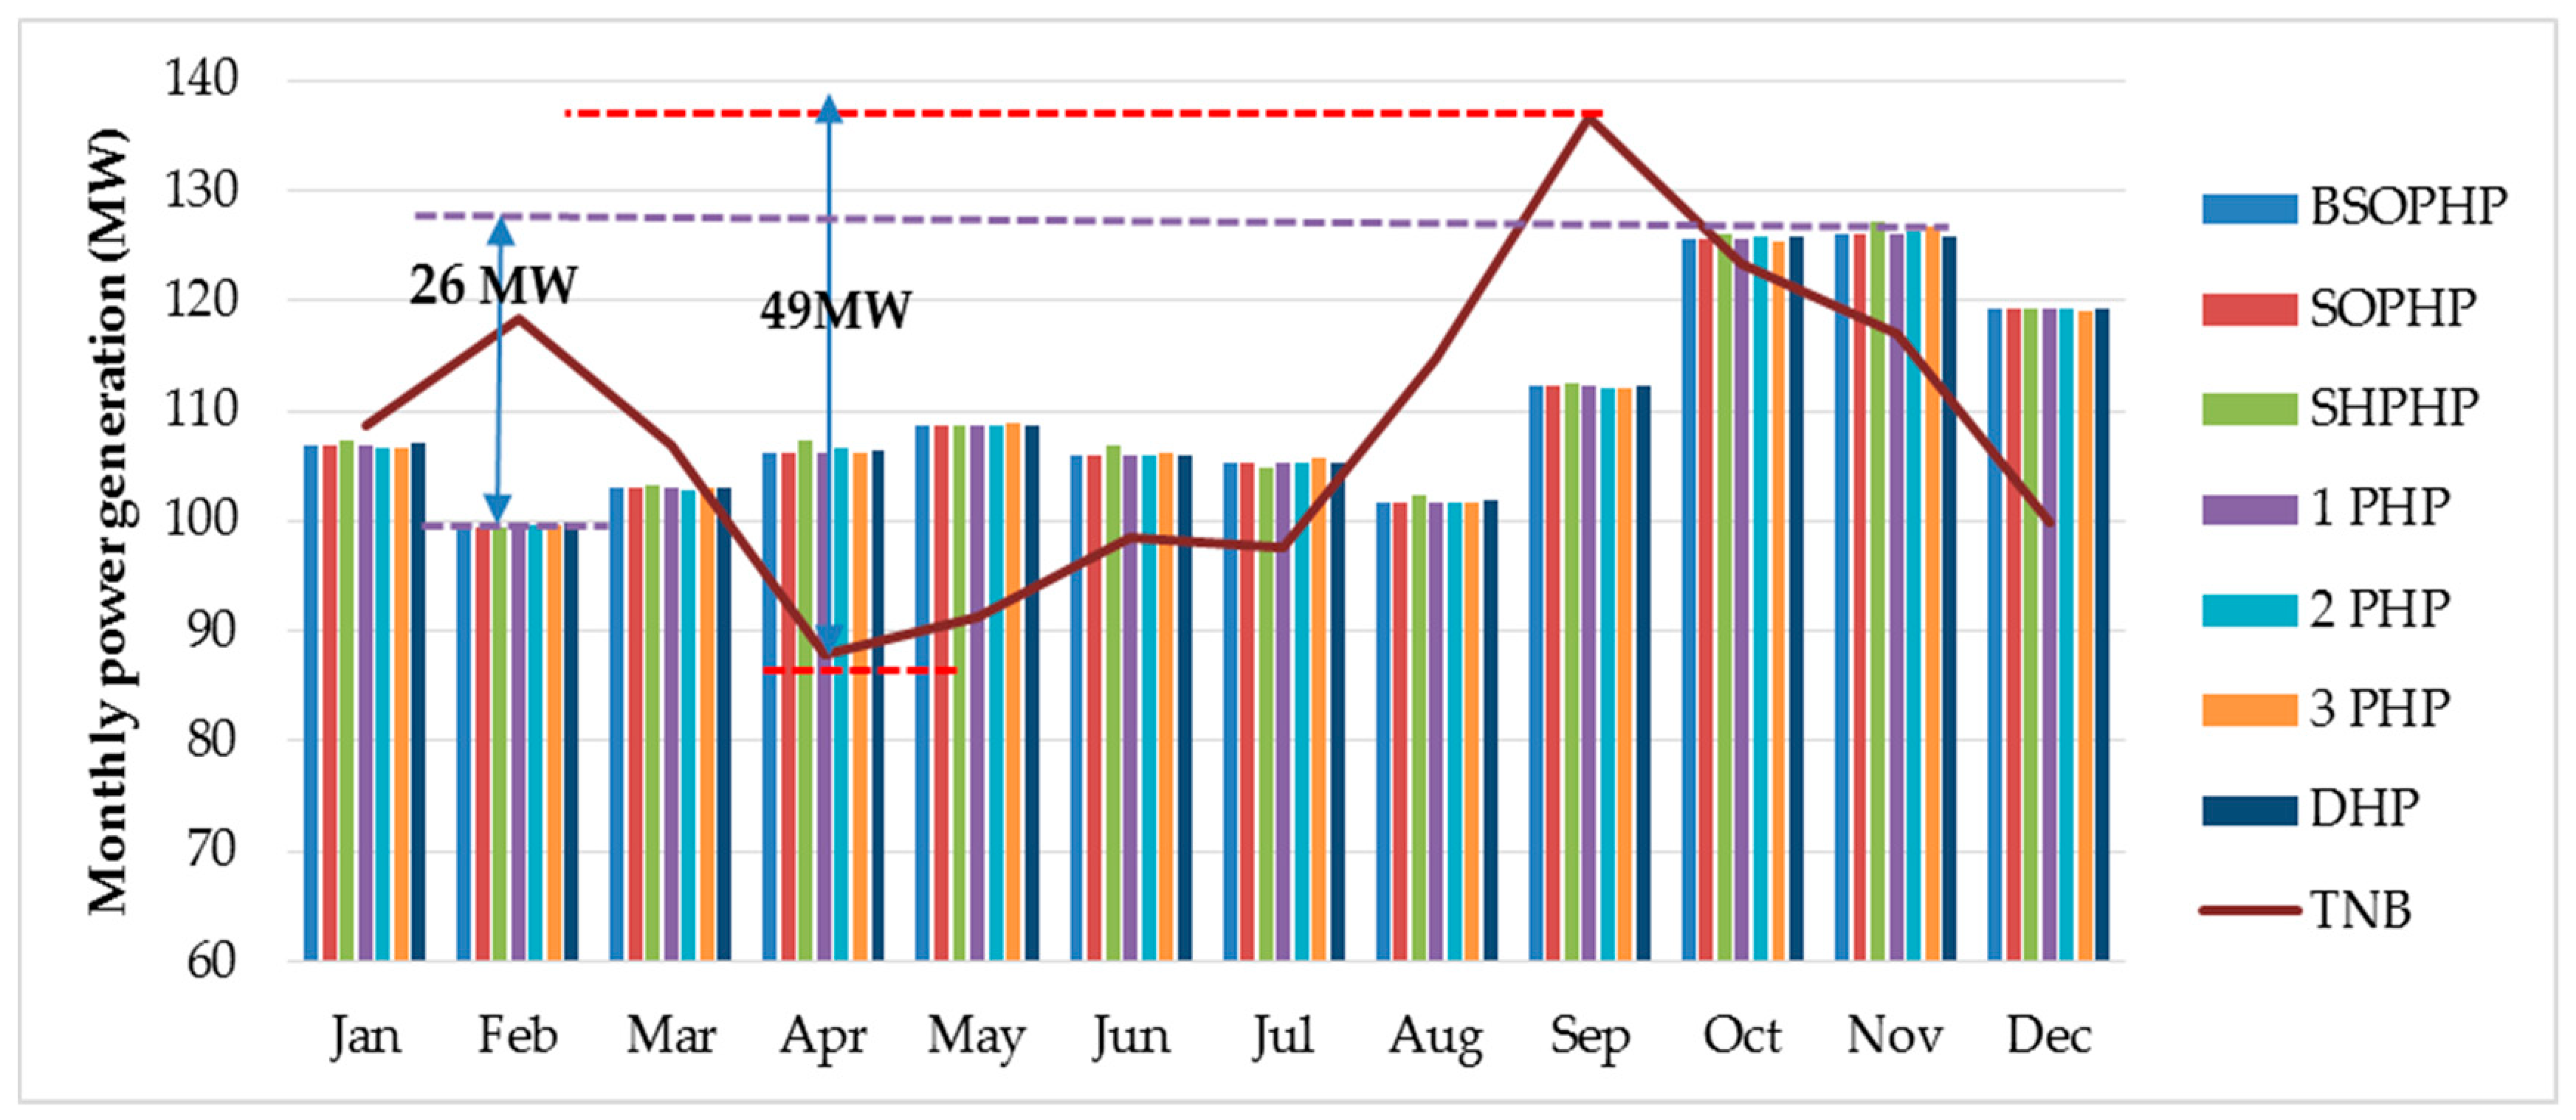
The output of monthly mean power by using optimal operating policies and also Tenga Nasional Berhad (TNB) operation (Current operation policy) is shown in Figure 13. The results indicated that the discrepancies of power generation output between highest (Nov) and lowest (Feb) months are around 26 (100–126 MW), while difference between highest and lowest (Apr) is about 49 (87–136 MW) by applying TNB (current operation), which is almost double. Therefore, it can be concluded that the operation of the reservoir by using hedging policies decrease the vulnerability of the system by avoiding the sharp variation [30]. Chiamsathit used optimal hedging policies for the operation of Ubonratana Reservoir in Thailand. The output results showed that the vulnerability was significantly reduced by using the optimized hedging rules [31].
Moreover, the main merit of hedging policies is to distribute the water supply in a whole year to decrease the severe shortage in dry periods. The highest and lowest monthly value of power generation by using TNB operation is occurred in September and April, respectively, While by applying hedging policies, the highest and lowest were generated in November and February respectively. The obtained results prove that hedging policies could scatter the water supply. Tu [32] applied an optimal hedging rule for the operation of the multi reservoir system in southern Taiwan. The results show that the optimized new hedging rules improve the efficiency of reservoir operations by distributing the water supply.
The analysis results of mean and total power generation by using the various form of hedging policies were summarized in Table 2 and compared with Tenaga Nasional Berhad (TNB) operation (present policy). According to the given result, the amount of mean power generation (and also total power generation) in BSOPHP and SOPHP are the same, which declare that in the terms of optimization, both policies showed the same behavior and SOPHP converted to BSOPHP and kept the water until they could produce the target power. Moreover, the mean power generation by using proposed policies can be increased by 5% compared with TNB operation (1,267,158 kWh), while the amount of total power generation from 2003 to 2009 indicated 13% increment in power output in all policies compared to current policy (TNB), with the amount of 2938.60 GWh. This increment causes economic growth, which is important for raising living standards in this area. The output analysis of total power generation indicated that the highest amount of power generation is obtained by SHPHP with 4856.508 GWh power production. According to the output of total power generation, DHP, 3PHP, 2PHP, 1PHP, BSOPHP, and SOPHP are placed in the second, third, fourth, fifth, and sixth places respectively.
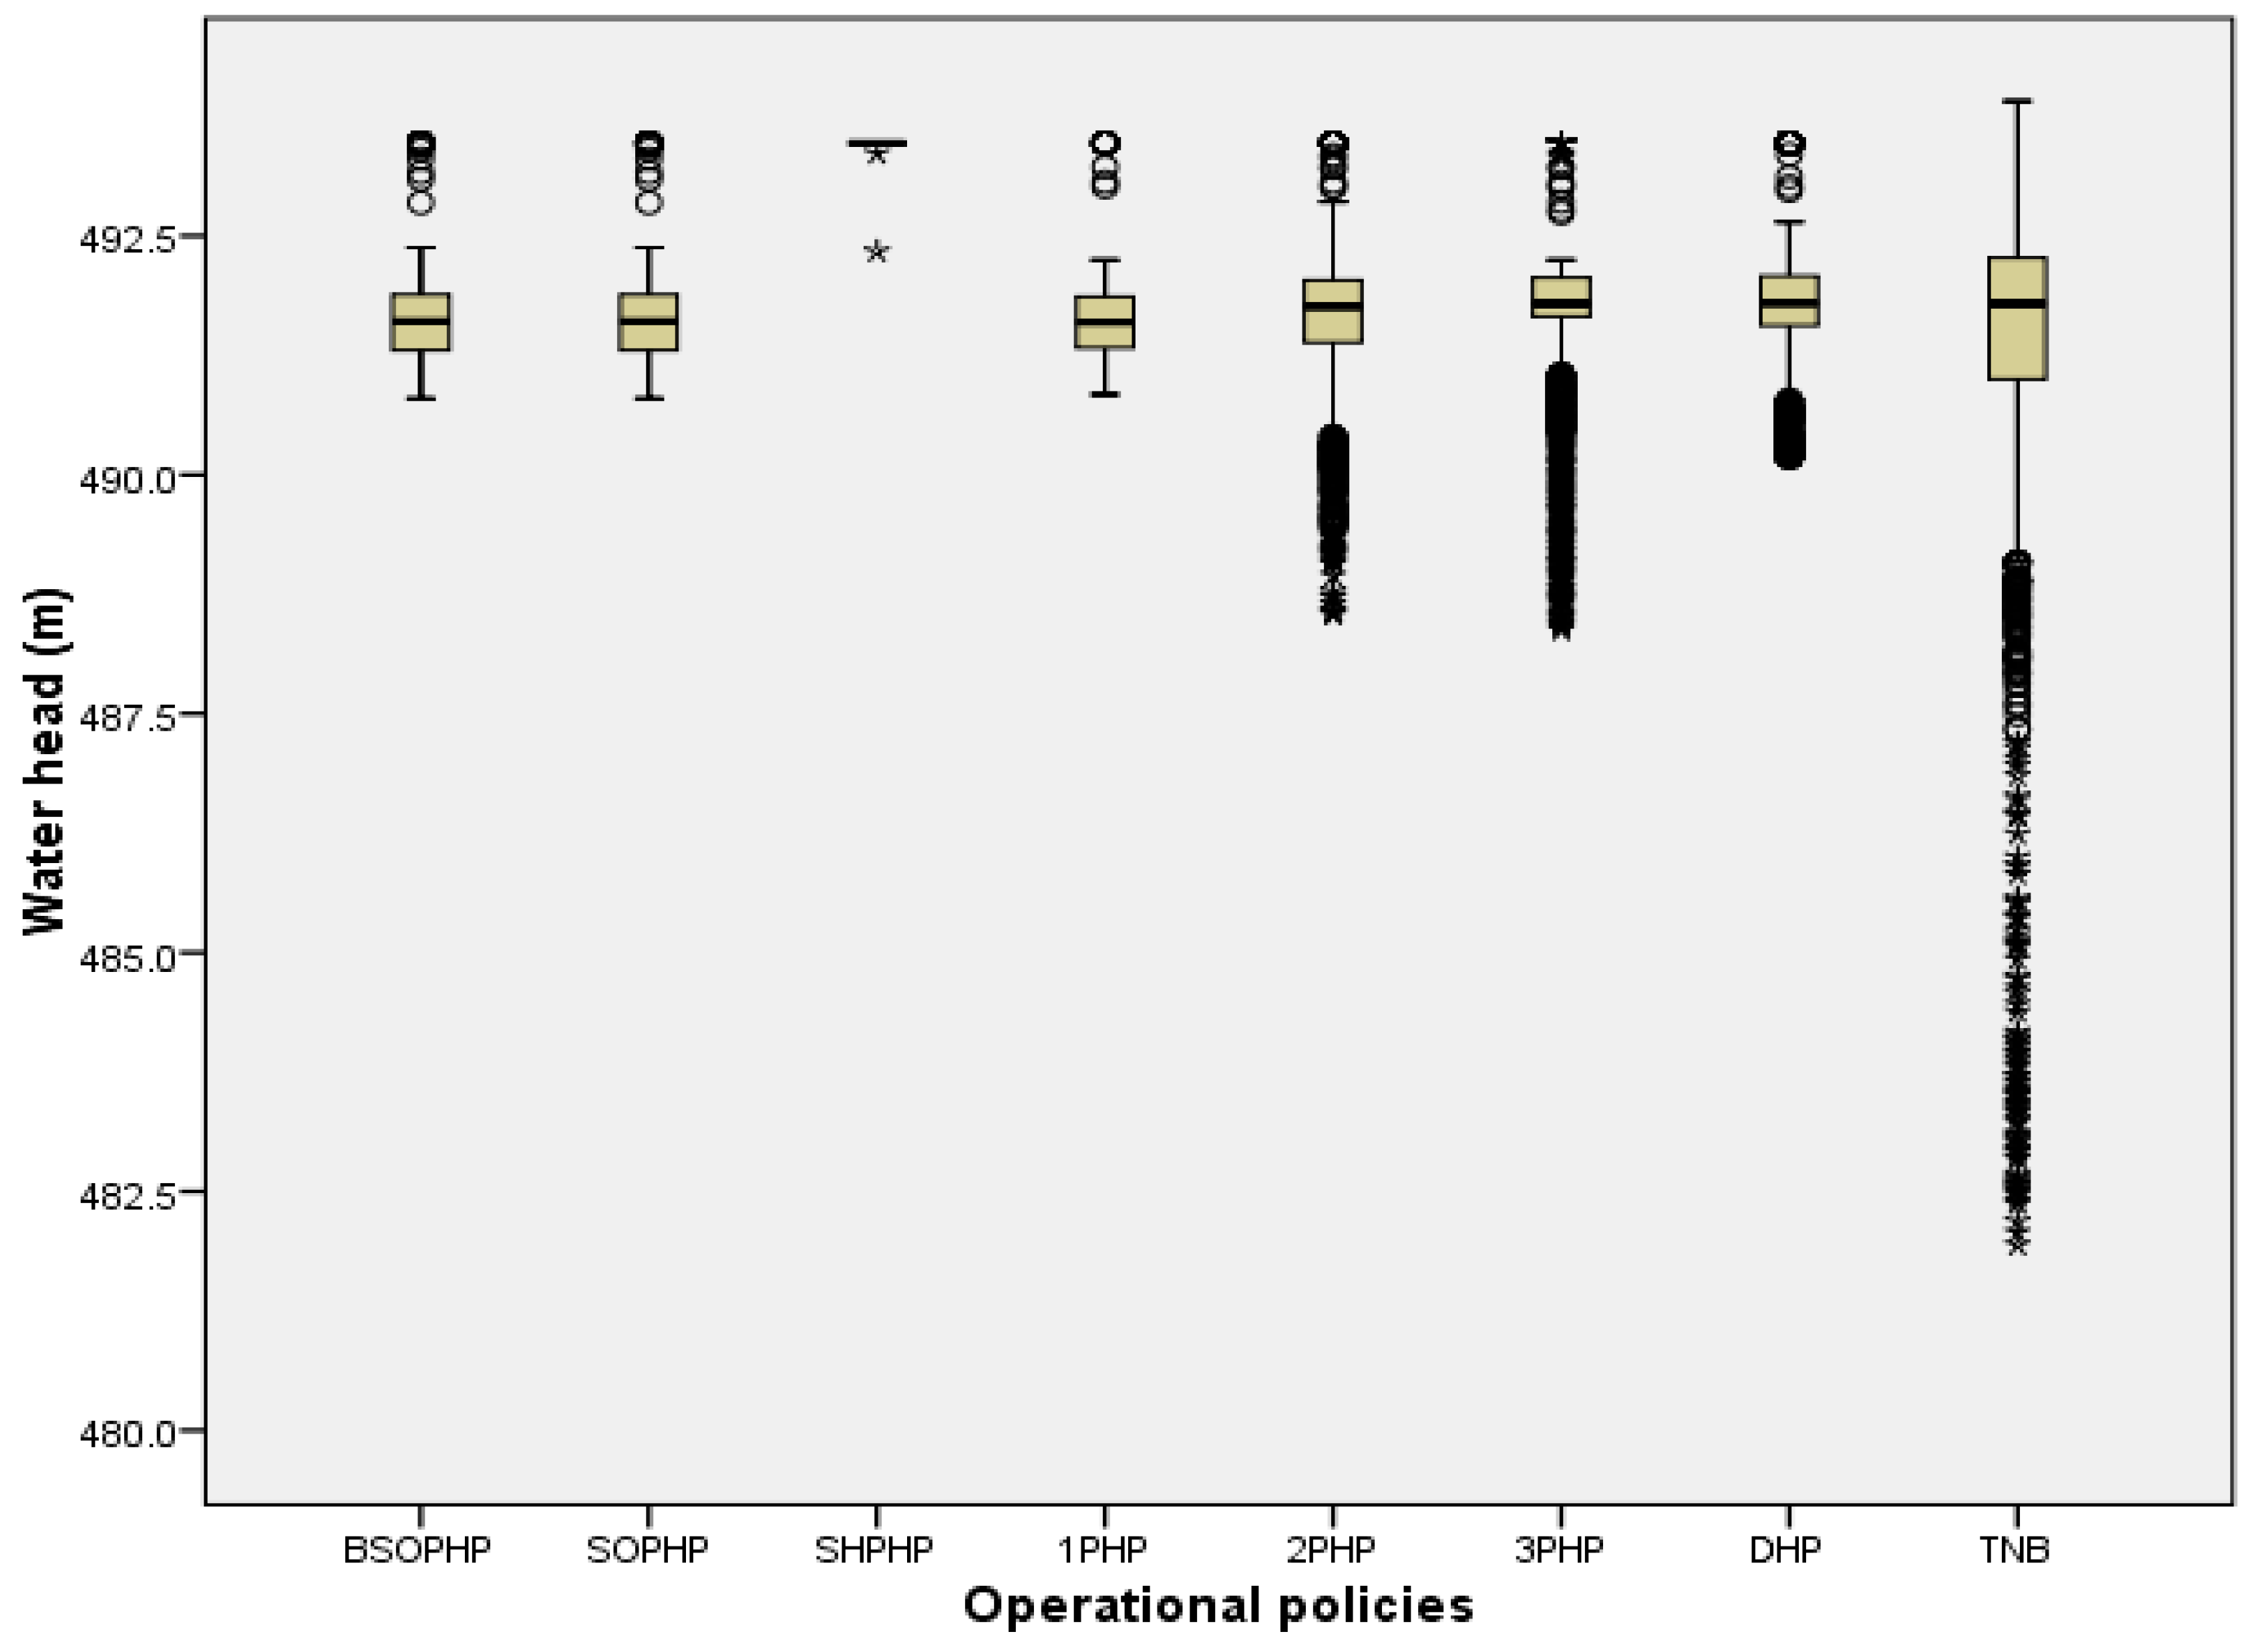
As mentioned earlier, in operation of a reservoir for hydropower generation, two parameters effect on power production output, including water release and water head. When storage in the reservoir is more, the head is also more. Hence, a smaller discharge from a reservoir may be sufficient to produce the required power. Thus, water level makes a significant role in power generation output. The highest water level has more benefit in power production. Therefore, statistical analysis of reservoir elevation for developed operation policies is done and summarized by using box plot of reservoir elevation (Figure 14). The vertical lines demonstrate the variation of reservoir head, and the second horizontal lines (Q2) represent the mean water level in the reservoir by using each policy. The skeletal box plot consists of a box extending from the first quartile (Q1) to the third quartile (Q3). The schematic box plot divides the data based on four invisible boundaries namely, two inner fences and two outer fences. As a common, we define the interquartile range (IQR) to be Q3 − Q1. The inner fences are Q1 − 1.5 IQR and Q3 + 1.5 IQR, while the outer fences are Q1 − 3 IQR and Q3 + 3 IQR. Outliers are usually plotted as individual points, which the ‘o’ symbol represents the inner outlier and ‘*’ represents the outer fences.
Based on the given results, it is very clear that the highest mean water level can produce more power generation. The highest mean water elevation is given by SHPHP, DHP, 3PHP, 2PHP, 1PHP, BSOPHP, and SOPHP respectively. This result could be an evidence for the total output of power generation (Table 2), which was discussed earlier.
The second aspect to point out is whenever the optimal operating policies apply, the water storage in the reservoir is strictly limited and did not exceed the surcharge storage (493.4 m) and inactive zones (486.1 m) in critical drawdown and fulfilled periods. Meanwhile, the box plot of reservoir head in TNB operation shows the wide variation (481.9 m < head < 494 m) in water head and instability in reservoir operation. The results demonstrated that the reservoir head sometimes decreased blow the minimum operating level (486.1 m) and sometimes pass the maximum operating level (493.4 m), which could be dangerous for dam safety. Therefore, this research could help the Jor reservoir manager to operate the reservoir system more efficiently and safety.
Another issue is all types of operating policies try to maintain some storage in a whole year for flood control. While the maximum operating level of Jor reservoir located at the elevation of 493.4 m, all policies kept the mean water level (Q2) less than 493.4 m, except SHPHP policy, which maintain the water level in the highest permissible level (493.4 m) to produce target power with the least release. Rittima [33] used optimal hedging policies for hydropower generation at Ubolratana reservoir. The output results showed that by applying optimal hedging policies, the water head was placed between the surcharge storage and inactive zones for the whole operational time.
5. Conclusions
Although renewable energy such as hydropower has many benefits, most of them are still being operated based on experience and static rules appointed at the time of construction. Since the reservoir operation rules play a significant role in regional development, different forms of operational rules (hedging rules) evaluated in this research. Reservoir hedging rules include a set of rule curves and rationing factors to keep the water at the time of shortage for future use. This concept can use the hydropower reservoir system in order to save the water in the reservoir to increase the water storage and water head in the future. Meanwhile, seven competing hedging policies namely, the one point hedging policy (1PHP), two point hedging policy (2PHP), three-point hedging policy (3PHP), discrete hedging policy (DHP), standard hedging policy for hydropower generation (SHPHP), binary standard operating policy for hydropower generation (BSOPHP), and standard operating policy for hydropower heneration (SOPHP) were formulated and constructed using MATLAB simulation. The developed models were optimized to increase the system efficiency and maximize the power generation. To determine the optimum solution in each policy, hybrid PSO-GA algorithm is used as an optimization technique. Thus, to enhance the functional efficiency in hydropower production, maximization of the total power generation over the operational periods is chosen as an objective function, while physical and operational limitations were satisfied. Based on the given results, it is very clear that the highest mean water level can produce more power generation. The highest mean water elevation is given by SHPHP, DHP, 3PHP, 2PHP, 1PHP, BSOPHP, and SOPHP respectively. Moreover, the results declared that by using the optimized hedging policies, the output of total power generation could increase by 13% in the studied reservoir system compared to present operating policy (TNB operation). This considerable increase in power production will contribute to economic development.
Supplementary Materials
The following are available online at https://www.mdpi.com/2073-4441/11/1/121/s1, Figure S1: Relationship between elevation and storage capacity of Jor Reservoir, Table S1: Formulation of various types of hedging rules, Table S2: Characteristics of Jor dam and Jor reservoir.
Author Contributions
Conceptualization, A.T. and T.A.M.; Methodology, A.T.; Software, A.T.; Validation, A.T., T.A.M., and N.A.-A.; Formal analysis, A.T.; Investigation, T.A.M.; Resources, T.A.M.; Data curation, A.T.; Writing—original draft preparation, A.T.; Writing review and editing, T.A.M. and M.M.; Visualization, M.M.; Supervision, T.A.M.; Project administration, T.A.M. and M.M.; Funding acquisition, N.A.-A.
Funding
This research received no external funding.
Acknowledgments
We would like to thank the Tenaga Nasional Berhad (TNB), Malaysia, for providing all required data.
Conflicts of Interest
The authors declare no conflict of interest.
References
- Date, A.; Akbarzadeh, A. Design and cost analysis of low head simple reaction hydro turbine for remote area power supply. Renew. Energy 2009, 34, 409–415. [Google Scholar] [CrossRef]
- Elbatran, A.; Yaakob, O.; Ahmed, Y.M.; Shabara, H. Operation, performance and economic analysis of low head micro-hydropower turbines for rural and remote areas: A review. Renew. Sustain. Energy Rev. 2015, 43, 40–50. [Google Scholar] [CrossRef]
- Ji, Y.; Lei, X.; Cai, S.; Wang, X. Hedging rules for water supply reservoir based on the model of simulation and optimization. Water 2016, 8, 249. [Google Scholar] [CrossRef]
- Sangiorgio, M.; Guariso, G. NN-based implicit stochastic optimization of multi-reservoir systems management. Water 2018, 10, 303. [Google Scholar] [CrossRef]
- Zhao, T.; Cai, X.; Yang, D. Effect of streamflow forecast uncertainty on real-time reservoir operation. Adv. Water Resour. 2011, 34, 495–504. [Google Scholar] [CrossRef]
- Tayebiyan, A.; Mohammad, T.A. Optimization of cascade hydropower system operation by genetic algorithm to maximize clean energy output. Environ. Health Eng. Manag. J. 2016, 3, 99–106. [Google Scholar] [CrossRef] [Green Version]
- Sasireka, K.; Neelakantan, T. Optimization of hedging rules for hydropower reservoir operation. Scientia Iranica. Trans. A. Civ. Eng. 2017, 24, 2242–2252. [Google Scholar] [CrossRef]
- You, J.Y.; Cai, X. Hedging rule for reservoir operations: 1. A theoretical analysis. Water Resour. Res. 2008, 44. [Google Scholar] [CrossRef] [Green Version]
- Rittima, A. Hedging policy for reservoir system operation: A case study of Mun Bon and Lam Chae reservoirs. Kasetsart J. (Nat. Sci.) 2009, 43, 833–842. [Google Scholar]
- Taghian, M.; Rosbjerg, D.; Haghighi, A.; Madsen, H. Optimization of conventional rule curves coupled with hedging rules for reservoir operation. J. Water Resour. Plan. Manag. 2013, 140, 693–698. [Google Scholar] [CrossRef]
- Tayebiyan, A.; Ali, T.A.M.; Ghazali, A.H.; Malek, M. Optimization of exclusive release policies for hydropower reservoir operation by using genetic algorithm. Water Resour. Manag. 2016, 30, 1203–1216. [Google Scholar] [CrossRef]
- Spiliotis, M.; Mediero, L.; Garrote, L. Optimization of hedging rules for reservoir operation during droughts based on particle swarm optimization. Water Resour. Manag. 2016, 30, 5759–5778. [Google Scholar] [CrossRef]
- Ashofteh, P.S.; Bozorg-Haddad, O.; Loáiciga, H.A. Logical genetic programming (LGP) development for irrigation water supply hedging under climate change conditions. Irrig. Drain. 2017, 66, 530–541. [Google Scholar] [CrossRef]
- Aboutalebi, M.; Bozorg Haddad, O.; Loáiciga, H.A. Optimal monthly reservoir operation rules for hydropower generation derived with SVR-NSGAII. J. Water Resour. Plan. Manag. 2015, 141, 04015029. [Google Scholar] [CrossRef]
- Ehteram, M.; Mousavi, S.F.; Karami, H.; Farzin, S.; Emami, M.; Othman, F.B.; Amini, Z.; Kisi, O.; El-Shafie, A. Fast convergence optimization model for single and multi-purposes reservoirs using hybrid algorithm. Adv. Eng. Inform. 2017, 32, 287–298. [Google Scholar] [CrossRef]
- Draper, A.J.; Lund, J.R. Optimal hedging and carryover storage value. J. Water Resour. Plan. Manag. 2004, 130, 83–87. [Google Scholar] [CrossRef]
- Tayebiyan, A.; Ali, T.A.M.; Ghazali, A.H.; Megat Mohd Noor, M.J. Simulation and optimization of multiple points hedging policies for operation of Cameron Highland hydropower reservoir system, Malaysia. Desalination Water Treat. 2018, 120, 205–216. [Google Scholar] [CrossRef]
- Neelakantan, T.; Sasireka, K. Hydropower reservoir operation using standard operating and standard hedging policies. Int. J. Eng. Techn. 2013, 5, 1191–1196. [Google Scholar]
- Haddad, O.B.; Afshar, A.; Mariño, M.A. Design-operation of multi-hydropower reservoirs: HBMO approach. Water Resour. Manag. 2008, 22, 1709–1722. [Google Scholar] [CrossRef]
- Jahandideh-Tehrani, M.; Haddad, O.B.; Loáiciga, H.A. Hydropower reservoir management under climate change: The Karoon reservoir system. Water Resour. Manag. 2015, 29, 749–770. [Google Scholar] [CrossRef]
- Brandao, J.L.B. Performance of the equivalent reservoir modelling technique for multi-reservoir hydropower systems. Water Resour. Manag. 2010, 24, 3101–3114. [Google Scholar] [CrossRef]
- Premalatha, K.; Natarajan, A. Hybrid PSO and GA for global maximization. Int. J. Open Problems Compt. Math. 2009, 2, 597–608. [Google Scholar]
- Chang, J.X.; Bai, T.; Huang, Q.; Yang, D.W. Optimization of water resources utilization by PSO-GA. Water Resour. Manag. 2013, 27, 3525–3540. [Google Scholar] [CrossRef]
- Thompson, S.; Tanapat, S. Modeling waste management options for greenhouse gas reduction. J. Environ. Inform. 2005, 6, 16–24. [Google Scholar] [CrossRef]
- Ali, A.F.; Tawhid, M.A. A hybrid particle swarm optimization and genetic algorithm with population partitioning for large scale optimization problems. Ain Shams Eng. J. 2017, 8, 191–206. [Google Scholar] [CrossRef] [Green Version]
- Garg, H. A hybrid PSO-GA algorithm for constrained optimization problems. Appl. Math. Comput. 2016, 274, 292–305. [Google Scholar] [CrossRef]
- Nagesh Kumar, D.; Janga Reddy, M. Multipurpose reservoir operation using particle swarm optimization. J. Water Resour. Plan. Manag. 2007, 133, 192–201. [Google Scholar] [CrossRef]
- Barroso, E.S.; Parente, E.; De Melo, A.M.C. A hybrid PSO-GA algorithm for optimization of laminated composites. Struct. Multidiscipl. Optim. 2017, 55, 2111–2130. [Google Scholar] [CrossRef]
- Ahmadianfar, I.; Radmanesh, F.; Salahisanandaj, Y. An improved particle swarm optimization algorithm for hydropower reservoir system operation. Arch. Sci. 2012, 65, 438–444. [Google Scholar]
- Knutson, T.R.; Sirutis, J.J.; Zhao, M.; Tuleya, R.E.; Bender, M.; Vecchi, G.A.; Villarini, G.; Chavas, D. Global projections of intense tropical cyclone activity for the late twenty-first century from dynamical downscaling of CMIP5/RCP4. 5 scenarios. J. Clim. 2015, 28, 7203–7224. [Google Scholar] [CrossRef]
- Chiamsathit, C.; Adeloye, A.; Soudharajan, B. Genetic algorithms optimization of hedging rules for operation of the multi-purpose Ubonratana Reservoir in Thailand. In Evolving Water Resources Systems: Understanding, Prediction and Managing Water-Society Interactions, Proceedings of the ICWRS2014, Bologna, Italy, 4–6 June 2014; Castellarin, A., Ceola, S., Toth, E., Montanari, A., Eds.; IAHS Publ.: Wallingford, UK, 2014; Volume 364, pp. 507–512. [Google Scholar]
- Tu, M.Y.; Hsu, N.S.; Tsai, F.T.C.; Yeh, W.W.G. Optimization of hedging rules for reservoir operations. J. Water Resour. Plan. Manag. 2008, 134, 3–13. [Google Scholar] [CrossRef]
- Rittima, A. Optimal hedging policies for hydropower generation at ubolratana reservoir. Kasetsart J. (Nat. Sci.) 2012, 46, 812–825. [Google Scholar]
Figure 1.
Flow diagram of the present study.

Figure 2.
Monthly mean stream flow of Jor River and side stream rivers.

Figure 3.
Scheme of one-point hedging policy.

Figure 4.
Scheme of two-point hedging policy (2PHP).

Figure 5.
Scheme of three-point hedging policy (3PHP).

Figure 6.
Scheme of discrete hedging policies (DHP).

Figure 7.
Scheme of standard operating policy for hydropower production (SOPHP).

Figure 8.
Scheme of binary standard operating policy for hydropower production (BSOPHP).

Figure 9.
Scheme of standard hedging policy for hydropower production.

Figure 10.
Flow-chart of the hybrid PSO-GA algorithm.

Figure 11.
Comparison of optimization algorithms (GA, PSO, and hybrid PSO-GA) performance.

Figure 12.
Compare monthly mean power generation between constructed models time period (2003–2009) and validation period (2010–2012) in different forms of hedging policies (A–G).
Figure 12.
Compare monthly mean power generation between constructed models time period (2003–2009) and validation period (2010–2012) in different forms of hedging policies (A–G).

Figure 13.
Comparison between monthly mean power generation by optimized operational policies and by TNB operation for the period from 2003–2009.
Figure 13.
Comparison between monthly mean power generation by optimized operational policies and by TNB operation for the period from 2003–2009.

Figure 14.
Jor reservoir elevation Box plot for different forms of operational policies during construction time.
Figure 14.
Jor reservoir elevation Box plot for different forms of operational policies during construction time.


Table 1.
Optimization of decision variables during 2003–2009 by using hybrid PSO-GA algorithm for various hedging policies.
Table 1.
Optimization of decision variables during 2003–2009 by using hybrid PSO-GA algorithm for various hedging policies.
| Name of Policy | Optimal Points | Storage (m3) |
|---|---|---|
| SOPHP | S | 2,465,523 |
| BSOPHP | S | 2,465,523 |
| SHPHP | S1 | 2,085,195 |
| S2 | 2,203,957 | |
| S3 | 2,318,751 | |
| 1PHP | Sa | 2,183,452 |
| 2PHP | Sa | 2,154,853 |
| Sb | 2,340,108 | |
| 3PHP | Sa | 2,038,475 |
| Sb | 2,082,471 | |
| Sc | 2,324,914 | |
| V1 | 1,714,985 | |
| V2 | 2,451,289 | |
| DHP | V3 | 2,463,421 |
| HF1*D | 519,000 | |
| HF2*D | 868,000 | |
| HF3*D | 961,000 |
D = target demand (1 Mm3).
Table 2.
System’s mean and total power generation from 2003–2009.
| Operational Policies Model | Mean Power Generation (kWh) | Total Power Generation (GWh) 2003–2012 |
|---|---|---|
| BSOPHP | 1,320,942 | 3377.13 |
| SOPHP | 1,320,942 | 3377.13 |
| SHPHP | 1,325,548 | 3382.43 |
| 1PHP | 1,320,965 | 3377.45 |
| 2PHP | 1,320,863 | 3377.71 |
| 3PHP | 1,321,227 | 3378.13 |
| DHP | 1,322,164 | 3378.38 |
| TNB | 1,267,158 | 2938.60 |
© 2019 by the authors. Licensee MDPI, Basel, Switzerland. This article is an open access article distributed under the terms and conditions of the Creative Commons Attribution (CC BY) license (http://creativecommons.org/licenses/by/4.0/).
Share and Cite
MDPI and ACS Style
Tayebiyan, A.; Mohammad, T.A.; Al-Ansari, N.; Malakootian, M. Comparison of Optimal Hedging Policies for Hydropower Reservoir System Operation. Water 2019, 11, 121. https://doi.org/10.3390/w11010121
AMA Style
Tayebiyan A, Mohammad TA, Al-Ansari N, Malakootian M. Comparison of Optimal Hedging Policies for Hydropower Reservoir System Operation. Water. 2019; 11(1):121. https://doi.org/10.3390/w11010121
Chicago/Turabian StyleTayebiyan, Aida, Thamer Ahmad Mohammad, Nadhir Al-Ansari, and Mohammad Malakootian. 2019. "Comparison of Optimal Hedging Policies for Hydropower Reservoir System Operation" Water 11, no. 1: 121. https://doi.org/10.3390/w11010121
Note that from the first issue of 2016, this journal uses article numbers instead of page numbers. See further details here.