Characteristics of Dew Formation in the Semi-Arid Loess Plateau of Central Shaanxi Province, China


1
Institute of Water and Development, Chang’an University, Xi’an 710054, China
2
School of Environmental Science and Engineering, Chang’an University, Xi’an 710054, China
3
Key Laboratory of Subsurface Hydrology and Ecological Effects in Arid Region, Ministry of Education, Chang’an University, Xi’an 710054, China
4
Department of Earth and Environmental Sciences, California State University, Fresno, CA 93740, USA
*
Author to whom correspondence should be addressed.
Water 2019, 11(1), 126; https://doi.org/10.3390/w11010126
Submission received: 25 November 2018
/
Revised: 16 December 2018
/
Accepted: 7 January 2019
/
Published: 11 January 2019
(This article belongs to the Special Issue Hydrological and Ecological Systems within the Terrestrial Land Surface)
Abstract
:Compared to rain, dew is an important supplementary source of water for the survival of certain plants and animals in drylands. However, the hydrology of dew has not yet been fully investigated due to difficulties in measuring the amount and duration of it. In this study, a 3-year in-situ monitoring experiment was conducted from 2014 to 2016 in the semi-arid Sanyuan County, Shaanxi Province of China, using a leaf wetness sensor (LWS) and four associated meteorological instruments. Results showed that the average annual total dewfall was 32.8 mm with a daily maximum of 0.88 mm. The majority of daily dew occurred in the night from 18:00 to 8:00 with the maximum condensation rate occurring at around 4:00. The maximum dew residence time was about 18 h/day on the dew days in all seasons. However, the actual dew production period was about 14 h in spring (March–May), autumn (September–November), and winter (December–February), and only 11 h in summer (June–August). The maximum intensity and amount of dew always occurred in autumn (with an average amount of 12.2 mm or 37% of the annual total), followed closely by spring (11.4 mm, 35%), with much less in summer (6.6 mm, 20%) and winter (2.6 mm, 8%). The annual dew distribution by months showed a double crest variation, with two peaks in April–May and October–November, and two valleys in January–February and July. Comparatively, annual dewfall is only about 1/18th of the rainfall in this region, but the number of dew days (224 days, or 61% of year) is 2.6 times that of rain days (87 days, 24%), making dew a critical supplementary source of water for mitigating dry periods and supporting native plants and animals. Rain and dew are highly complementary as dew occurs in cloudless nights while the rain occurs in different and on much fewer occasions in the region. The dew amount was highly and positively correlated to the relative humidity of the air above the threshold of 81% (r = 0.78, p < 0.01), negatively correlated to the difference between air temperature Ta and dewpoint Td, when (Ta − Td) is less than 4 °C (r = −0.66, p < 0.01), and weakly correlated to wind speed (0.2 to 2 m·s−1), wind direction, surface soil moisture, and temperature. In the Sanyuan region, two general wind directions, 30°–90°and 210°–270°, were more favorable for the formation of dew.
1. Introduction
The formation of dew is a common and natural process in which water vapor in the air condenses on a cooler substrate and transforms into liquid water [1]. Dew is an important source of water that may significantly influence the physiological status of vegetation and the microclimate environment [2,3]. Although the yield is relatively small, dew itself as a viable water resource occurs naturally and frequently in many locations globally, particularly in arid and semi-arid areas and during dry periods in humid areas [4,5]. For example, the frequency and duration of dew in Wageningen, Netherlands were 70% and 16.4 h/day, respectively, even though the average annual amount of dew only accounted for approximately 4.5% of the total precipitation (more than 800 mm) [6]. Therefore, numerous studies in recent decades have aimed at understanding the hydrology of dew (i.e., storage, movement, frequency and residence time etc.), the hydrological significance, as well as utilization methods of dew.
Many attempts have been made to quantify the amount of dew [7,8,9,10,11]. Results show that dew plays a more important role for water budgets in arid areas than in humid areas. For example, in a semi-humid area such as the Sanjiang Plain in NE China, the average amount of dew accounted for 4.9% of the annual precipitation (410 mm) [12]. However, in an arid area such as the Taklimakan Desert, the average dewfall amount during the later summer and autumn months (June–October) accounted for 50% of the annual total precipitation (35 mm) [13].
Compared to rainfall events, the frequency of dew is higher, and the duration is longer in arid and semi-arid areas. For example, in the arid Negev Desert, the frequency and duration of dew events were 55% in terms of dew days in a year and 7.6 h/night, respectively [14]. In a semi-arid area such as Almería in Spain, the frequency and duration were 50% and 6.5 h/day, respectively [15]. One drawback of the high frequency and duration of dew is the increased risk of pest and disease development on the plants [16,17,18]. However, the availability of water to plants is the paramount concern in drylands.
To effectively quantify the processes of dew formation, Severini et al. (1984) conceptualized the daily formation process of dew on grass by combining standard micrometeorological measurements with the energy-balance equation [19]. Beysens (1995) analyzed the formation process of dew and suggested that dew can be controlled by two key parameters: wetting properties of the substrate and temperature [20]. Jacobs et al. (1999, 2000) presented a simulation model to describe the daily dew formation and the early drying processes at a research site in Nizzana in the northwestern Negev Desert of Israel [21,22]. Agam and Berliner (2006) reviewed the different physical mechanisms controlling dew formation and direct water vapor adsorption, and emphasized that the soil’s thermal and hydraulic properties play a key role in determining the type of phenomena: dew or adsorption [4]. Other studies have shown that high relative humidity of air [23,24], low air temperature [25], as well as moderate wind speed [1,20], were the favorite weather conditions for the formation of dew. However, further research is needed on the formation mechanism of dew and quantification of the influencing factors.
As a potential water resource, dew can be collected for various important uses. Hollermann and Zapp (1991) studied the possibility of storing dew in the Canary Islands [26]. Alnaser and Barakat (2000) proposed coupling passive dew collection with a low-cost and little-maintenance drip irrigation system, although no implementation was tested [27]. A single-wall polypropylene tree shelter demonstrated effective dew harvesting capabilities resulting in an increase in soil moisture content [28]. During the dry season between October 2004 and May 2005 in NW India, Kothara constructed a dew collection system with little investment, by adapting plain, uninsulated, corrugated and galvanized iron roofs. The cumulative dew amount on an 18-m2 double-sloped (30°) test roof was 6.3 mm, and the use of thermal insulation and more IR radiative materials would have increased this yield by 40% [29]. Similar experiments were conducted by Beysens et al. [30]. A plastic greenhouse roof in India harvested 10 mm of dew over 7 months, with a nightly maximum of 0.36 mm [31]. More recently, a large conical dew harvesting prototype, providing 50% of the water requirements for maize, was utilized in West Africa [32]. So, it is very possible that dew can be of sufficient quantities to be used for many purposes, especially on increasing dew water yield based on technologies.
The semi-arid areas in the Loess Plateau in northern China belong to a vast region with a mean annual precipitation of 200–750 mm [33]. Due to extreme variability of the landscape [34], dew hydrology is very complicated. For example, in Dingxi observation station, located at the junction of the Qinghai–Tibet Plateau and the Loess Plateau, observations showed that dew was likely to occur when the relative air humidity was greater than 80%, surface wind speed at about 1.5 m/s, and when a temperature inversion occurred between the heights of 1 m and 4 m [10]. In Mizhi experimental station, located in the middle of the Loess Plateau, observations showed that dew occurred when the relative humidity was >78%, wind speed <0.5 m/s, and dewpoint depression (difference between air temperature and atmospheric dew point temperature) was about 1–3 °C [35]. The degree of influence on dew formation is different when the same factors act in different geographical areas. With the global increasing trend of surface specific humidity [36,37], the frequency of dew is likely to increase in the future. Previous researches have been resourceful in studying dew occurrence in the world, especially in arid and semi-arid regions. However, many aspects of dew hydrology are still enigmatic and site specific. Quantitative assessment of dew behaviors is still largely dependent on site measurement instead of hydrologic predictions. The objectives of this study are to: (1) experimentally monitor the in-situ dynamics of dew formation in the semi-arid Loess Plateau in northern central Shaanxi Province of China; and (2) assess the amount, duration, and frequency of dew based on the collected data.
2. Materials and Methods
2.1. Measurement Site
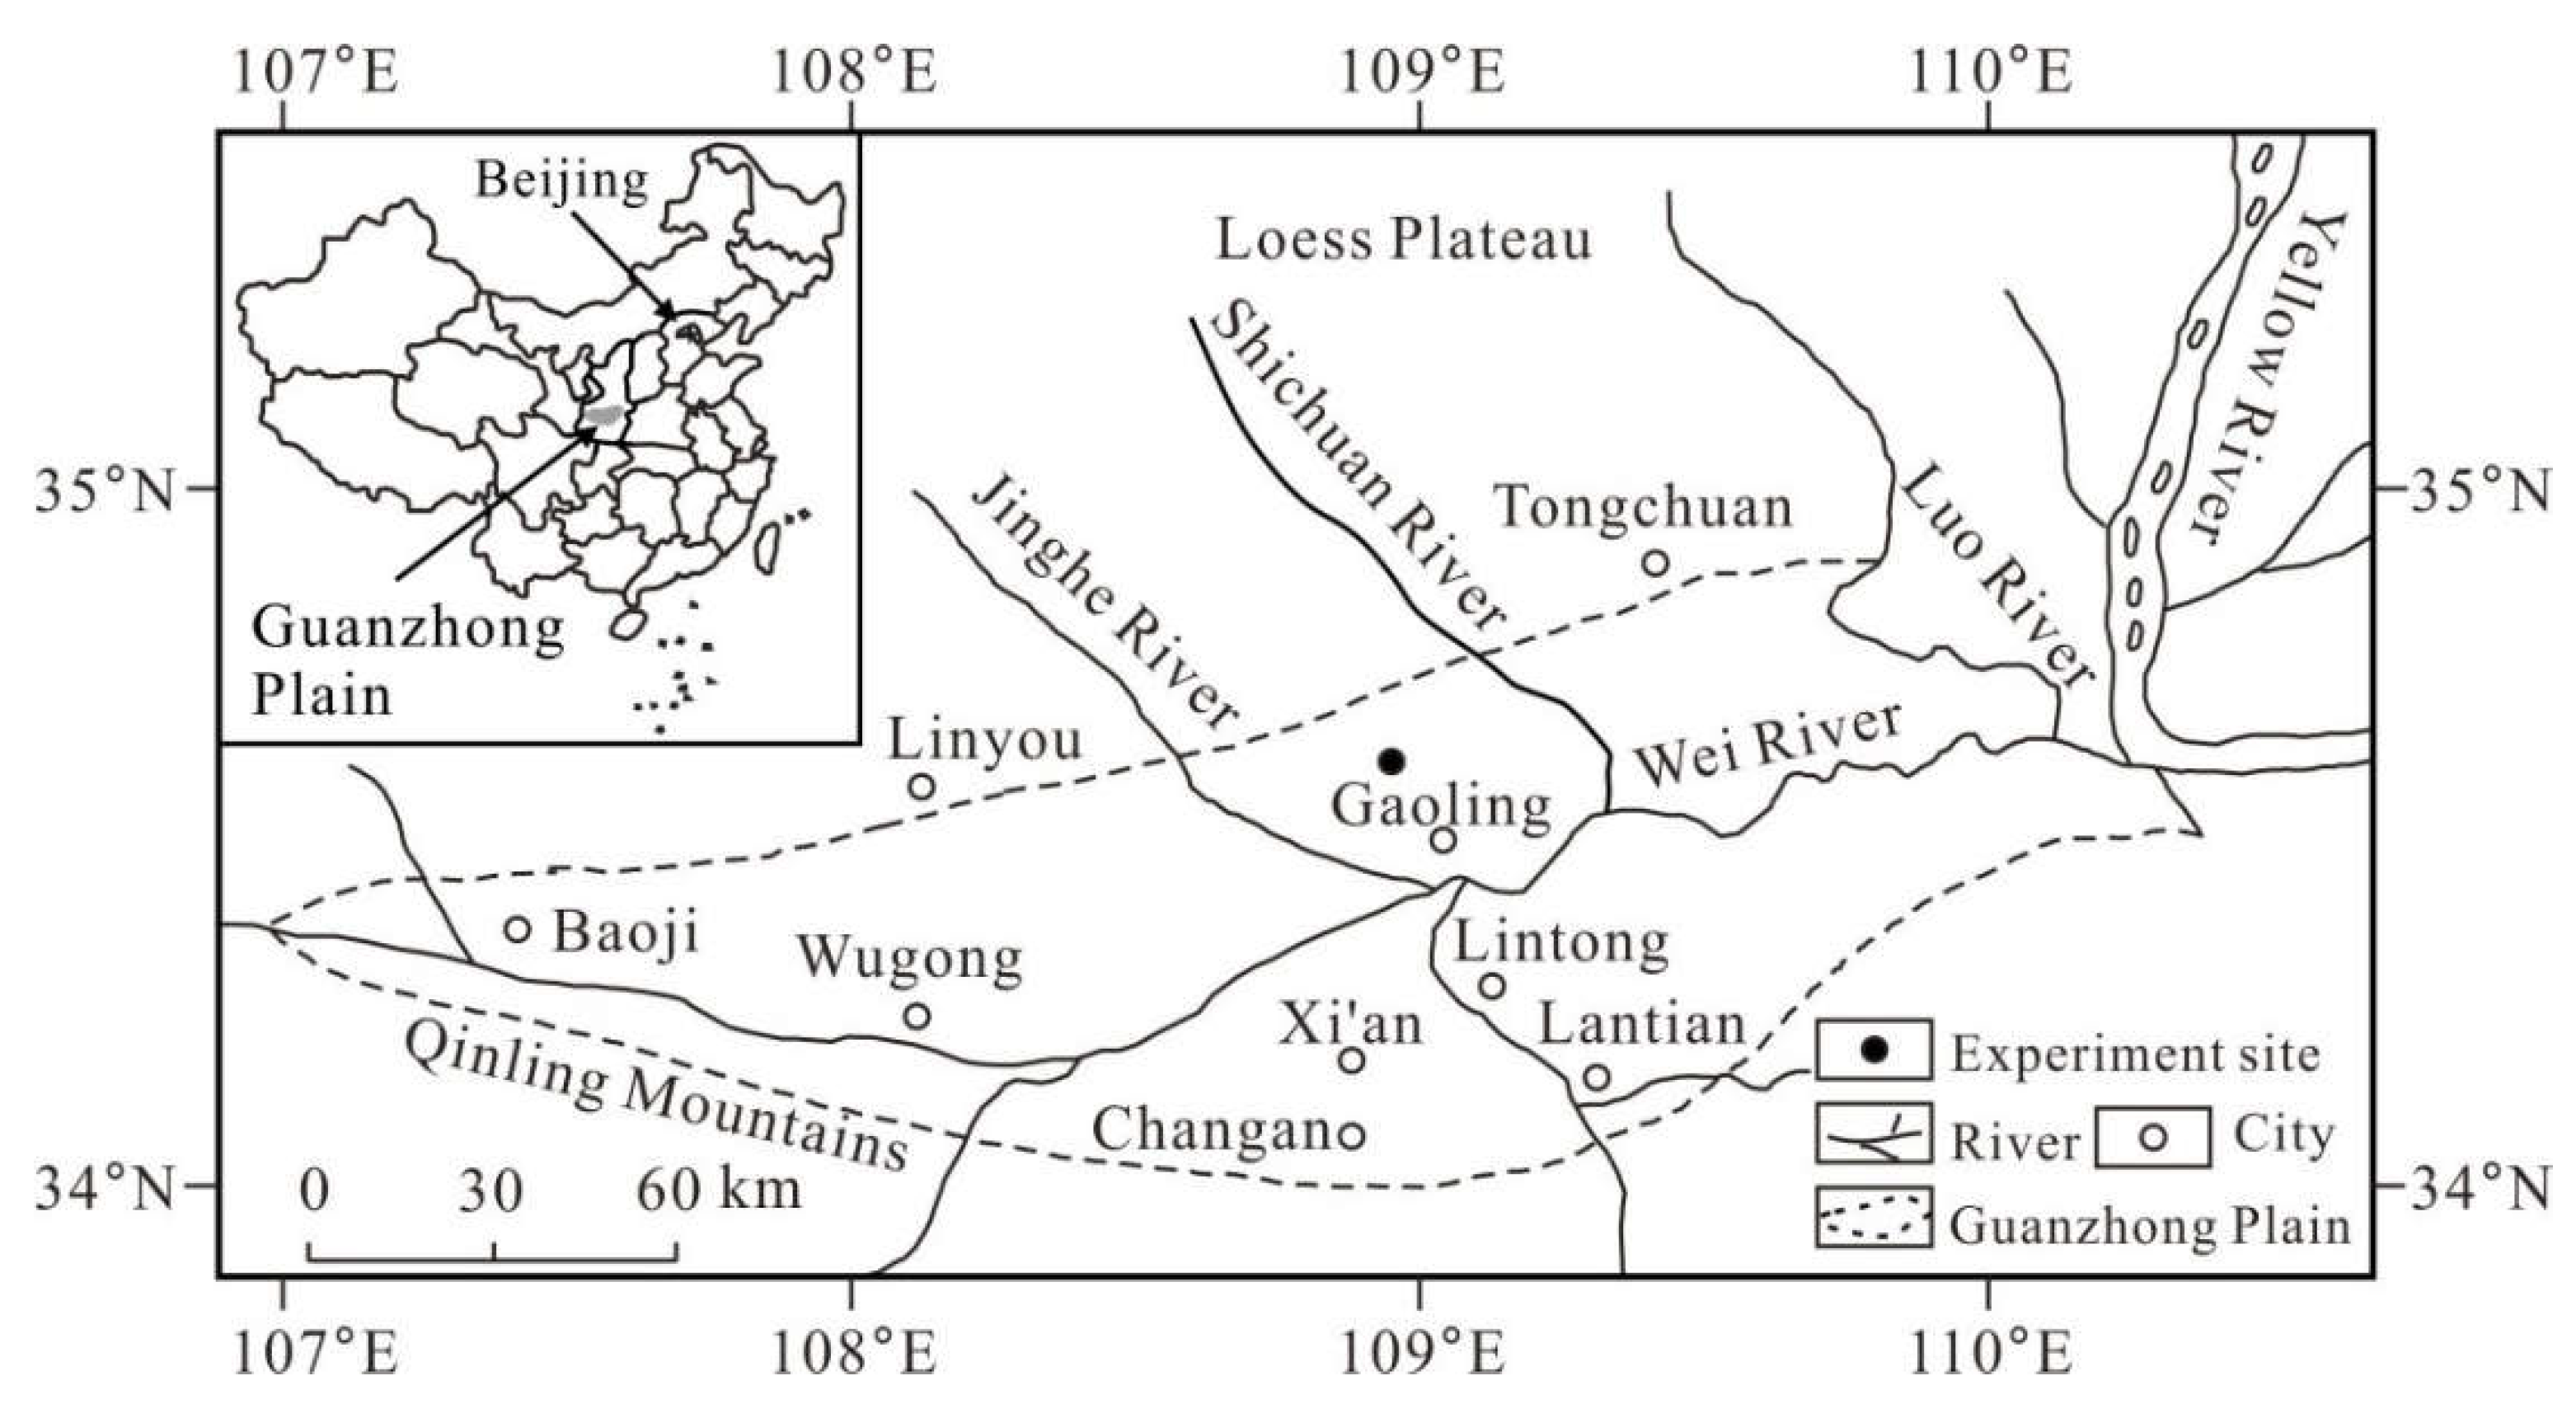
The experiment was conducted at Jinghuiqu Irrigation Experimental Station (JIES) operated by Jinghuiqu Irrigation District Administration, in Sanyuan County, Shaanxi Province, China (Figure 1). The measurement site (latitude 34°33’ North, longitude 108°54’ East, elevation 419.72 m above sea level) is located in the middle of the Guanzhong Plain, which is in a warm temperate climate zone. Based on the Gregorian calendar, there are clear four seasons in this region, including spring (March, April, May), summer (June, July, August), autumn (September, October, November) and winter (December, January, February) [38,39]. The mean annual temperature is 13.6 °C, with a maximum ever recorded value of 42 °C in July and a minimum of −24 °C in January. This site has a mean annual precipitation of 533 mm, with about 50% of annual rainfall congested in July, August, and September. The average annual potential evapotranspiration is 1212 mm which is 2.3 times that of rainfall. Thus, this area is naturally a dryland. According to UNEP (United Nations Environment Program, 1992) [40], drylands have a ratio of average annual precipitation (P) to potential evapotranspiration (PET) of less than 0.65. Dryland is further classified as hyper-arid (P/PET < 0.05), arid (0.05 < P/PET < 0.20), semi-arid (0.20 < P/PET < 0.50) and dry sub-humid (0.50 < P/PET < 0.65). Since this area has P/PET = 0.44, it is part of the semi-arid drylands in China. Soil texture varies from silt loam to silty clay loam (based on the USDA soil texture standard) with a high percentage of silt (67.1–76.6%) [41]. The local cropping system is wheat in winter rotated to corn in summer. Crops are irrigated 3–5 times a year depending on the amount of precipitation. The average total irrigation amount is approximately 500 mm per year [42].
2.2. LWS Calibration
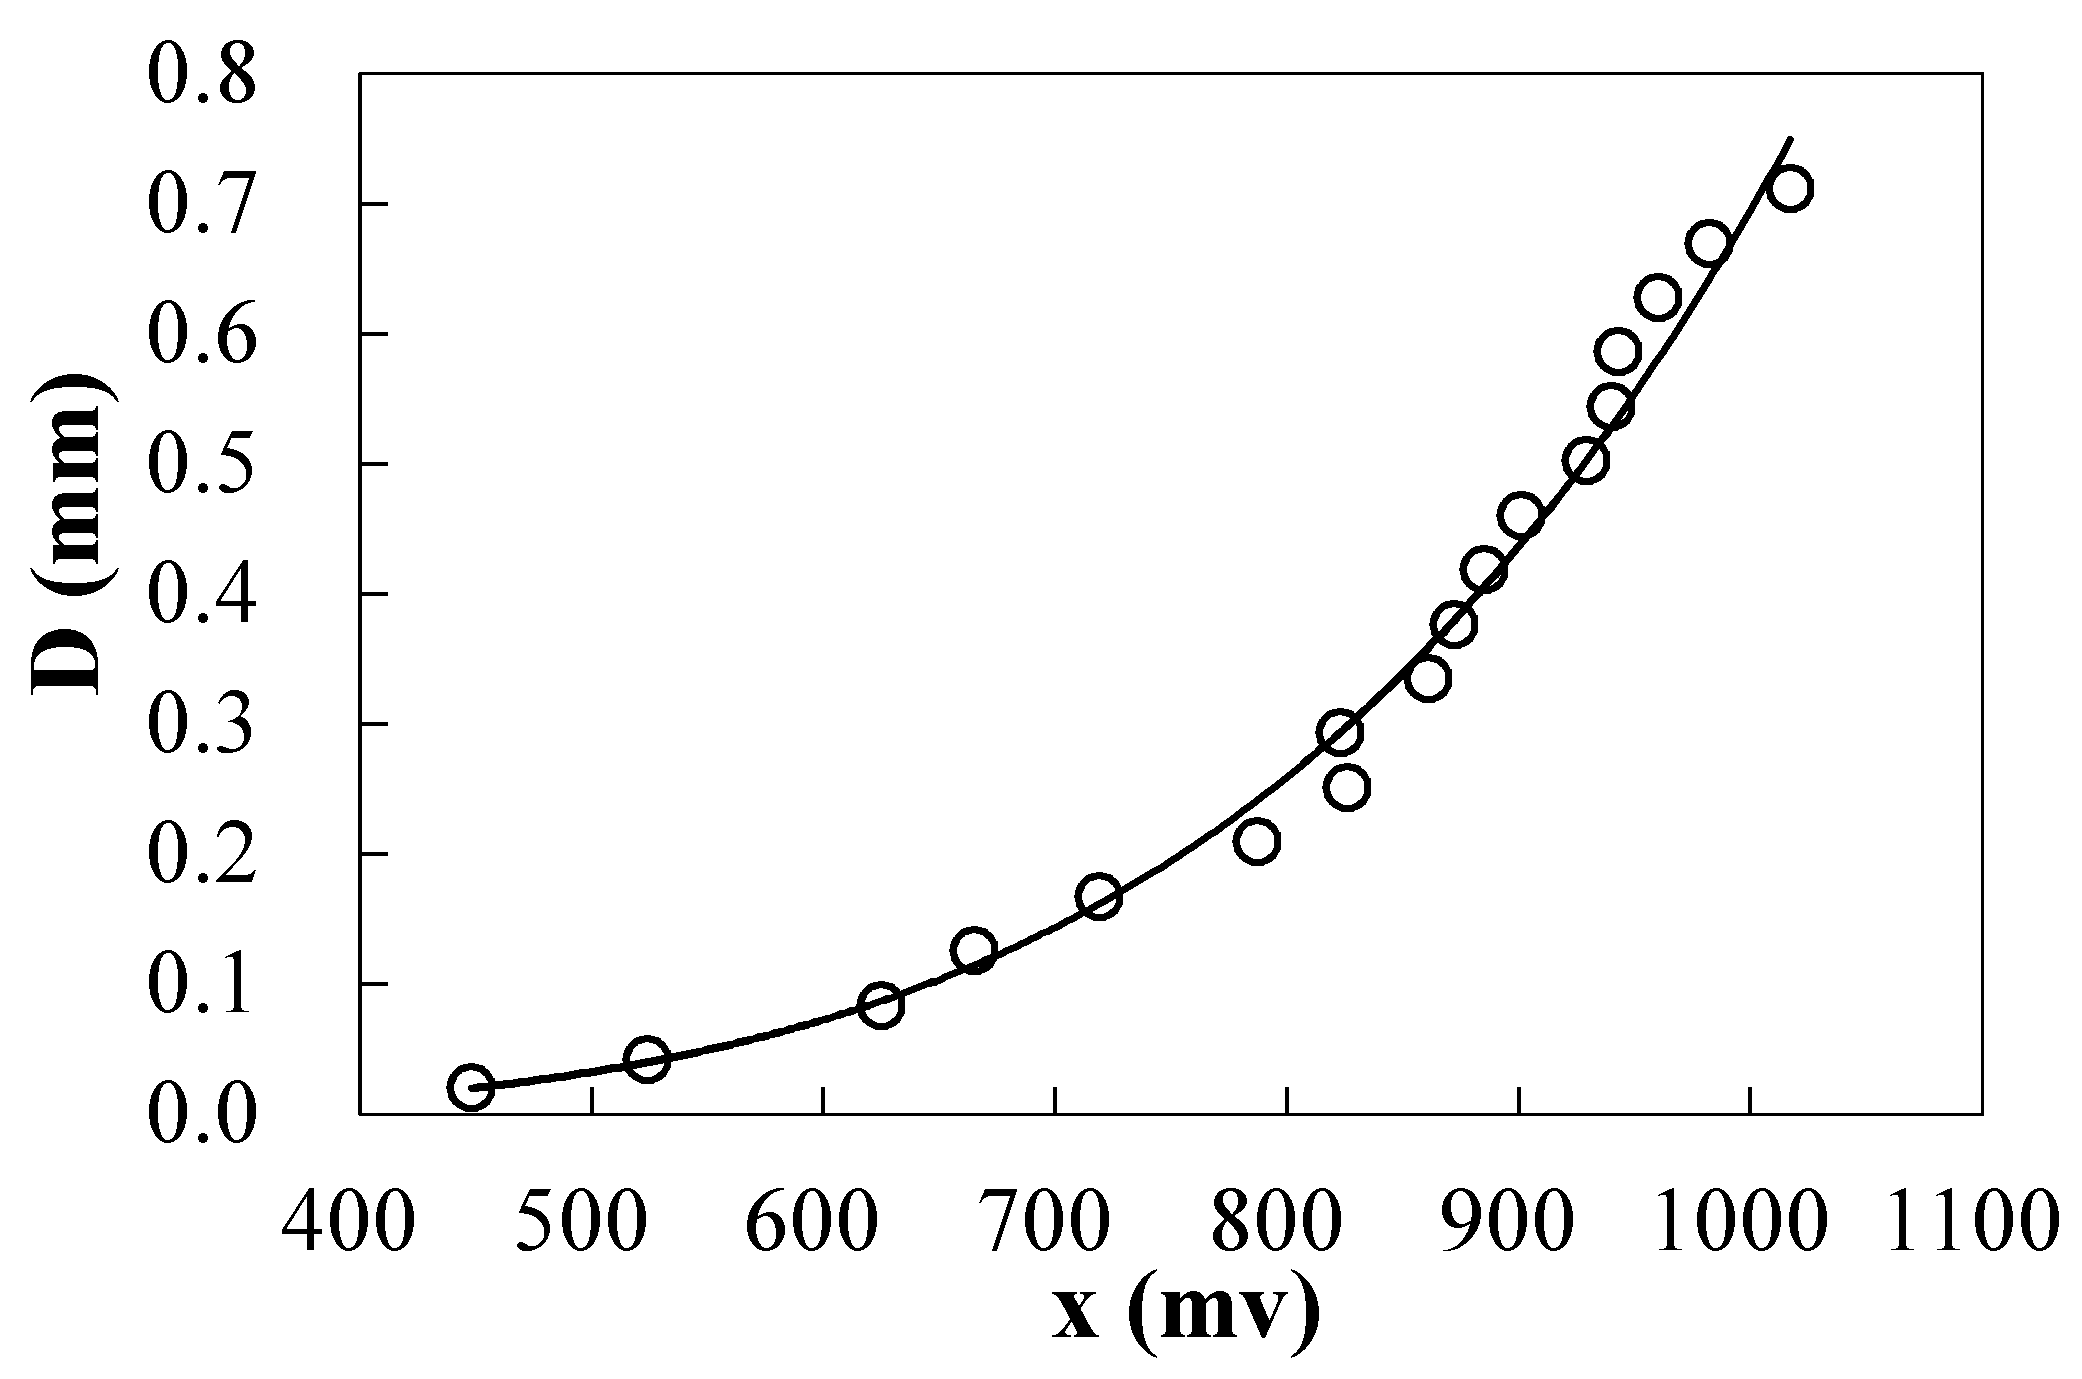
The dielectric Leaf Wetness Sensor (LWS, by Decagon Devices, Pullman, WA, USA) was chosen to measure the amount and duration of dew. LWS is an innovative new sensor that can be used to measure the dielectric constant of the sensor’s upper surface, which can be converted into the amount of dew by calibration. Calibration was conducted by placing the LWS horizontally, with its signal output port plugged into an EM50 Data Logger (by Decagon Devices, USA). A small sprayer was used to spray a known amount of water (about 0.0418 mm per spray) on the surface of the LWS. By increasing the amount of sprayed water, the corresponding increase of the electric signal in mini voltage is recorded in the EM50, as shown in Figure 2.
The following calibration equation was obtained:
where, D is the accumulated dew amount over the surface of LWS (mm), x is the raw voltage counts (mv) recorded in EM50, a and b are fitting parameters, a = 4 × 10⁻¹⁴ and b = 4.4188 (r = 0.9973, p < 0.01).
2.3. Field Installation
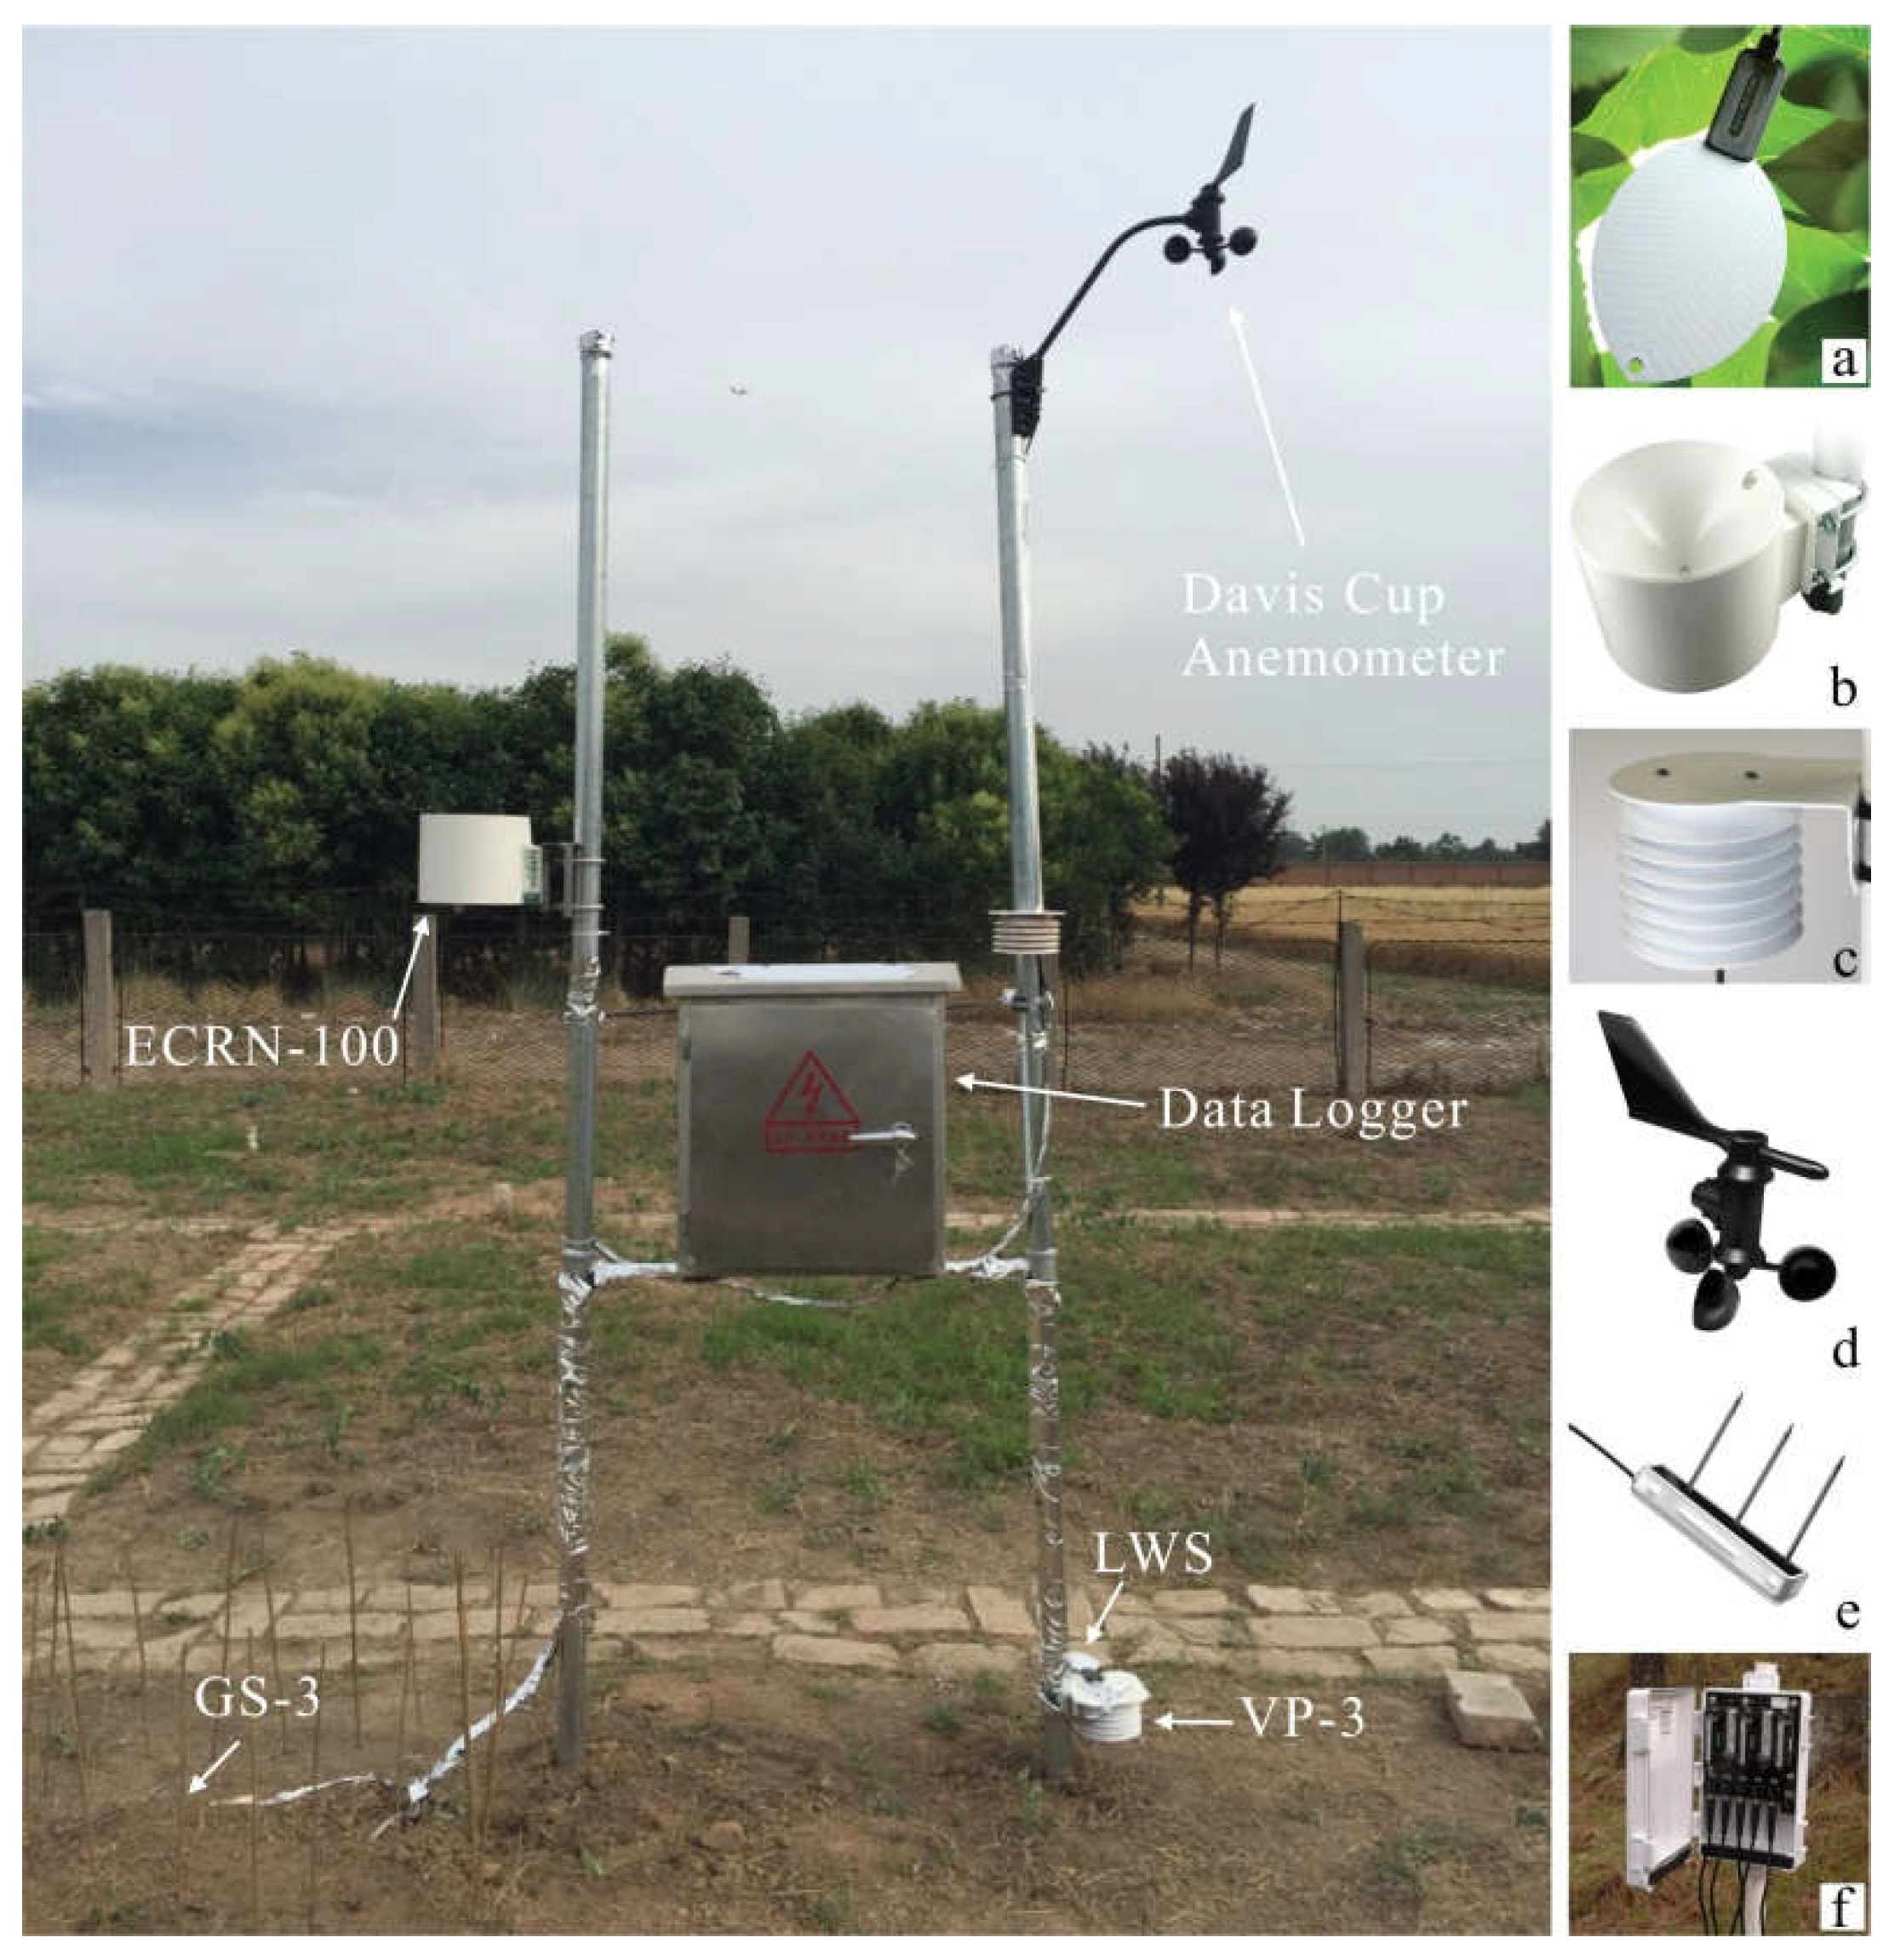
A bare and open ground inside the wire-fenced meteorological station of JIES was selected for installation of the instruments. The LWS sensor was placed 10 cm above the ground. Precipitation was measured using an ECRN-100 high-resolution rain gauge (by Decagon Devices, USA) with 0.2 mm resolution, placed 150 cm above the ground. Air temperature and relative humidity were measured using a VP-3 sensor (by Decagon Devices, USA) with 0.1 °C and 0.1% RH resolution, respectively, placed 10 cm above the ground, at the same height of the LWS. Wind speed and wind direction were measured using a Davis Cup Anemometer (by Decagon Devices, USA) with 1 mph and 1° resolutions, respectively, placed 300 cm above the ground. Soil moisture and temperature were measured using a GS-3 sensor (by Decagon Devices, USA) with 2% volumetric water content and 0.1 °C temperature resolutions, respectively, placed 1 cm below the soil surface. All the sensors were plugged into the data ports of EM50 Data Loggers to simultaneously record the measured values at a uniform interval of 15 min for three years (from 1 January 2014 to 31 December 2016). Figure 3 shows the mounting positions of all sensors.
2.4. Data Processing
2.4.1. Dew Amount
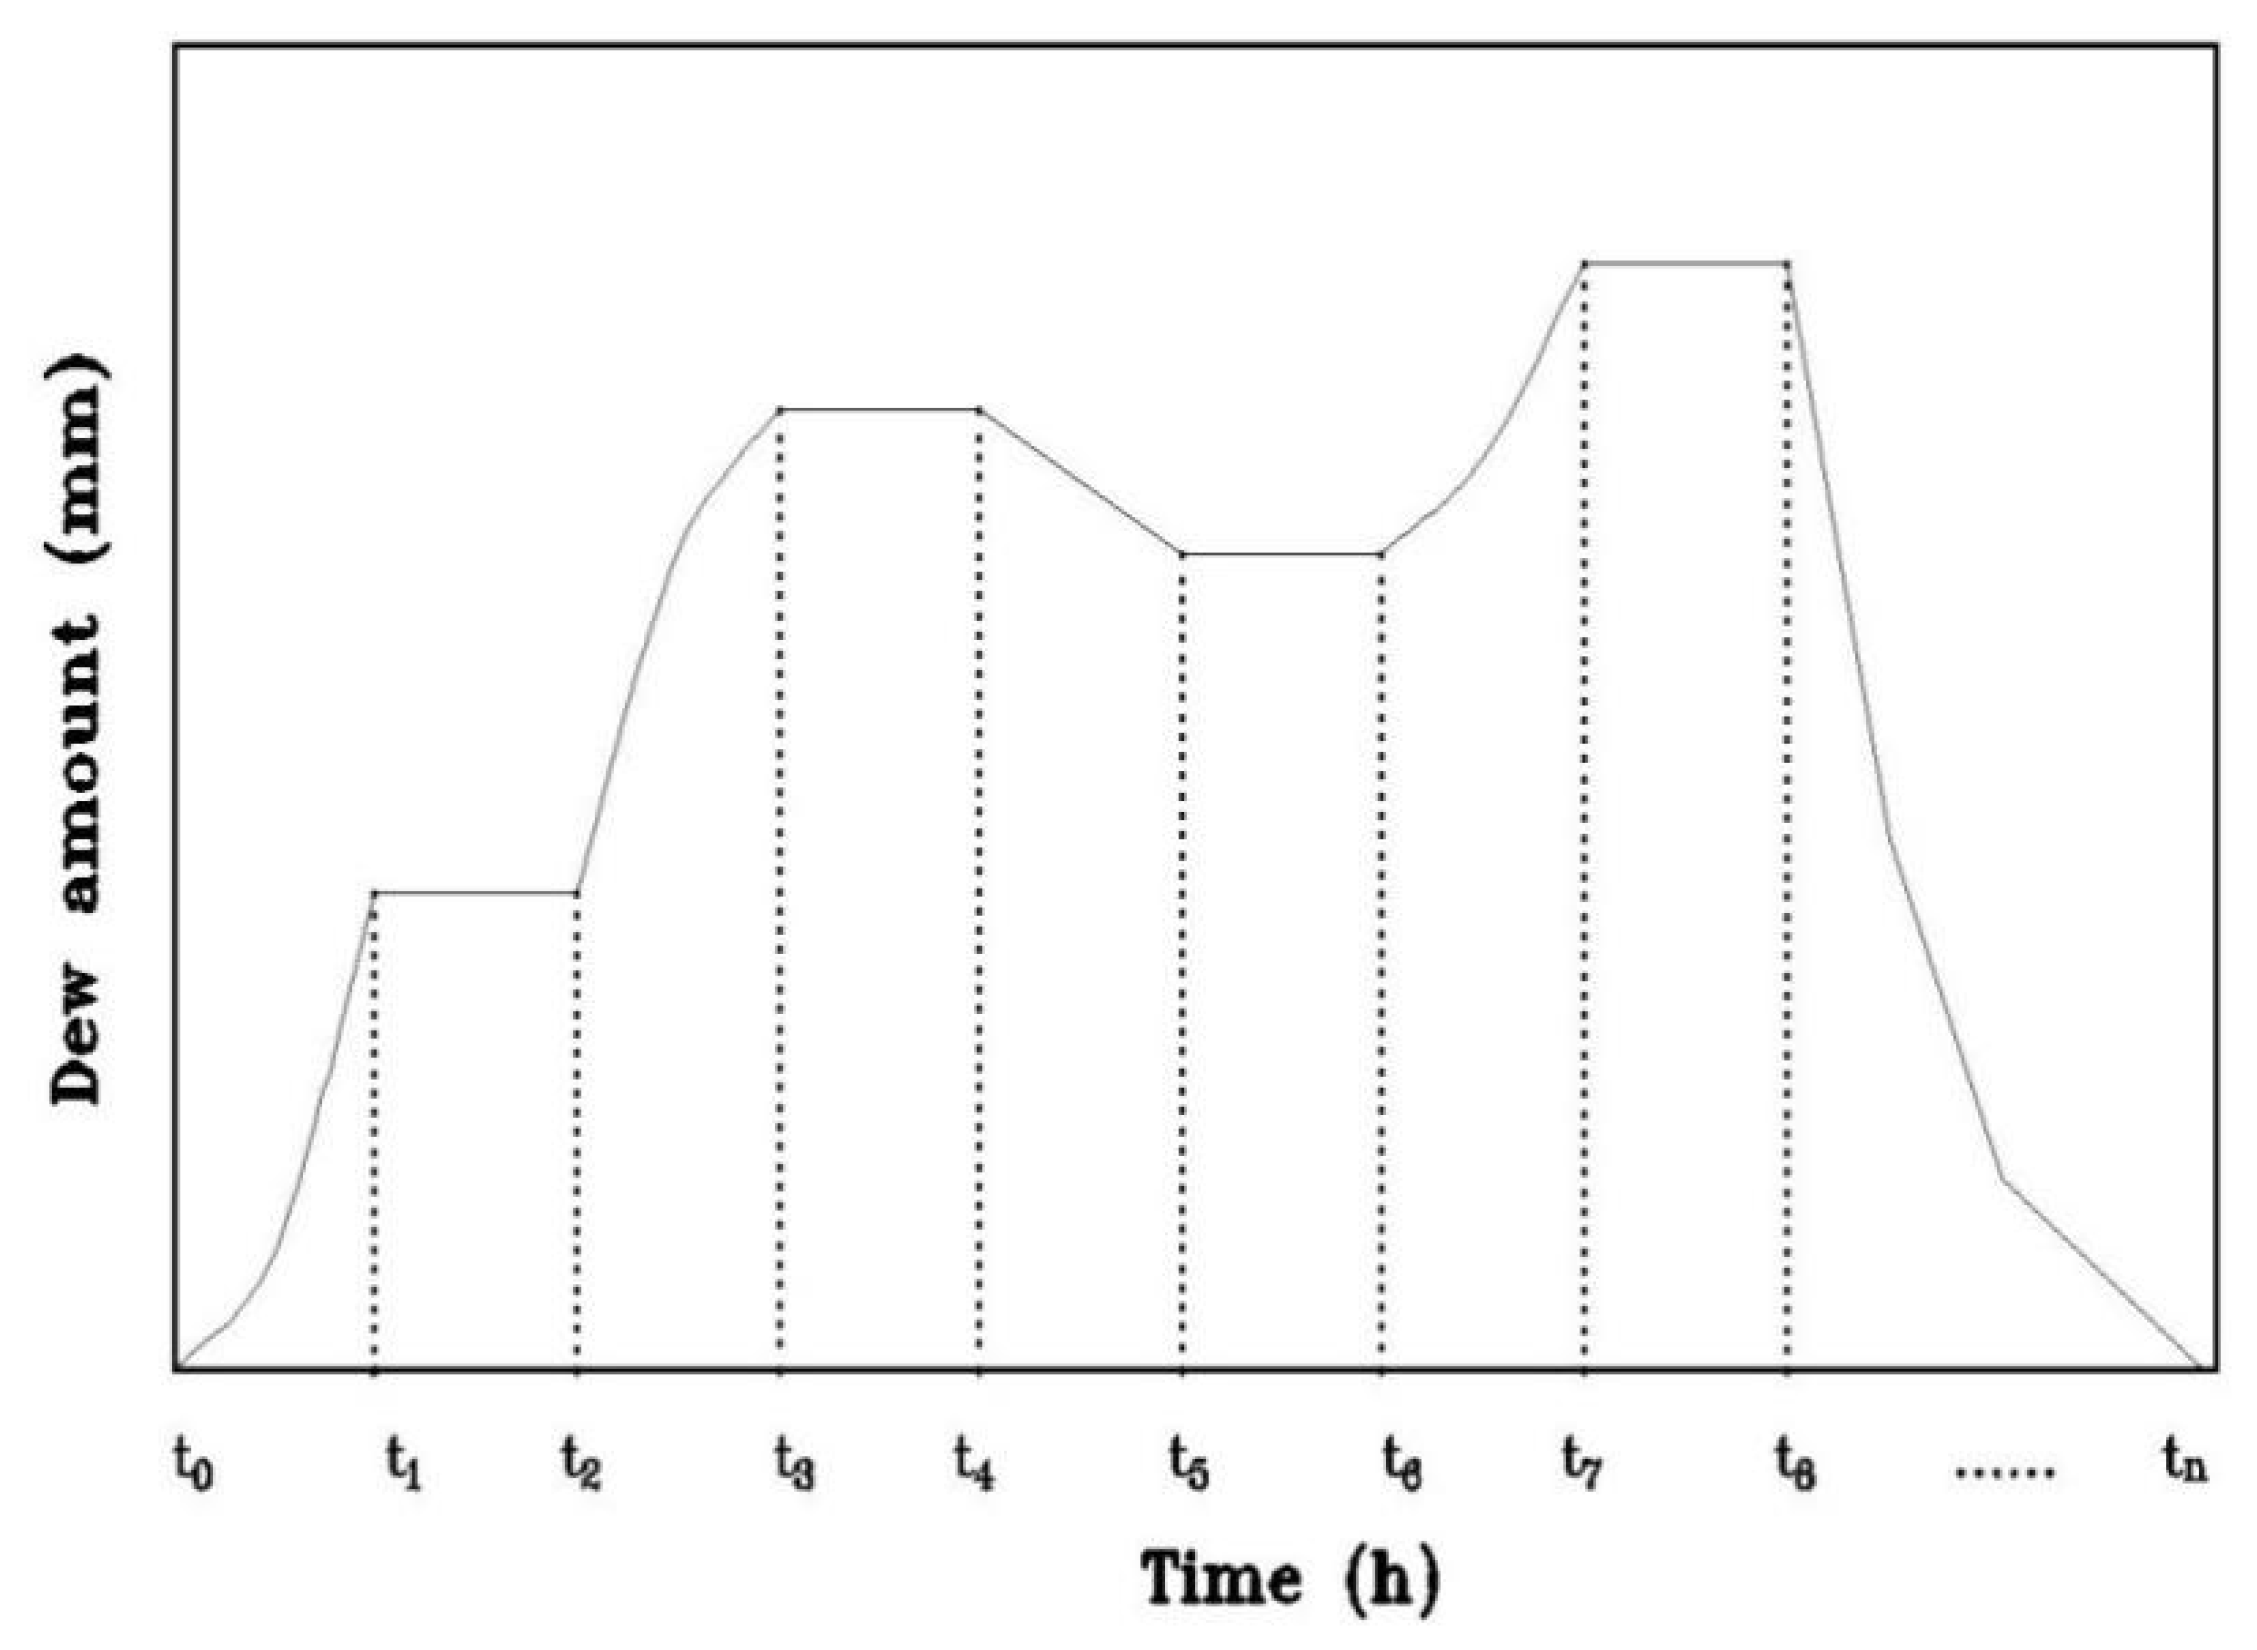
The measured dew amount by LWS reflects the cumulative amount of dew over a continuous wet period. Due to the effect of evaporation, the cumulative amount may increase or decrease in the process, as shown in Figure 4. The rising periods, e.g., from t0 to t1, t2 to t3, and t6 to t7, indicate a greater condensation rate than evaporation rate; the horizontal periods (such as t1–t2, t3–t4, t5–t6, t7–t8) indicate equal rates; and the decreasing periods (such as t4–t5) indicate greater evaporation than condensation rates.
In this study, the net dew amount is calculated with the effect of natural evaporation using the following equation:
where ti is the ith period of time (hour), D(ti) is the accumulated water amount on the surface of the LWS, d(ti) is the net dew amount between ti − 1 and ti. Thus, neglecting evaporation in the calculation, the resulting dew amount measured by LWS is less than the actual value. However, this result can be regarded as available dew amount, because dew mainly occurred at night with unavoidable but low levels of evaporation rates.
The cumulative dew amount from initial time (t0) to current period (ti) (mm) is calculated using
where A(ti) is the cumulative dew amount from initial time (t0) to current period (ti) (mm), tj is the jth period of time (hour).
In order to study the daily patterns of dew, a hydrologic dew day (HDD) is defined here to start on day one and end on day two at 16:00, which is the most unlikely time for dew condensation in the 24-h period. It is also assumed in this study that dew does not occur on rainy, foggy or snowy days. Thus, the wet periods indicated by LWS on the no-dew days are not counted as dew periods. The daily, monthly, seasonal, and annual dew amounts are calculated using Equation (3).
2.4.2. Dew Intensity
Dew intensity is the hourly dew amount, and it can be calculated using
where DI (mm/h) is the cumulative dew amount in any hour from initial time (e0) to final period (em), ek is the kth period of time in the hour by the datalogger.
2.4.3. Dew Frequency
Dew frequency in a day is defined as the ratio of the number of dew-producing time periods (with rising dew amount as shown in Figure 4) to the total possible number of observation periods or records.
where, fi is dew frequency (%) for the ith period of a day, ni is the number of recording periods when the dew amount is rising, or when the condensation rate is greater than the evaporation rate, as shown in Figure 4, and N is the total number of possible monitoring periods. As the interval of datalogger records is 15 min in this study, there are four possible records in an hour, and the total number of records in a day is N = 96.
2.4.4. Dewpoint Temperature
2.4.5. Wind Speed
Wind speed was measured by a Davis Cup Anemometer at 3 m above the ground surface. In order to correlate with standard measurements at 10 m above the ground, the data were corrected by using a classical logarithmic variation [29,45].
where zc (m) is the roughness length and taken as equal to 0.1 m, (m/s) and (m/s) are wind speeds at different heights of z1 (m) and z2 (m), respectively. By Equation (7), the relationship between wind speeds at heights of z1 = 10 m and z2 = 3 m was determined to be
3. Results
3.1. Daily Variation of Dew
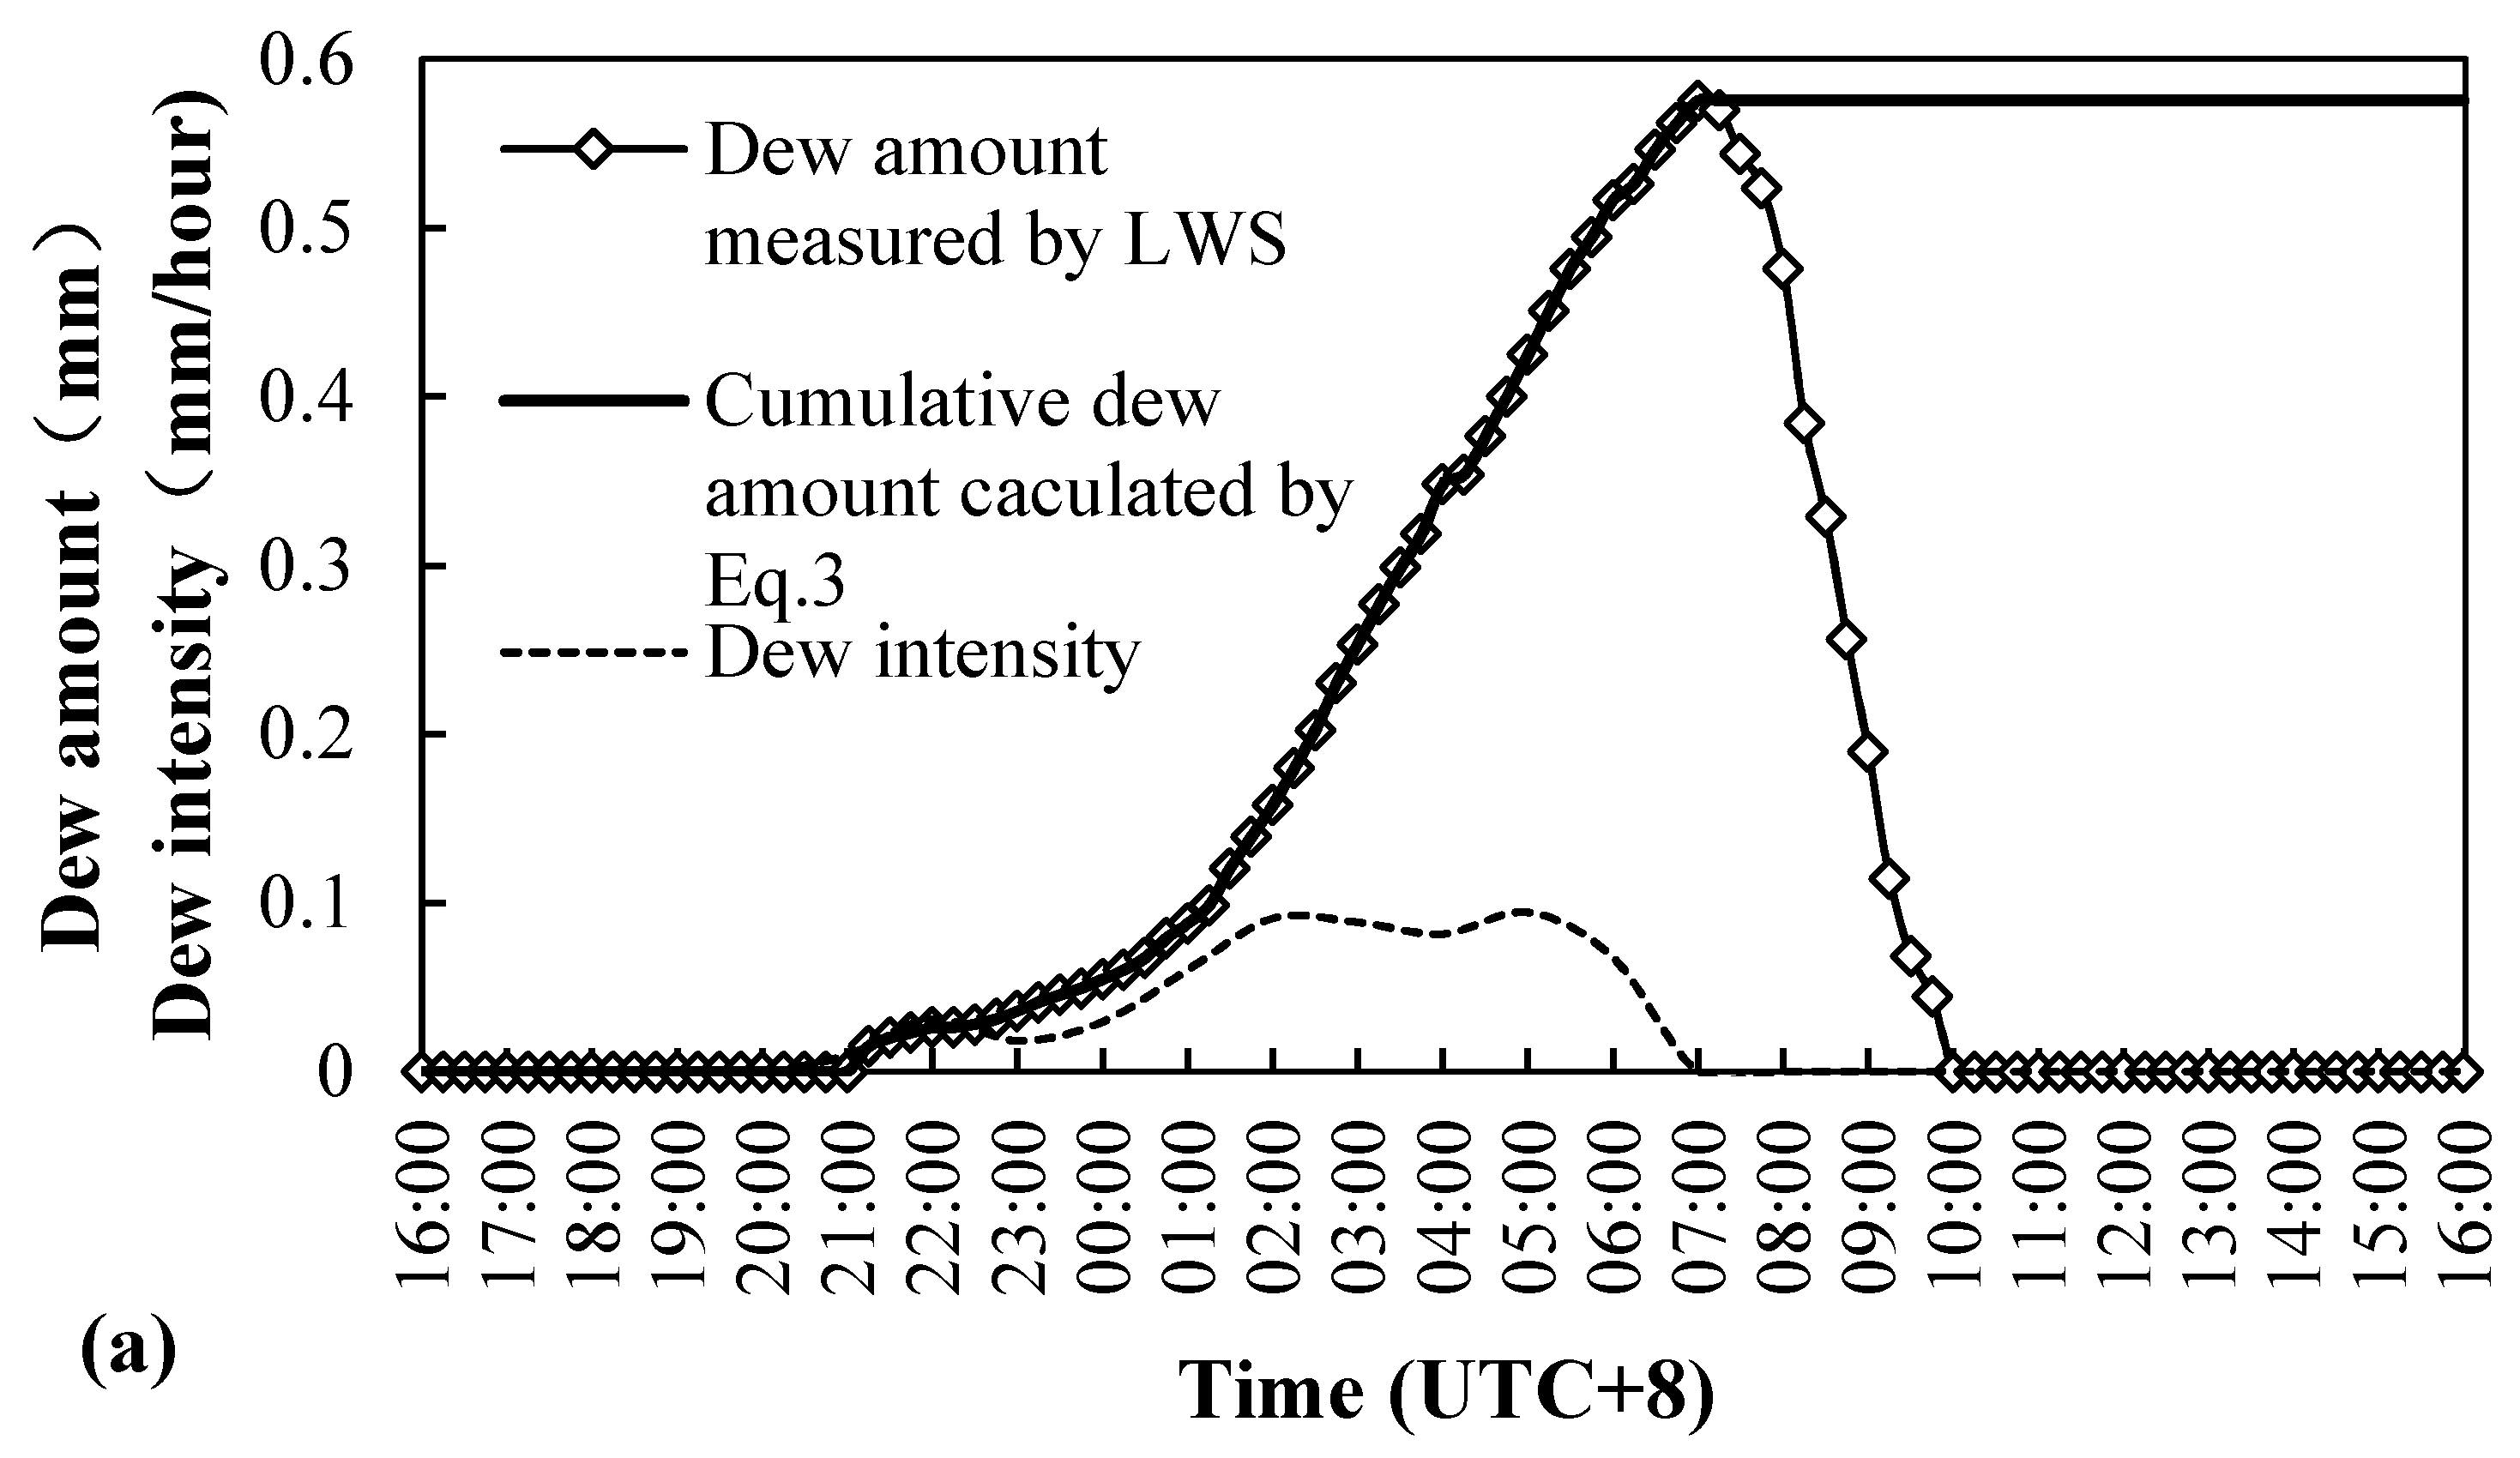
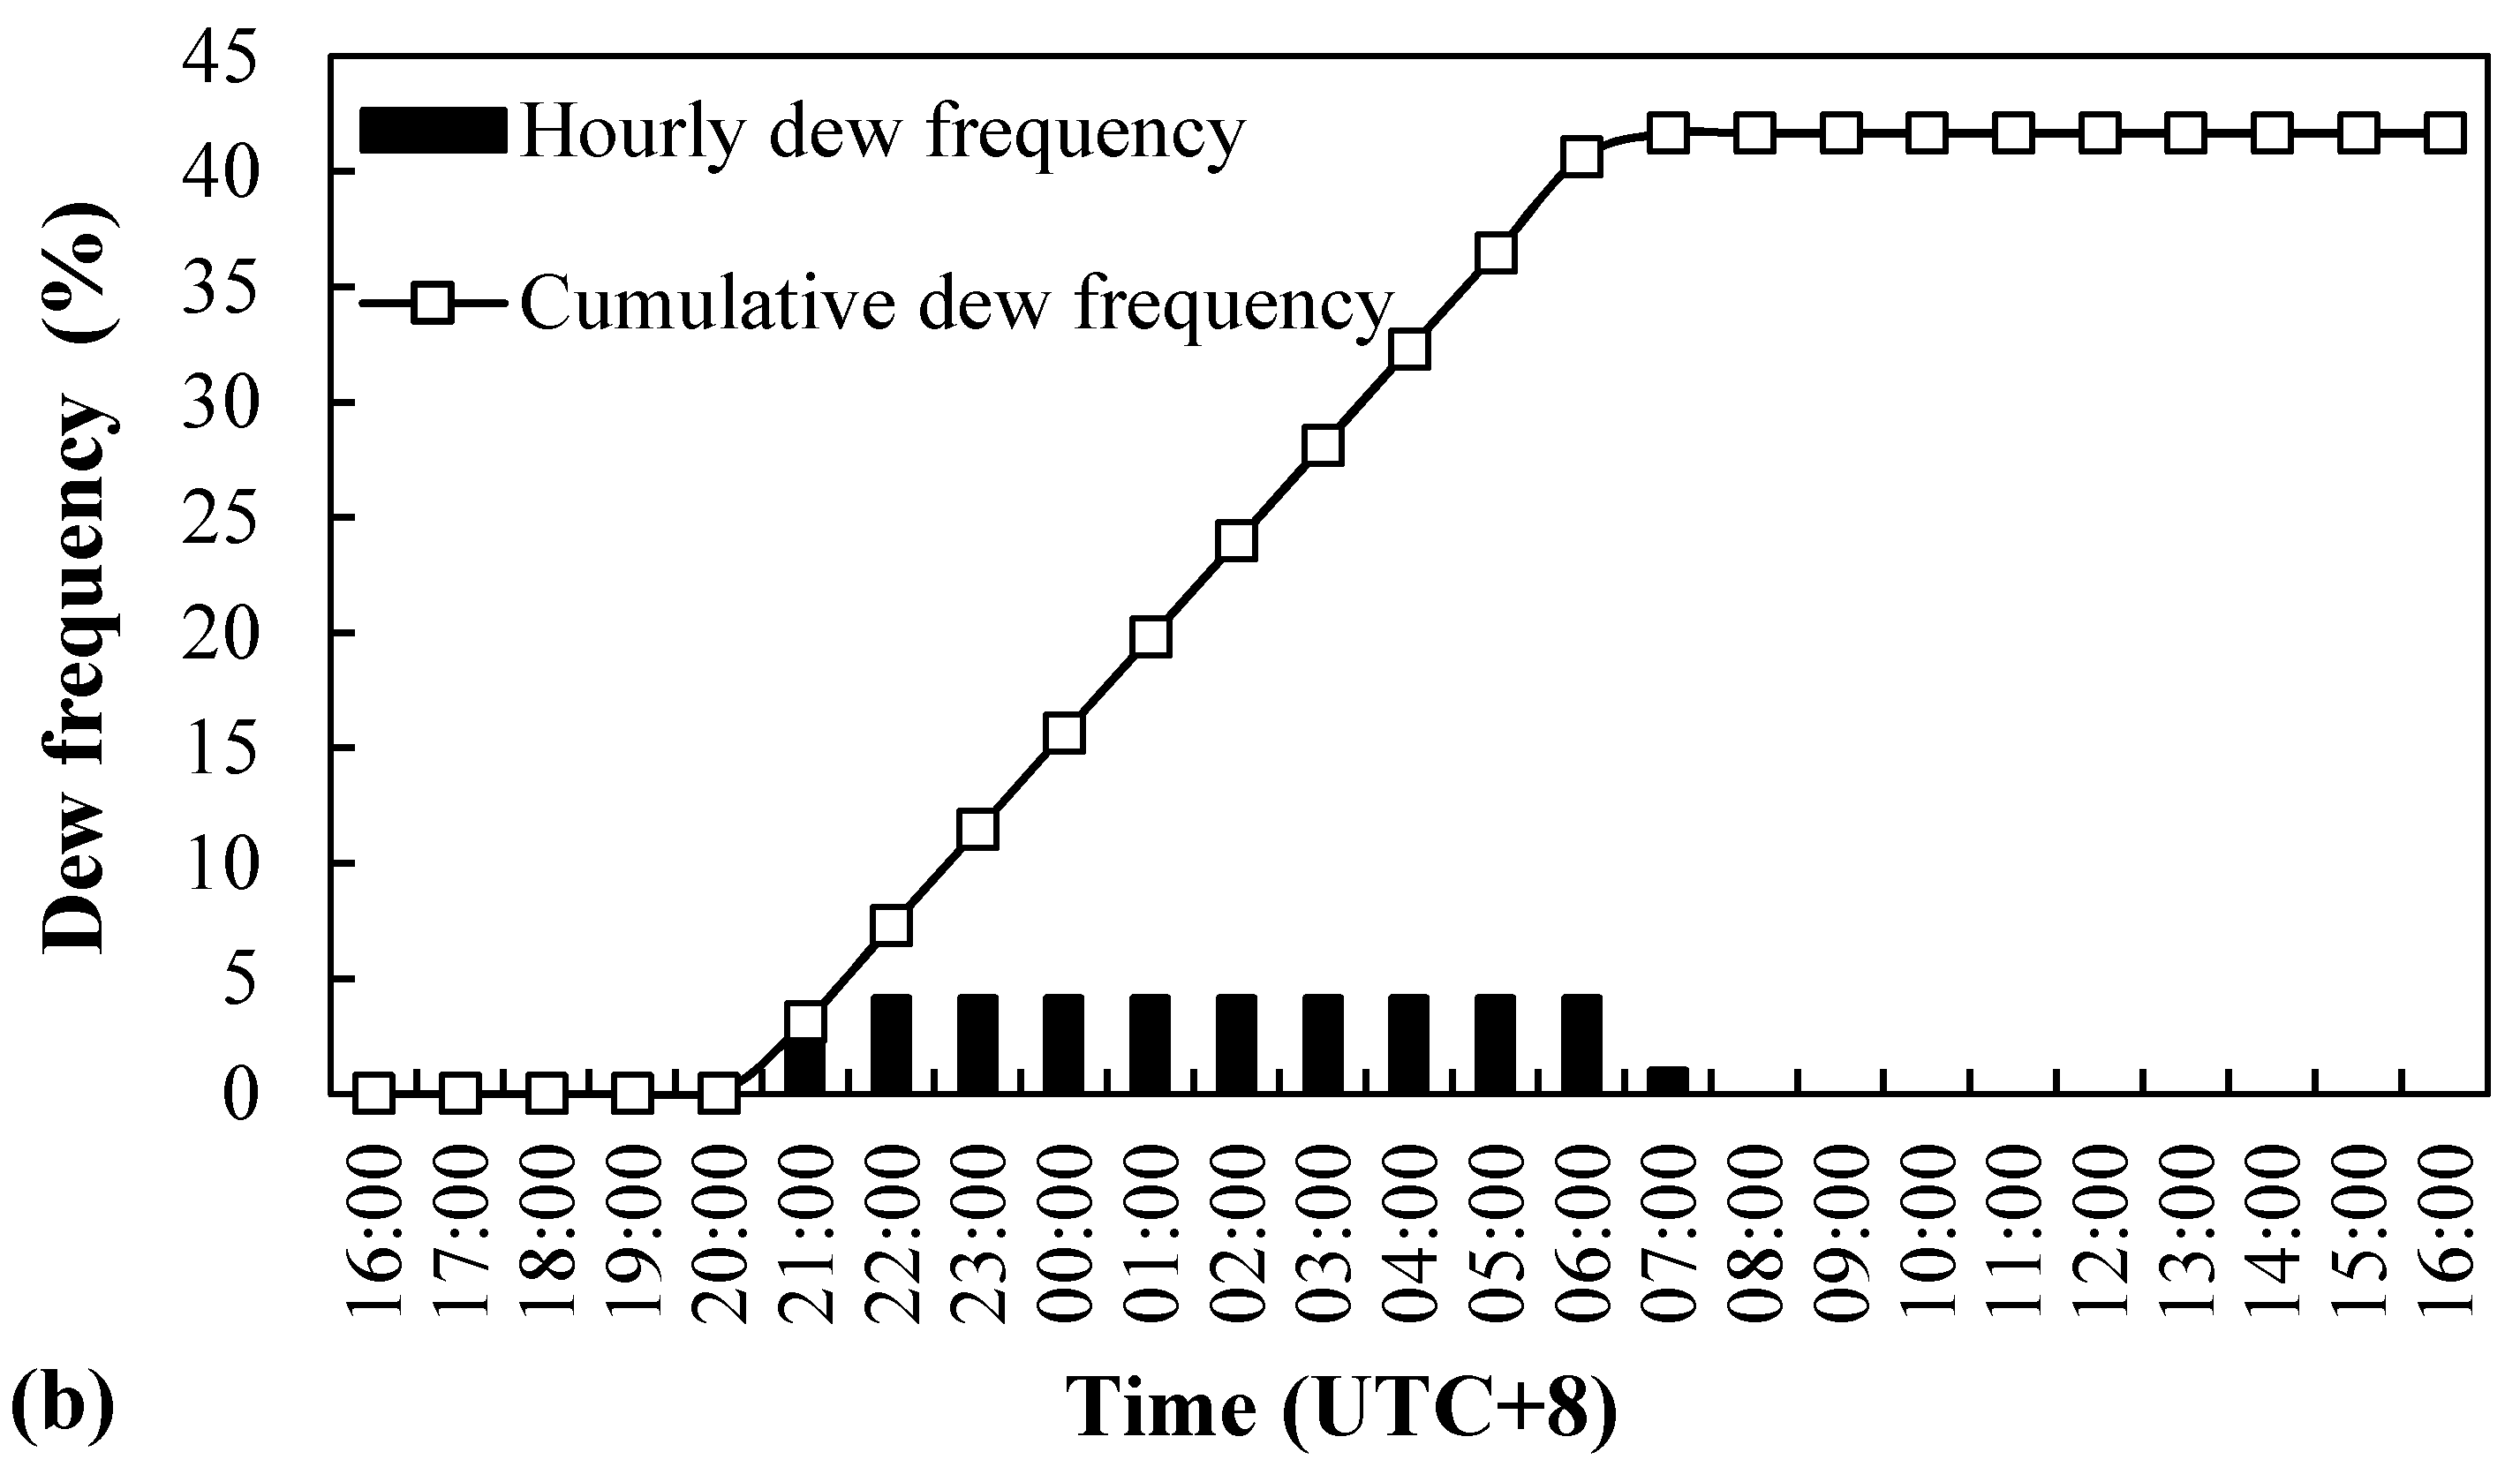
Figure 5 shows a typical daily process of dew formation (on 24–25 September 2015). Figure 5a shows the recorded dew amounts in mm and the calculated dew intensity (mm/hour) in a typical hydrologic dew day. Figure 5b shows the corresponding daily dew frequency distributions. It is clear that dew existed on the LWS for 13 h from 21:00 to 10:00 the next day, but really accumulated between 21:00 and 7:00 when the dew amount was rising. The maximum net dew amount for the day was 0.58 mm and the maximum dew intensity was 0.09 mm/h. As shown in Figure 5b, the dew frequency, in 24 bins (each contains equal or less than four rising periods) over the daily possible number of measurements (96), obviously began to increase at 21:00. It reached the highest frequency of 4/96 or 4.2% from 22:00 on till 6:00 the next day, and then decreased to 0 by 7:00. The maximum cumulative dew frequency reached 42%, or about 10 h in a day.
3.2. Seasonal Variation of Daily Dew
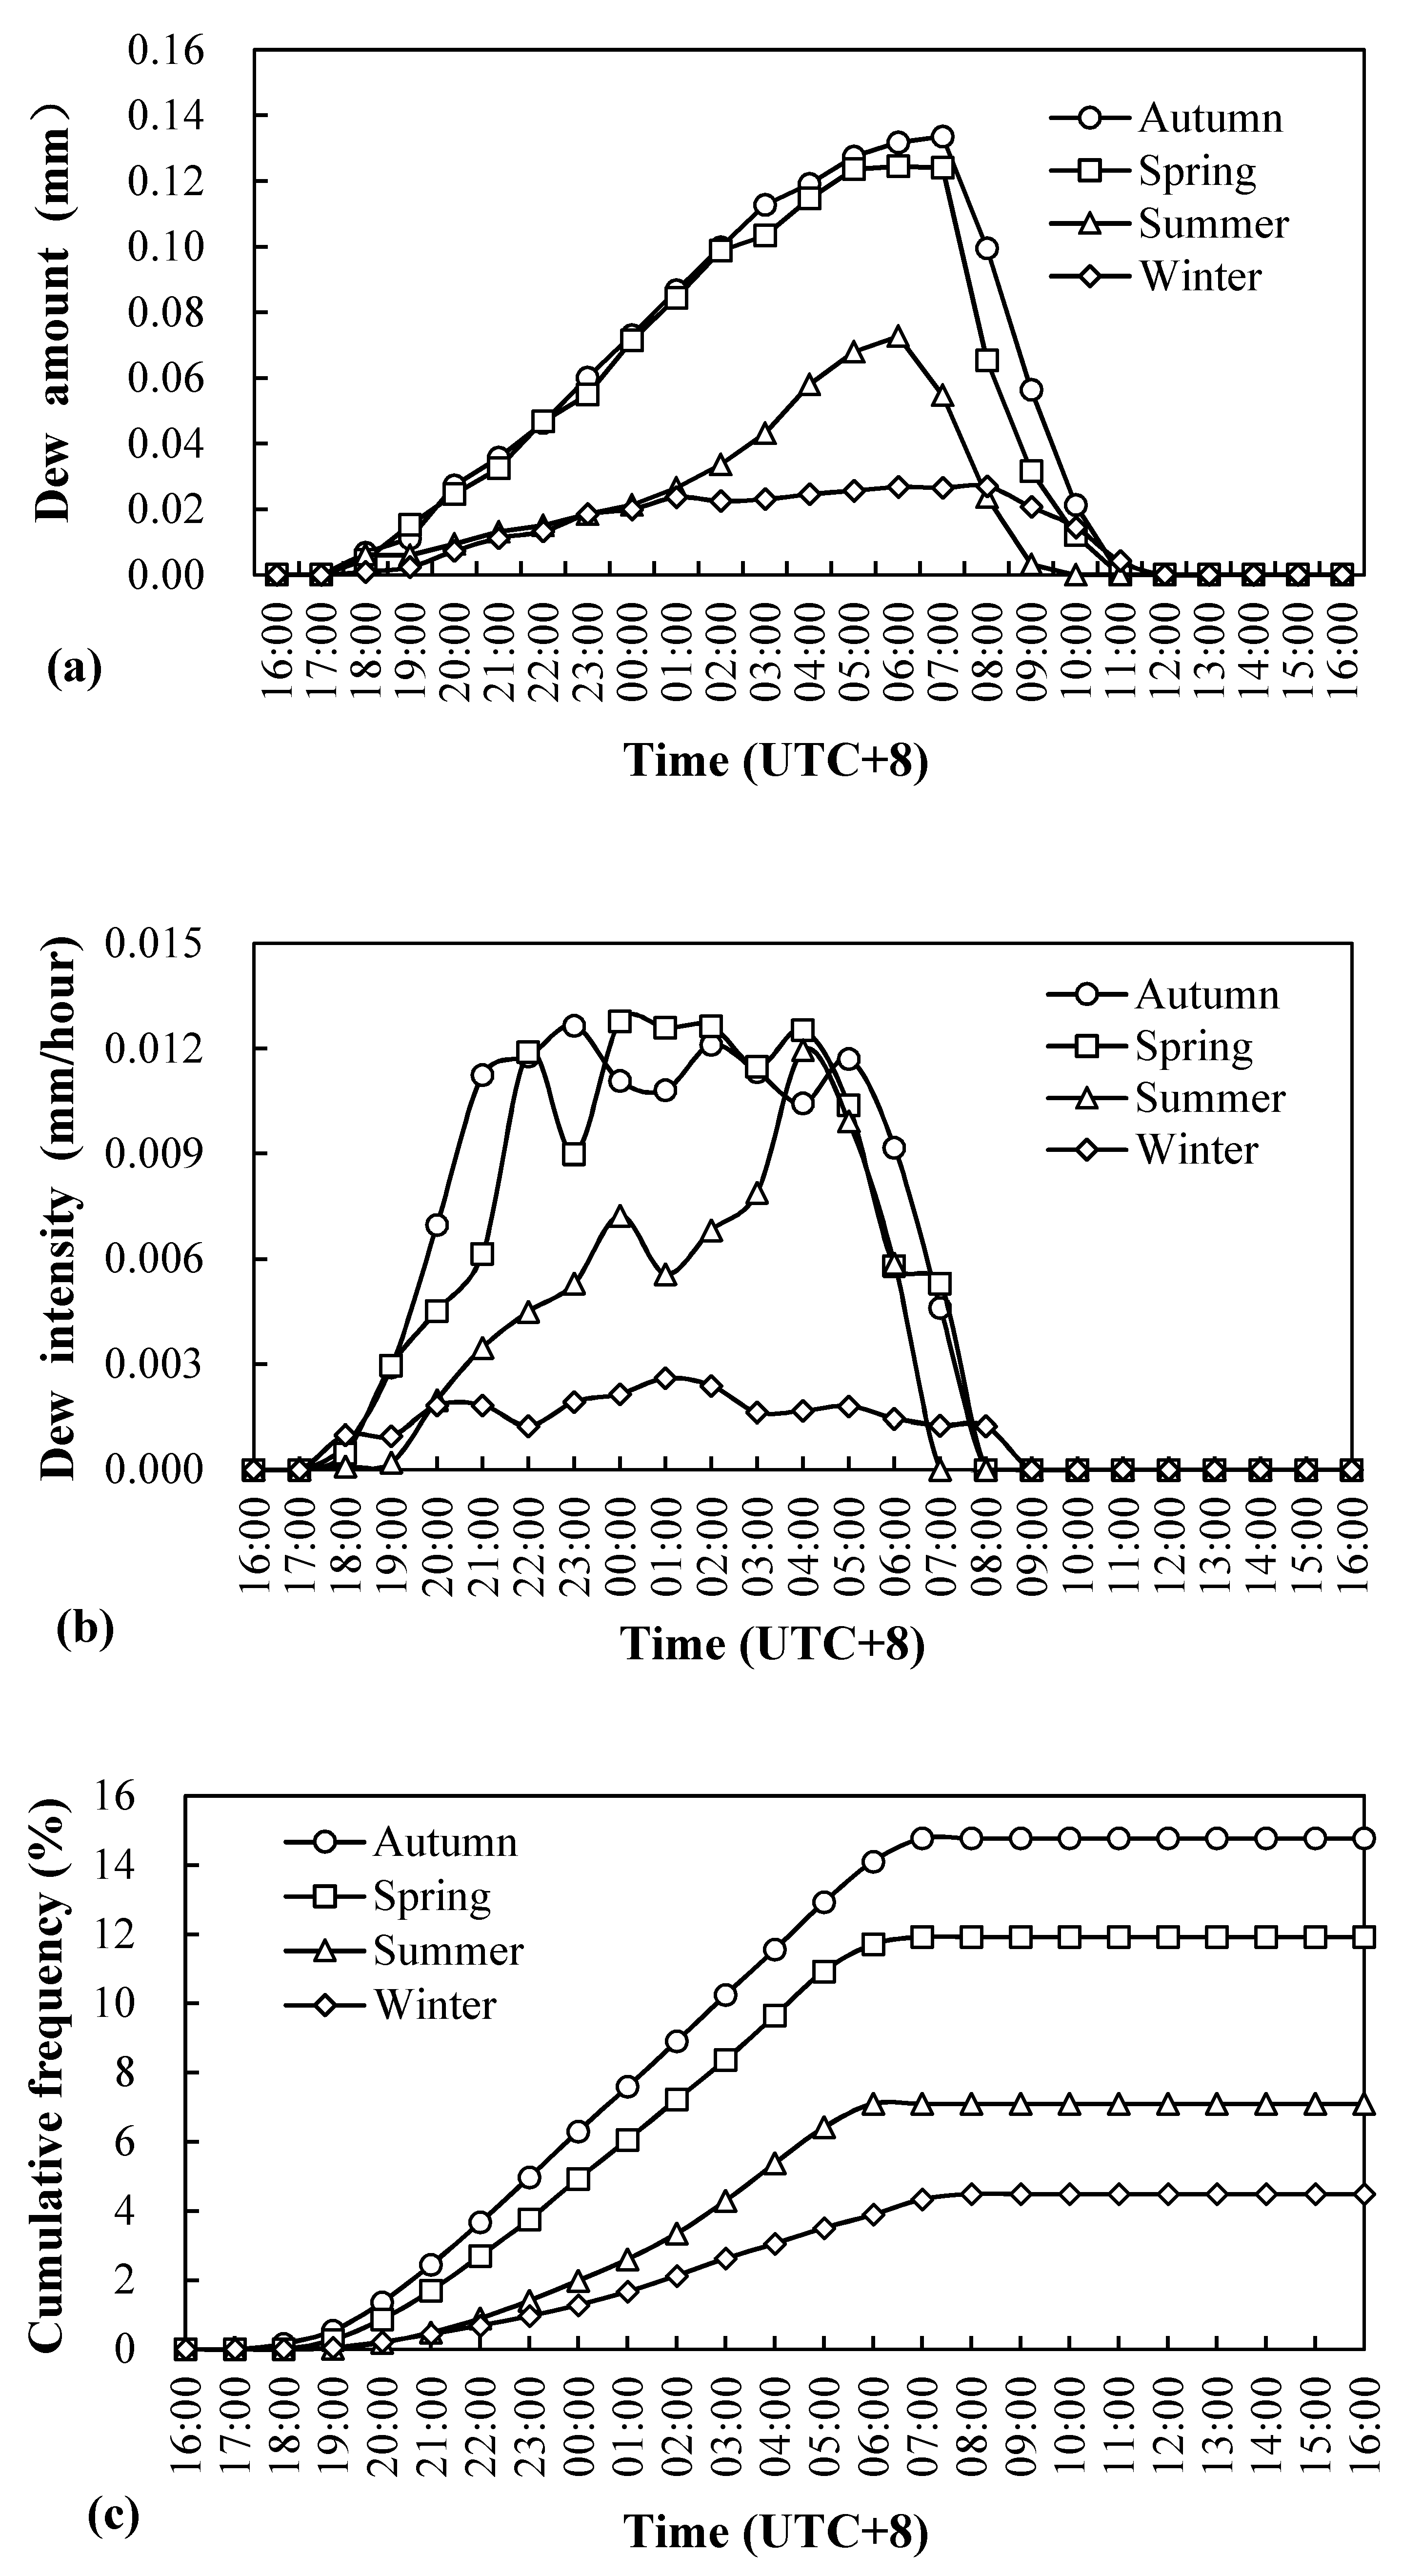
Figure 6 shows the averaged seasonal daily variations of dew amount (Figure 6a), dew intensity (Figure 6b), and cumulative frequency (Figure 6c). Although the same daily trends are observed, there are striking differences in dew behaviors in different seasons. The overall dew amount, intensity, and frequency are highest in autumn, followed successively by spring, summer, and winter.
As shown in Figure 6a, dew started to accumulate at 17:00 in spring, summer, and autumn, and at 18:00 in winter. The largest net amount of dew was reached at 7:00 in autumn and spring, 6:00 in summer, and 8:00 in winter. The maximum duration of dew, or the maximum residence time on the LWS, is about 18 h in spring and autumn, starting at 17:00 and ending at 11:00; it is 17 h in summer, from 17:00 to 10:00, due to the higher evaporation rate; in winter, it is 18 h again, starting at 18:00 and ending at noon, due to the lower evaporation rate. As shown by the peak values in Figure 6a, the highest average daily dew amount was 0.134 mm/day in autumn (the number of days, N, was 273, and the standard variance, δ, was 0.167), followed by 0.124 mm/day in spring (N = 276, δ = 0.136), and 0.073 mm/day in summer (N = 276, δ = 0.126), and the minimum 0.027 mm/day in winter (N = 270, δ = 0.07).
As shown in Figure 6b, dew was mainly produced between 17:00 and 7:00 in spring and autumn (the rising periods in Figure 6a) with the highest dew intensity of 0.013 mm/hour between 21:00 and 6:00. In summer, dew was mainly accumulated from 21:00 to 6:00 with the highest intensity of 0.012 mm/hour occurring only at 4:00. In winter, the dew intensity was maintained at much lower values below 0.003 mm/hour for a longer period from 18:00 to 8:00.
As shown in Figure 6c, the averaged cumulative dew production frequency (the ratio of the number of dew-producing time periods in an hour to the total number of records in the day, as shown in Figure 5b) followed the same trend of the dew amount as in Figure 6a. The season-averaged maximum cumulative frequencies are 15% in autumn (equivalent to 3.6 h/day), 12% in spring (2.88 h/day), 7% in summer (1.6 h/day), and 4.5% in winter (1.08 h/day).
3.3. Annual Variation of Dew Occurrence
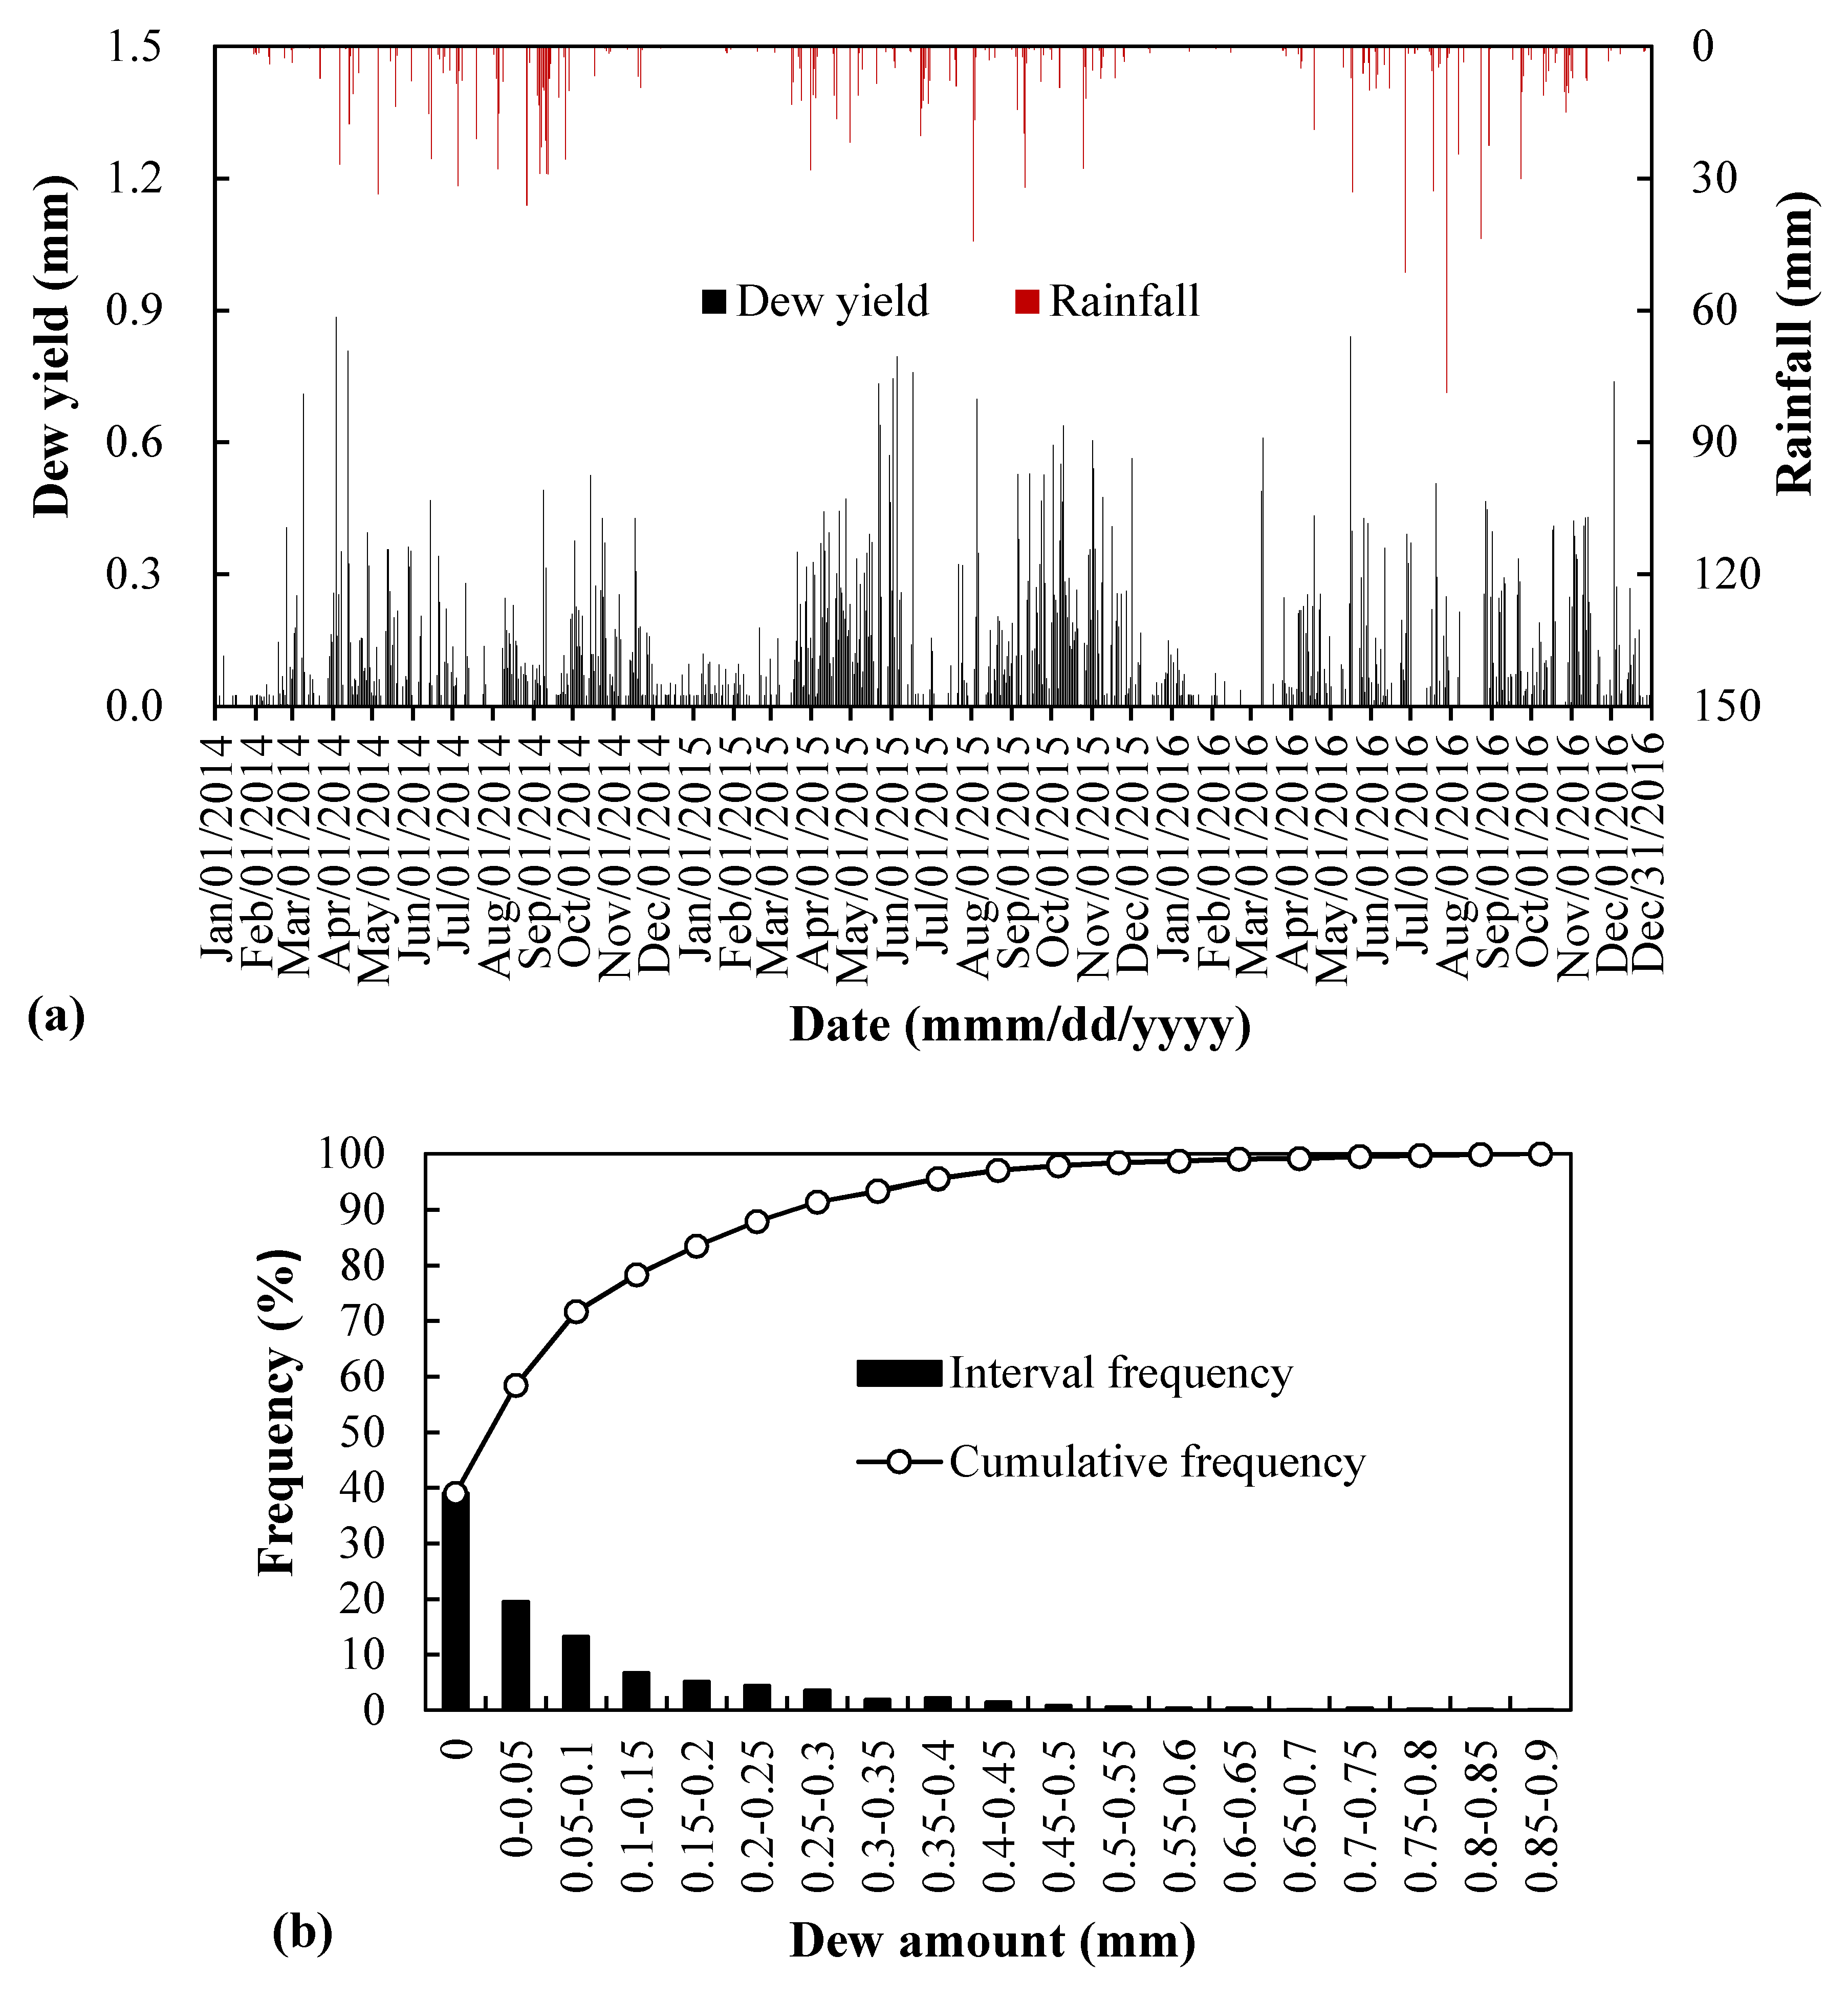
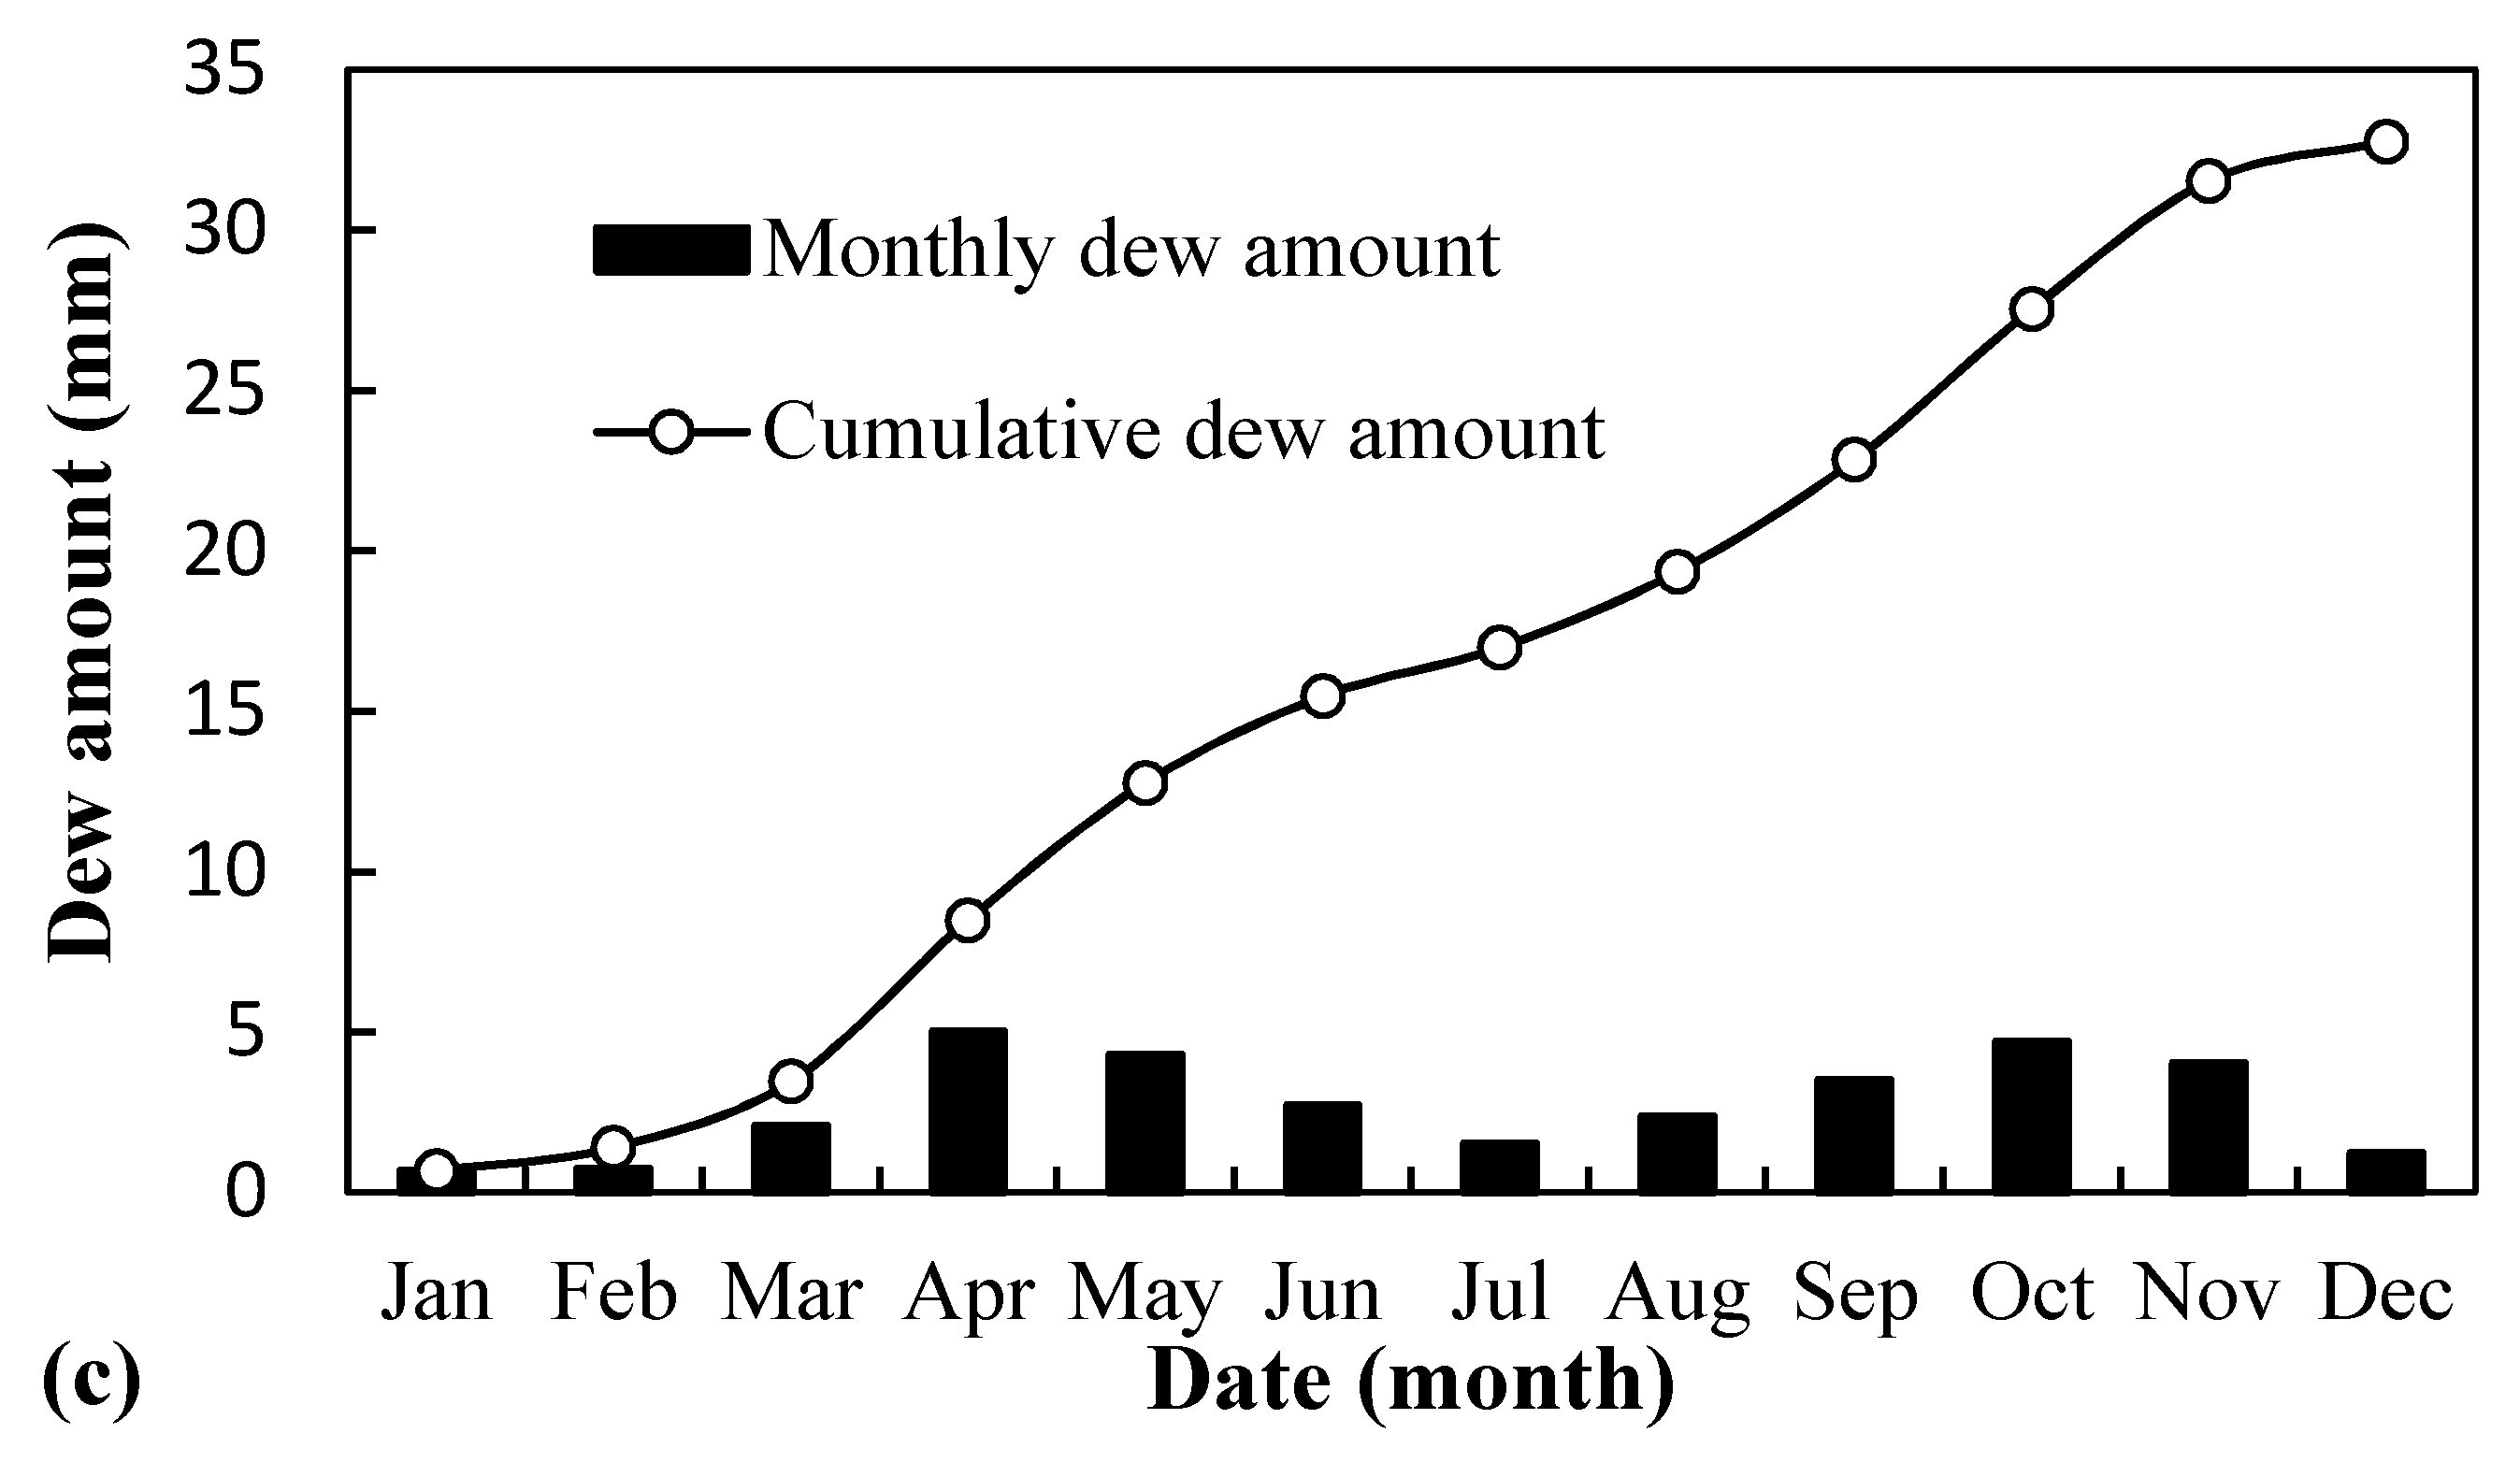
Figure 7 shows the variation and distribution of dew amount in the entire monitoring period from January 2014 to December 2016. The daily dew amount varied between 0 and 0.88 mm (Figure 7a), which is extremely skewed toward smaller values of 0–0.1 mm (Figure 7b). Days of no-dew (including rain days) accounted for 39% of the total monitoring days. Days of any dew with amount below 0.05 mm accounted for 20%. Days of dew amount between 0.05 and 0.5 mm accounted for 39%. Thus, the days of daily dew amount greater than 0.5 mm only accounted for 2%. The average daily dew amount was 0.09 mm (N = 1095, δ = 0.139). As shown in Figure 7c, the monthly dew amount peaked in April–May and October–November, whereas the two valleys occurred in January–February and July. Thus, the optimal time for harvesting dew as an alternative source of water should be in the April–May and October–November periods.
3.4. Dew versus Rain
3.4.1. Dew Days
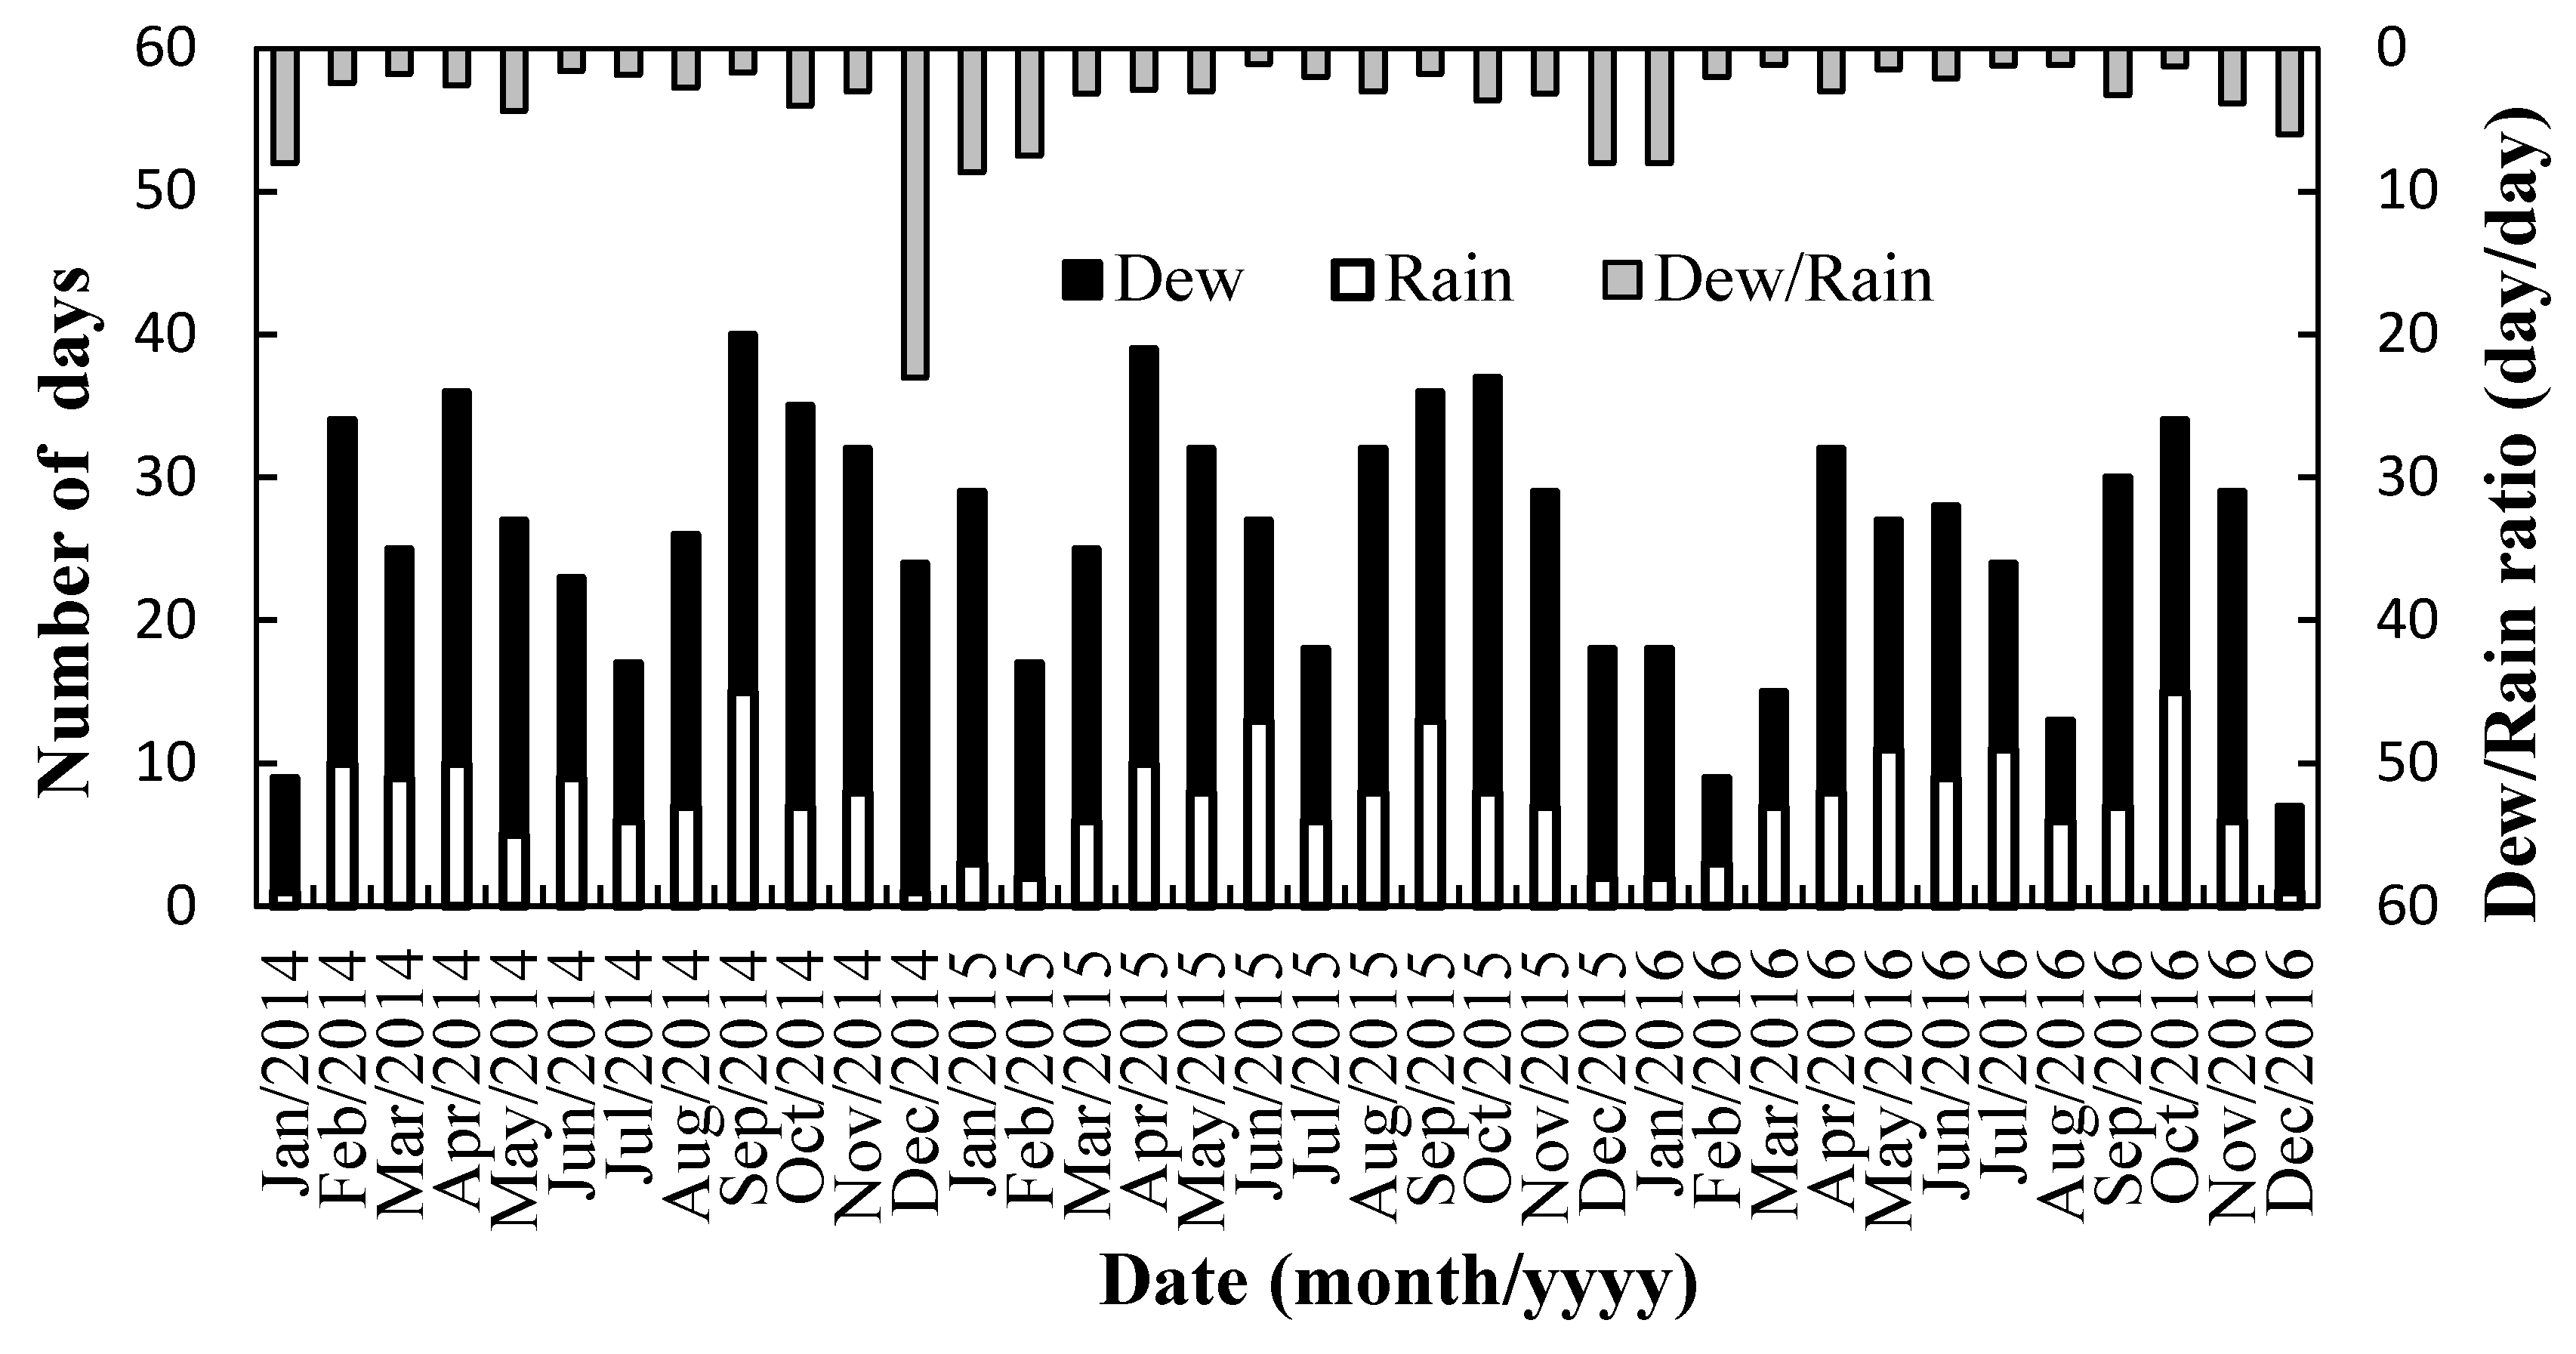
Figure 8 shows that the number of monthly dew days is always greater than that of rain days. The maximum difference was 23 dew days versus 1 rain day in December 2014, which means that dew occurred as often as all the “week days” of that month. The number of dew days in 2014, 2015, and 2016 was respectively 240, 253, and 180 days, whereas the number of rain days was 88, 86, and 86, respectively. Thus, the average annual number of dew days is about 2.6 times that of rain days.
3.4.2. Dew Amount
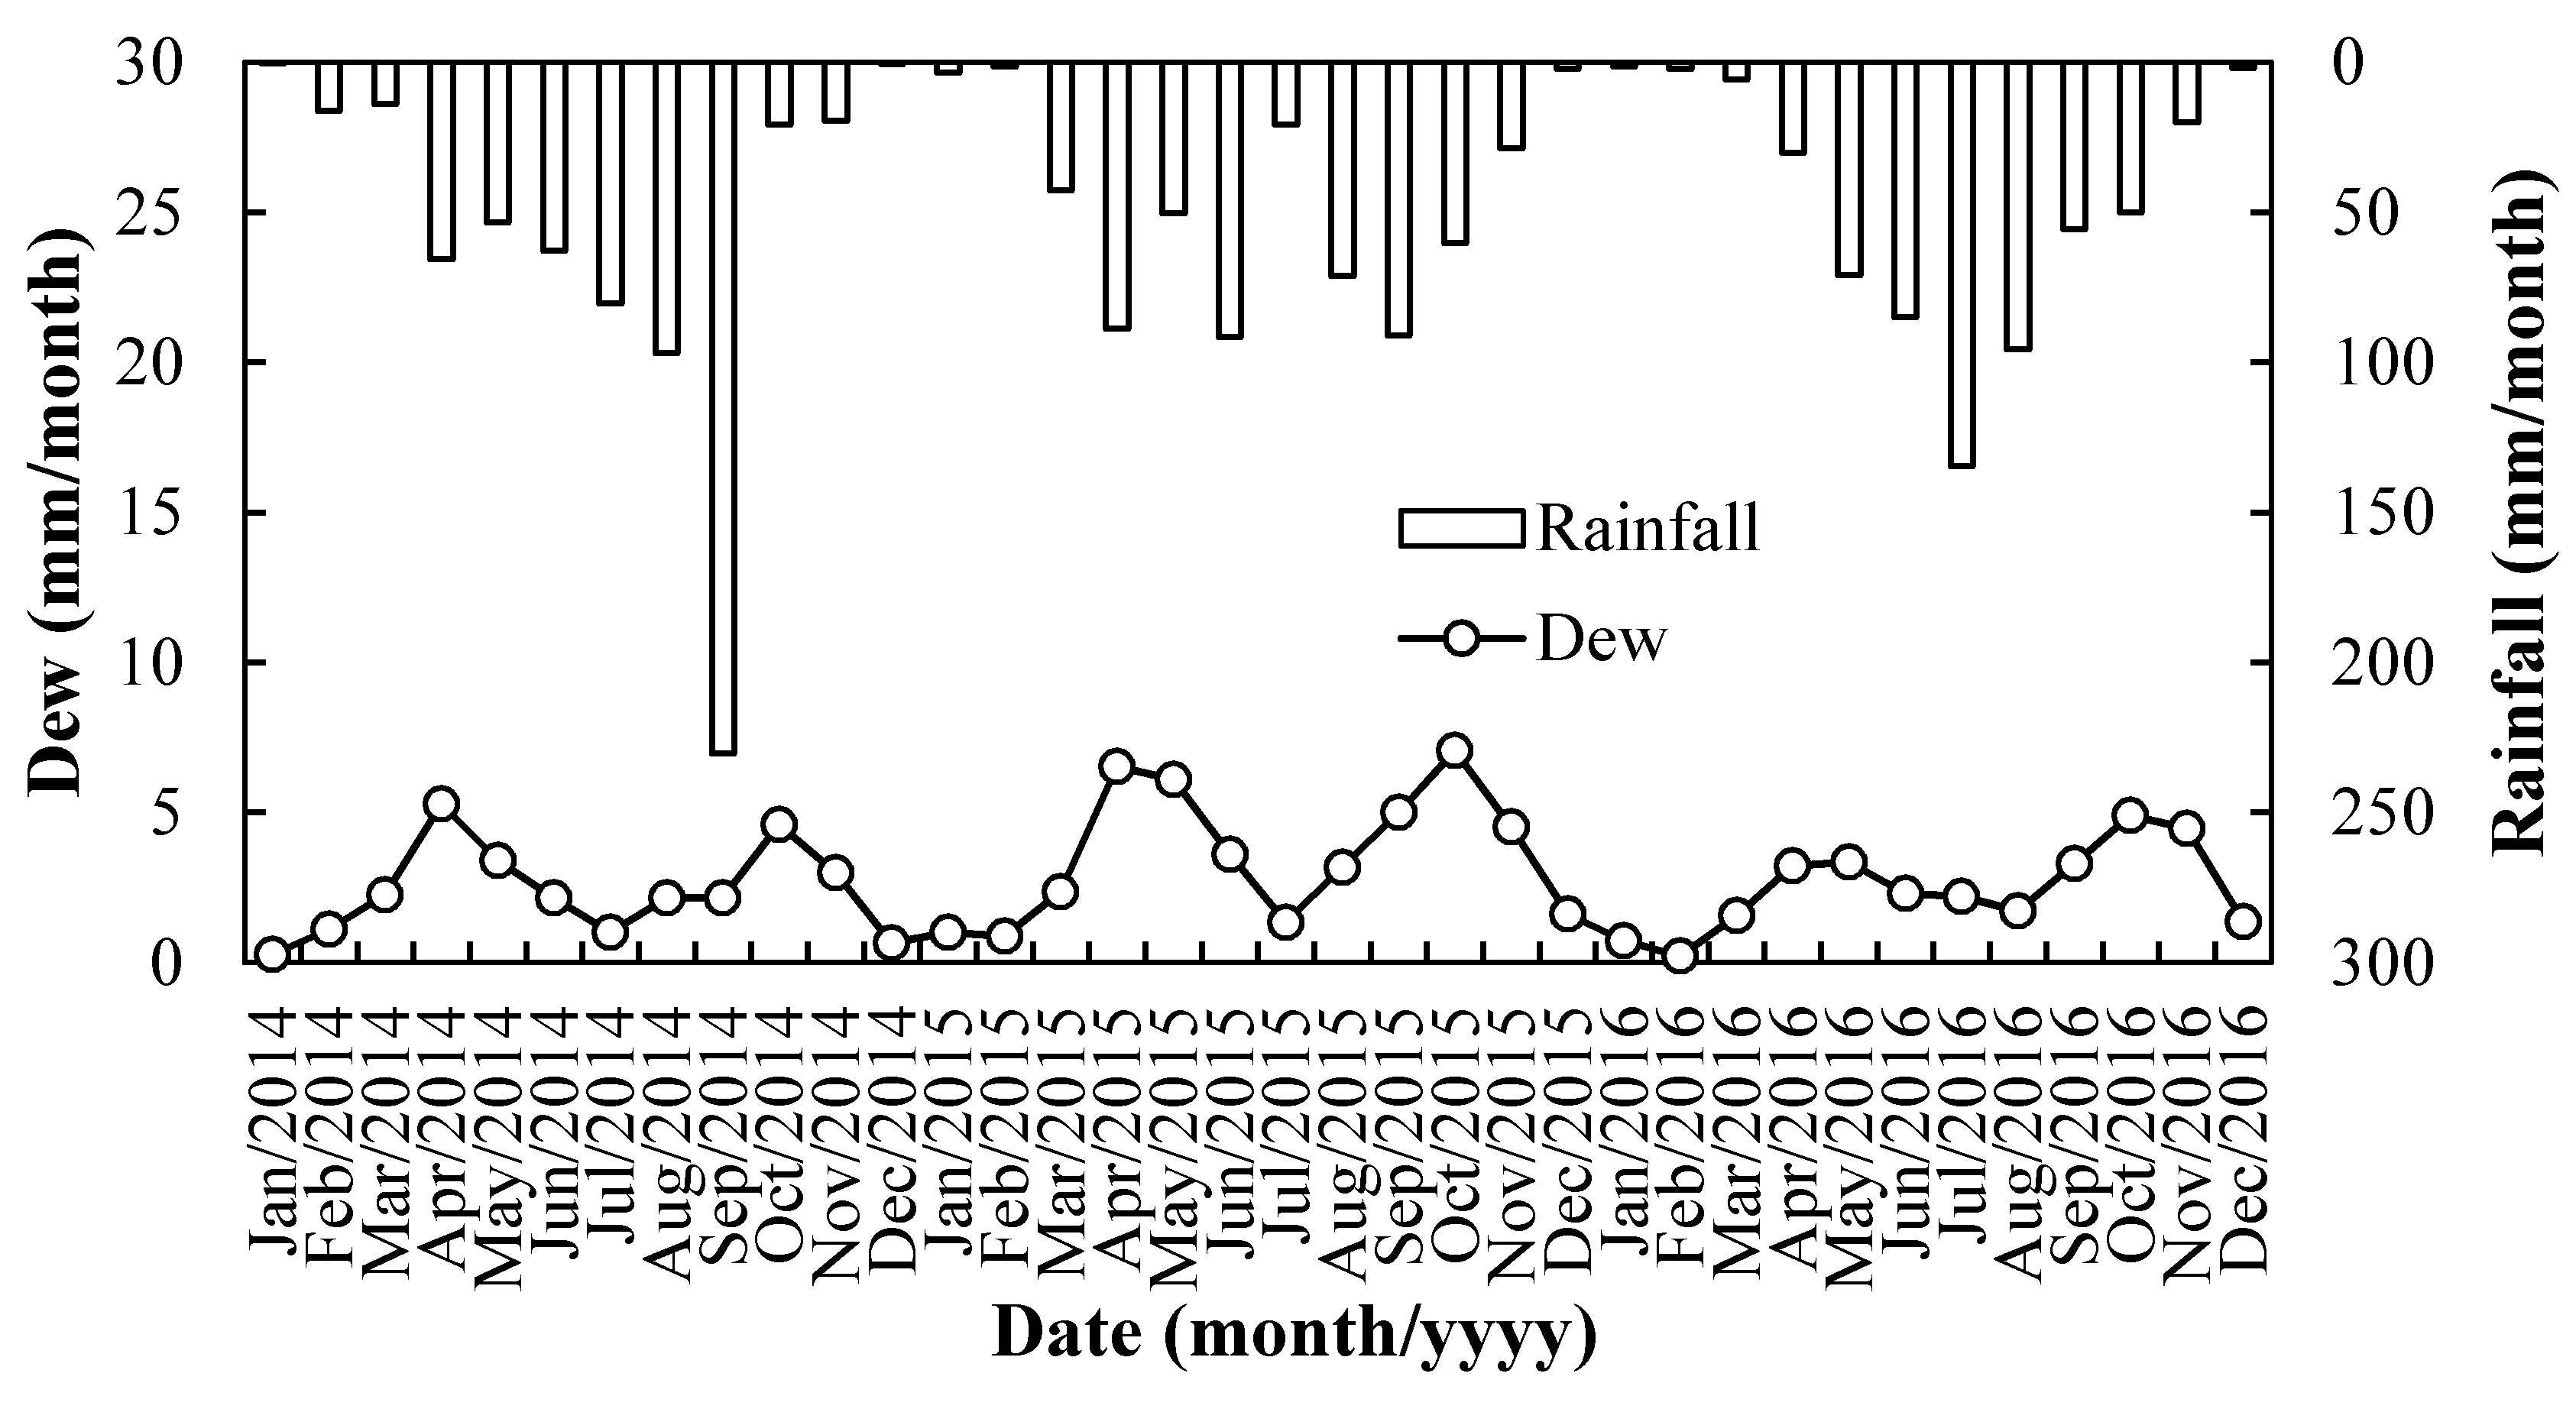
Figure 9 shows the monthly amount of dew versus rain. The dewfall is about an order of magnitude less than the rainfall. The total amount of dew in 2014, 2015, and 2016 was 28.1, 43.3, and 26.9 mm, respectively, and the total rainfall was 660.2, 551.6, and 598.2 mm, respectively. The average annual rainfall (603.3 mm) was 18 times that of the average annual dewfall (32.8 mm).
3.5. Factors Influencing the Formation of Dew
In order to determine the relative influences of the measured meteorological and soil parameters on dew amount, regression analyses were conducted to find significant correlations between daily dew amount and the following parameters (averaged during the dew production period): relative humidity, difference between air temperature and dewpoint temperature, wind speed, wind direction, surface soil moisture, and soil temperature.
3.5.1. Relative Humidity
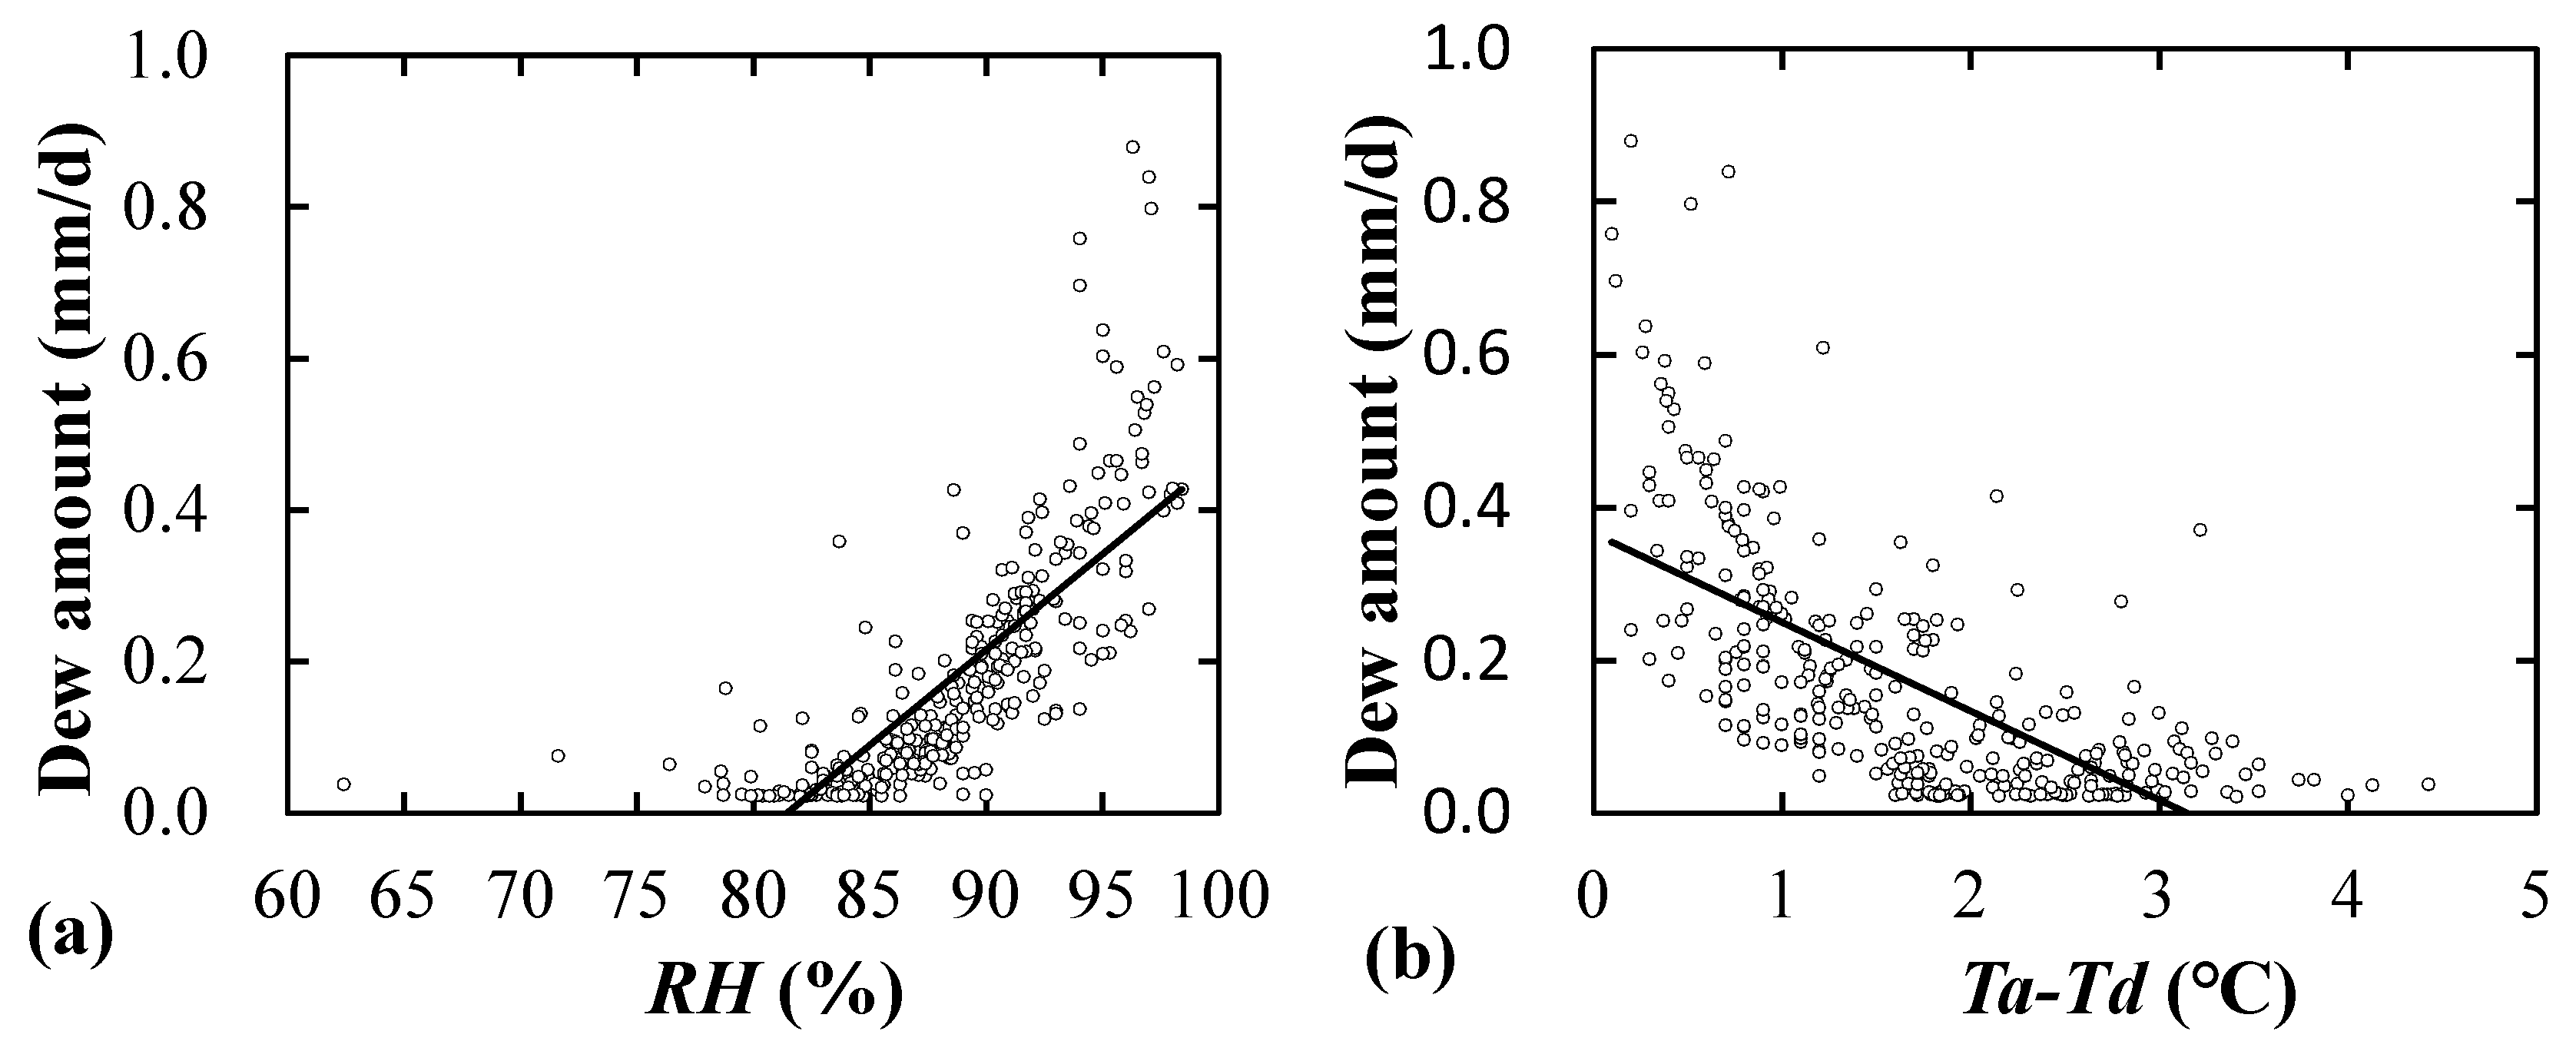
Figure 10a shows the correlation between dew amount and relative humidity (RH). A strong positive and significant correlation exists between dew amount and RH (r = 0.78, p < 0.01). The line is a linear fit to
where, RH is the average relative humidity during the period of dew event, D is dew amount (in mm of water depth) accumulated in the period; DRH’ is the slope of the line, or the unit dew amount per 1% increase in RH (in this case, DRH’ = 0.025 mm); RH0 is the threshold humidity for the formation of dew in the region, which is 81% in this region based on the data.
3.5.2. Air Temperature
Figure 10b shows the variation of dew amount with the cooling effect, or the difference between air temperature (Ta) and dewpoint temperature (Td). It can be seen that this parameter is also strongly and significantly correlated to dew amount (r = −0.66, p < 0.01). The line is a linear fit to
where, Ta − Td is the difference between air temperature and dewpoint temperature during the period of dew event; is the temperature threshold above which it is difficult, if not possible, to have water vapor condensation; and DT’ is the slope of the line, or the unit dew amount with 1 °C increase in Ta − Td. In this location, ▽T0 = 3.2 °C and DT’ = −0.115 mm °C−1.
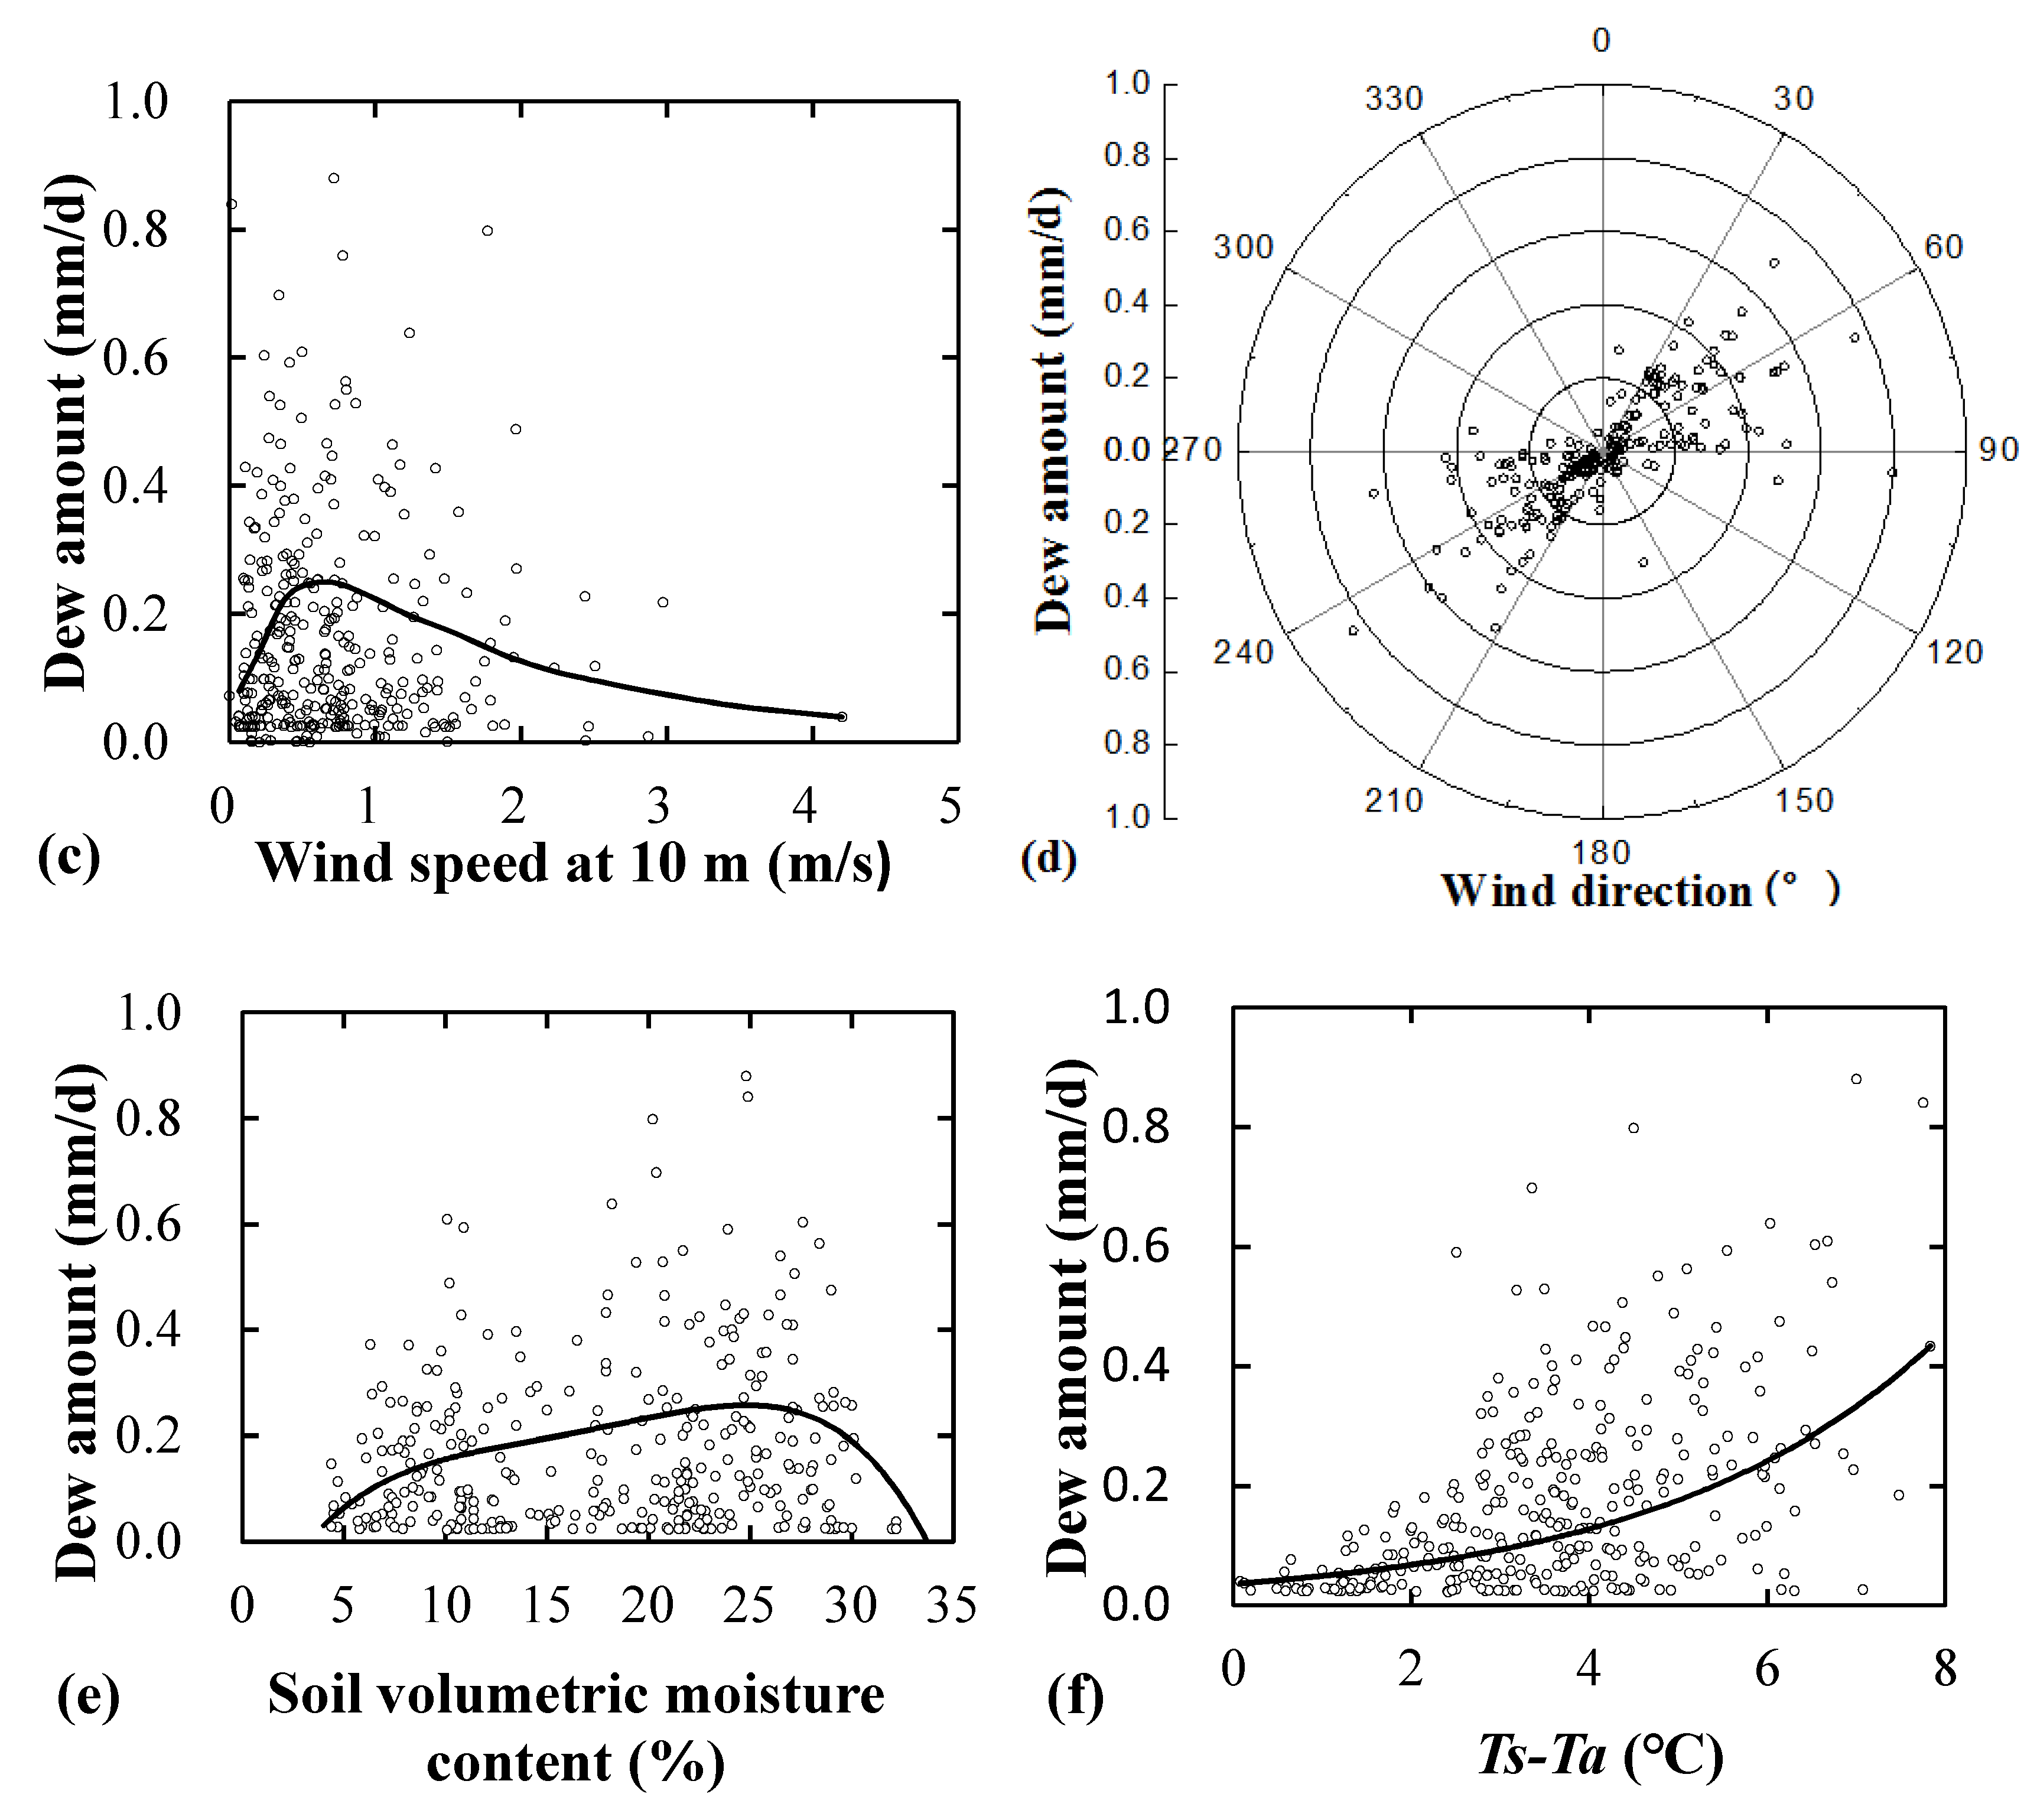
3.5.3. Wind Speed
Figure 10c shows the correlation between dew amount and wind speed at 10-m height above ground. It can be seen that the peak of dew amount corresponds to a wind speed around 0.5 m/s, which is also the most frequent wind speed in the area, but the productive wind speed generally varied between 0.2 m·s−1 and 2 m·s−1.
3.5.4. Wind Directions
3.5.5. Surface Soil Moisture
Figure 10e shows the relation between dew amount and soil moisture content measured at 1 cm below the soil surface. It can be seen that dew amount generally increased with the increase in soil moisture content from 6% to 26%, and then decreased sharply when the moisture content was higher. The maximum average amount, which was 0.28 mm/night, occurred when the volumetric soil moisture content was 26%, not higher. It can be explained that although high soil moisture content can provide more water vapor for dew formation in theory [47], extremely high moisture contents in soil (greater than 26% in this case) were actually caused by rainfall events which saturated the soil and excluded the formation of dew during the period. In particular, when the soil is more saturated, it is warmer than when it is less saturated, due to higher amount of water and heat capacity in the soil, which prevents soil temperature from dropping to the dewpoint in the night. On the other hand, cloudy or overcast conditions during a rainy day also prohibit the formation of dew. The most productive moisture content at 26% in Figure 10e happened to be indicative of the soil’s field water-holding capacity, or “field capacity”, which is the maximum amount of soil water held by capillary forces against gravity. This happens in one to two days following a rainfall or irrigation event. At this time, adequate water vapor in the air and sufficient water in the soil provided the best combined conditions for the formation of dew. Following a rainfall event, both the moisture contents in soil and air will continuously decline due to evaporation and infiltration losses, which is unfavorable to the formation of dew.
3.5.6. Surface Soil Temperature
Figure 10f shows the variation of dew amount with the difference between surface soil temperature (Ts) and air temperature (Ta). A weak and positive correlation exists between dew amount and the difference between soil and air temperatures (Ts − Ta), indicating that a larger difference is more conducive to dew formation, because it can supply more water vapor into the air due to the larger upward temperature gradient.
4. Discussion
This study re-confirmed that the formation of dew followed a typical night domination pattern over the daily cycle. Dew was mainly formed in the night between 18:00 and 8:00 with the highest dew frequency and intensity at 4:00. Based on the strong seasonal trends, the actual dew production time is 14 h in spring, autumn, and winter, and 11 h in summer. This is highly correspondent to the length of cooling hours of the days, because spring, autumn, and winter have shorter days and longer nights with lower temperature, but it is just the opposite in summer. Radiative cooling, mainly formed at night, is essential for dew formation. During the night, objects are subjected to cooling due to lack of heat gain from solar short wave radiation and because the primary gases of the atmosphere (nitrogen and oxygen) are poor thermal emitters [48,49].
The strong seasonal dew amount pattern also revealed that the maximum amount of dew occurred in the autumn season (the average cumulative dew amount was 12.2 mm) when adequate water vapor and suitable temperature conditions co-existed for dew production. This is followed by spring (11.4 mm) and summer (6.6 mm), and the minimal amount in winter (2.6 mm). Although there is rainfall in summer, the generally low average relative humidity (66%) in the air makes it difficult to form condensation. In winter, the large gap between air temperature and dewpoint, Ta − Td > 1.5 °C, as well as low average temperature (0.9 °C) and relative humidity (68%) were not conducive to condensation of water vapor. Instead, frost may form when the temperature drops below 0 °C. Compared to rainfall, dew occurs more frequently as the number of dew days is 2.6 times that of rain days, making the limited water resource more readily available for life on the dryland. Thus, according to the time distribution, rain and dew are highly complementary, as they cannot possibly occur at the same time. In this region, there is relatively more rainfall in summer (41% of the annual precipitation) with lesser amount of dew (20% of annual dewfall), relatively less rainfall in spring (23%) and autumn (32%), but a greater amount of dew (35% and 37% respectively).
Relative air humidity and the difference between air temperature and dewpoint (Ta − Td) appeared to be the main factors influencing the amount of dew condensation. In this study, dew amount was positively correlated to relative humidity, and negatively correlated to Ta − Td. Data has shown that dew may occur when the relative air humidity is greater than 81%, and Ta − Td is less than 3.2 °C in this region. This proves that water vapor can be condensed before the air temperature drops to the dewpoint and far before the relative humidity reaches saturation. This is in line with the results of Monteith (1957), Sharan (2007), and Ye (2006) [23,29,50].
Wind speed, wind direction, surface soil moisture, and temperature affected dew condensation to some extent, but were weakly correlated. Wind can bring in moisture which enhances dew formation, but it can also prevent the dew from forming due to the increased heat exchange with air by convection and turbulence [51]. There are different views on the specific relations between wind speed and dew formation. Monteith (1957) [50] thought that wind speed should be less than 0.5 m·s−1, while Muselli (2009) [51] found that wind speed should be less than 1 m·s−1. The results of this study showed that water vapor was mainly condensed at wind speeds varying over a larger range between 0.2 and 2 m·s−1, and the optimum wind speed was 0.5 m·s−1. Thus, the effect of wind speed is in-situ specific. The influence of wind direction on dew formation varied with geographical locations and regional prevailing wind directions. This study showed that the productive wind directions varied between 30°–90° and 210°–270°, which are the same as the local prevailing wind directions. These values compared well with the Loess hilly region of Ansai County, northern Shaanxi Province in a semi-arid region of China [52], but were different from the Dingxi city, Gansu Province in a semi-arid region of China [53], as well as the Kothara region in North-West India [29]. In the Kothara region, dew formed mainly with wind directions in the 240–360° and 0–100° directions (SW and NE). It is apparent that sea breeze, which corresponds to wind direction between 130° and 310° (SW–NW), does not give rise to the maximum of dew events, owing to its wind regime being associated with the monsoon. The surface soil moisture and temperature acted as drivers of vapor flow upward. Both the higher soil surface moisture and temperature created upward gradients of water vapor and heat to rise into the air [47], which promoted the formation of dew. This study showed that the optimum surface soil volumetric moisture content was 26% for producing the maximum amount of dew. Higher and saturated soil conditions reflected the rainfall events which excluded the formation of dew. However, rainfall served as the inducer of dew. It is often observed (e.g., Figure 9) that large amounts of dew occurred shortly before and after a rainfall event. Meanwhile, a positive correlation exists between dew amount and the difference between soil and air temperatures (Ts − Ta). Larger upward temperature and moisture gradients in the night added more moisture into the air and increased air humidity for the formation of dew. During the dew production time which is primarily in the night (e.g., Figure 5), Ts is generally higher than Ta which is slightly higher than the dewpoint Td (e.g., Figure 10b,f). This provides additional vapor into the air for the formation of dew when the air temperature is cooled down to be closer to the dewpoint.
5. Conclusions
A 3-year long field experimentation was conducted in Sanyuan County, Shaanxi Province of China, located in the semi-arid region of the Loess Plateau. It can be concluded that:
(a) Dew is a significant water resource in the semi-arid region due to its high frequency. Compared with rainfall, the number of dew days was 2.6 times the number of rain days. The annual total dew amount was 32.8 mm on average, which is about 1/18th of the total amount of rainfall.
(b) Dew was most frequently observed between 18:00 and 8:00 and the most productive dew time was around 4:00. The maximum daily dew amount was 0.88 mm. The dew condensation process manifested strong daily and seasonal patterns, with about 18 h of maximum dew residence time throughout the year on dew days. However, the actual maximum dew production period was 14 h in spring, autumn and winter, and 11 h in summer.
(c) Dew amount was significantly and strongly correlated to relative humidity, the difference between air temperature and dewpoint, or Ta − Td, and weakly correlated to wind speed, wind direction, surface soil temperature, and moisture level. Dew occurred more frequently when the air humidity was greater than 81% threshold value in the area, the air–dewpoint difference (Ta − Td) was less than 3.2 °C, the wind speed was between 0.2 and 2 m·s−1, the surface soil volumetric moisture content was close to field capacity, and when the surface soil temperature was higher than the air temperature. In Sanyuan County, Shaanxi Province of China, wind directions ranging between 30°–90° and 210°–270° were more favorable to dew condensation.
Author Contributions
Conceptualization, Z.W. and Z.J.; methodology, Z.J. and Z.W.; validation, Z.J., Z.W. and H.W.; investigation, Z.J., Z.W. and H.W.; writing—original draft preparation, Z.J.; writing—review and editing, Z.J. and Z.W.
Funding
This work was supported by “111” Project (B08039), Fundamental Research Funds for the Central Universities (310829161003 and 310829161010), the Special Fund for Basic Scientific Research of Central Colleges (310829163405), Xi’an Construction Science and Technology Planning Project (SJW2017–11), and the National Natural Science Foundation of China (41761144059 and 41877179).
Conflicts of Interest
The authors declare no conflict of interest.
References
- Beysens, D. Estimating dew yield worldwide from a few meteo data. Atmos. Res. 2016, 167, 146–155. [Google Scholar] [CrossRef]
- He, S.Y.; Richards, K. The role of dew in the monsoon season assessed via stable isotopes in an alpine meadow in Northern Tibet. Atmos. Res. 2015, 151, 101–109. [Google Scholar] [CrossRef]
- Zhuang, Y.L.; Zhao, W.Z. The ecological role of dew in assisting seed germination of the annual desert plant species in a desert environment, northwestern China. J. Arid Land 2015, 8, 264–271. [Google Scholar] [CrossRef]
- Agam, N.; Berliner, P.R. Dew formation and water vapor adsorption in semi-arid environments—A review. J. Arid Environ. 2006, 65, 572–590. [Google Scholar] [CrossRef]
- Meng, Y.; Wen, X.F. Characteristics of dew events in an arid artificial oasis cropland and a sub-humid cropland in China. J. Arid Land 2016, 8, 399–408. [Google Scholar] [CrossRef] [Green Version]
- De Roode, S.R.; Bosveld, F.C.; Kroon, P.S. Dew formation, eddy-correlation latent heat fluxes, and the surface energy imbalance at Cabauw during stable conditions. Bound.-Lay. Meteorol. 2010, 135, 369–383. [Google Scholar] [CrossRef]
- Kidron, G.J. Altitude dependent dew and fog in the Negev Desert, Israel. Agric. For. Meteorol. 1999, 96, 1–8. [Google Scholar] [CrossRef]
- Kidron, G.J.; Temina, M.; Starinsky, A. An investigation of the role of water (rain anddew) in controlling the growth form of lichens on cobbles in the Negev Desert. Geomicrobiol. J. 2011, 28, 335–346. [Google Scholar] [CrossRef]
- Uclés, O.; Villagarcía, L.; Moro, M.J.; Canton, Y.; Domingo, F. Role of dewfall in the water balance of a semiarid coastal steppe ecosystem. Hydrol. Process. 2013, 28, 2271–2280. [Google Scholar] [CrossRef]
- Zhang, Q.; Wang, S.; Yang, F.L.; Yue, P.; Yao, T.; Wang, W.Y. Characteristics of dew formation and distribution, and its contribution to the surface water budget in a semi-arid region in China. Bound.-Lay. Meteorol. 2015, 154, 317–331. [Google Scholar] [CrossRef]
- Tomaszkiewicz, M.; Abou Najm, M.; Zurayk, R.; El-Fadel, M. Dew as an adaptation measure to meet water demand in agriculture and reforestation. Agric. For. Meteorol. 2017, 232, 411–421. [Google Scholar] [CrossRef]
- Yan, B.X.; Deng, W. Study on the dew resource in Sanjiang Plain. J. Nat. Resour. 2004, 19, 732–737. (In Chinese) [Google Scholar]
- Hao, X.M.; Li, C.; Guo, B.; Ma, J.X.; Ayup, M.; Chen, Z.S. Dew formation and its long-term trend in a desert riparian forest ecosystem on the eastern edge of the Taklimakan Desert in China. J. Hydrol. 2012, 472–473, 90–98. [Google Scholar] [CrossRef]
- Zangvil, A. Six years of dew observations in the Negev Desert. Israel. J. Arid Environ. 1996, 32, 361–371. [Google Scholar] [CrossRef]
- Moro, M.J.; Were, A.; Villagarcía, L.; Cantón, Y.; Domingo, F. Dew measurement by eddy covariance and wetness sensor in a semiarid ecosystem of SE Spain. J. Hydrol. 2007, 335, 295–302. [Google Scholar] [CrossRef]
- Nwanze, K.F.; Reddy, Y.V.R.; Nwilene, F.E.; Soman, P.; Laryea, K.B.; Jayachandran, R. Reduction of shoot fly damage in irrigated post-rainy season sorghum bymanipulating irrigation. Ann. Appl. Biol. 1996, 129, 391–403. [Google Scholar] [CrossRef]
- Dalla Marta, A.; Orlandini, S. Analysis of leaf wetness duration dynamics on a sunflower (Heliantus annuus L.) canopy. Phys. Chem. Earth 2010, 35, 31–34. [Google Scholar] [CrossRef]
- Daniel DM, B.; Intrigliolo, D.S.; Dalla Marta, A.; Orlandini, S.; Vicent, A. Leaf wetness duration in irrigated citrus orchards in the Mediterranean climate conditions. Agric. For. Meteorol. 2017, 234–235, 182–195. [Google Scholar]
- Severini, M.; Moriconi, M.L.; Tonna, G.; Olivieri, B. Dewfall and evapotranspiration determination during day and night time on an irrigated lawn. J. Clim. Appl. Meteorol. 1984, 23, 1241–1246. [Google Scholar] [CrossRef]
- Beysens, D. The formation of dew. Atmos. Res. 1995, 39, 215–237. [Google Scholar] [CrossRef]
- Jacobs, A.F.G.; Heusinkveld, B.G.; Berkowicz, S.M. Dew deposition and drying in a desert system, a simple simulation model. J. Arid Environ. 1999, 42, 211–222. [Google Scholar] [CrossRef]
- Jacobs, A.F.G.; Heusinkveld, B.G.; Berkowicz, S.M. Dew measurements along a longitudinal sand dune transect, Negev desert, Israel. Int. J. Biometeorol. 2000, 43, 184–190. [Google Scholar] [CrossRef] [PubMed]
- Ye, Y.H.; Zhou, K.; Li, H.D. Research progress in urban dew and its ecological effect. Chin. J Ecol. 2006, 25, 1570–1573. (In Chinese) [Google Scholar]
- Fang, J.; Ding, Y.J. An Experimental Observation of the Relationship between Sandy Soil Condensation Water and Micrometeorological Factors in the Arid Desert Region. J. Desert Res. 2015, 35, 1200–1205. (In Chinese) [Google Scholar]
- Pan, Y.X.; Wang, X.P.; Zhang, Y.F. Dew formation characteristics in a revegetation-stabilized desert ecosystem in Shapotou area, Northern China. J. Hydrol. 2010, 387, 265–272. [Google Scholar] [CrossRef]
- Hollermann, P.; Zapp, H. On the estimation and significance of condensation of dew in the eastern Canary Islands. Erdwissenschaftliche-Forsch. 1991, 25, 175–196. [Google Scholar]
- Alnaser, W.E.; Barakat, A. Use of condensed water vapor from the atmosphere for irrigation in Bahrain. Appl. Energy 2000, 65, 3–18. [Google Scholar] [CrossRef]
- Del Campo, A.D.; Navarro, R.M.; Aguilella, A.; González, E. Effect of tree shelter design on water condensation and run-off and its potential benefit for reforestation establishment in semiarid climates. For. Ecol. Manag. 2006, 235, 107–115. [Google Scholar] [CrossRef]
- Sharan, G.; Beysens, D.; Milimouk-Melnytchouk, I. A study of dew water yields on Galvanized iron roofs in Kothara (North-West India). J. Arid Environ. 2007, 69, 259–269. [Google Scholar] [CrossRef]
- Beysens, D.; Lekouch, I.; Mileta, M.; Milimouk, I.; Muselli, M. Dew and Rain Water Collection in South Croatia. Int. J. Civ. Environ. Eng. 2009, 1, 64–70. [Google Scholar]
- Sharan, G. Harvesting dew with radiation cooled condensers to supplement drinking water supply in semi-arid coastal Northwest India. Int. J. Serv. Learn. Eng. 2011, 6, 130–150. [Google Scholar]
- Gabin, K. Atmospheric Moisture Condensing in Benin, A Contribution to the Correction of Water Stress in Maize in Semi-Arid Environment. Ph.D. Thesis, Abomey-Calavi University, Cotonou, Benin, 2015. [Google Scholar]
- Yu, Y.; Wei, W.; Chen, L.D.; Lei, Y.; Han-dan, Z. Comparison on the methods for spatial interpolation of the annual average precipitation in the Loess Plateau region. Chin. J. Appl. Ecol. 2015, 26, 999–1006. (In Chinese) [Google Scholar]
- Li, Y.S. The properties of water cycle in soil and their effect on water cycle for land in the loess region. Acta Ecol. Sin. 1983, 3, 91–101. [Google Scholar]
- Wang, X.; Gao, Z.Y.; Wang, Y.K.; Wang, Z.; Jin, S. Dew measurement and estimation of rain-fed jujube (Zizyphus jujube Mill) in a semi-arid loess hilly region of China. J. Arid Land 2017, 9, 547–557. [Google Scholar] [CrossRef]
- Dai, A.G. Recent climatology, variability, and trends in global surface humidity. J. Clim. 2006, 19, 3589–3606. [Google Scholar] [CrossRef]
- Willett, K.M.; Gillett, N.P.; Jones, P.D.; Thorne, P.W. Attribution of observed surface humidity changes to human influence. Nature 2007, 449, 710–712. [Google Scholar] [CrossRef] [PubMed]
- Hou, W.; Sun, S.P.; Zhang, S.X.; Zhao, J.H.; Feng, G.L. Season division and its temporal and spatial variation features of General atmospheric circulation in East Asia. Acta Phys. Sin. 2011, 60, 781–789. [Google Scholar]
- Chen, Y.; Jiang, Y.D.; Chen, X.Y. People’s Republic of China Meteorological Industry Standard “Division of Climatic Season” (QX/T 152-2012); China Meteorological Press: Beijing, China, 2012; pp. 1–5. (In Chinese) [Google Scholar]
- UNEP (United Nations Environment Program). World Atlas of Desertification; Edward Arnold: London, UK, 1992; ISBN 0340555122. [Google Scholar]
- Jia, Z.F.; Zhu, H.Y.; Yi, X. Soil Moisture’s Time and Spatial Variability in Semi-humidity and Liable-drought region. China Rural Water Hydropower 2016, 8, 67–72. (In Chinese) [Google Scholar]
- Liu, X.H.; Li, L.; Hu, A.Y. Hydrochemical characterization of a groundwater aquifer and its water quality suitability for irrigation in Jinghuiqu Irrigation District of China. Water Environ. Res. 2013, 85, 245–258. [Google Scholar] [CrossRef]
- Lawrence, M.G. The relationship between relative humidity and the dewpoint temperature in moist air. Am. Meteorol. Soc. 2005, 86, 225–233. [Google Scholar] [CrossRef]
- Alduchov, O.A.; Eskridge, R.E. Improved Magnus form approximation of saturation vapor pressure. J. Appl. Meteorol. 1996, 35, 601–609. [Google Scholar] [CrossRef]
- Monteith, J.L.; Unsworth, M.H. Principles of Environmental Physics, 2nd ed.; Edward Arnold: London, UK, 1990. [Google Scholar]
- Lv, M.H.; Yan, J.Y.; Yao, R.T.; Li, B. Study on the statistical method of wind direction. J. Meteorol. Environ. 2012, 28, 83–89. (In Chinese) [Google Scholar]
- Saito, H.; Simunek, J.; Scanlon, B.R. Numerical Analysis of Coupled Water, Vapor, and Heat Transport in the Vadose Zone. Vadose Zone J. 2006, 5, 784–800. [Google Scholar] [CrossRef]
- Bliss, R.W. Atmospheric radiation near the surface of the ground, a summary for engineers. Sol. Energy 1961, 5, 103–120. [Google Scholar] [CrossRef]
- Tomaszkiewicz, M.; Abou Najm, M.; Beysens, D.; Alameddine, I.; El-Fadel, M. Dew as a sustainable non-conventional water resource: A critical review. Environ. Rev. 2015, 23, 425–442. [Google Scholar] [CrossRef]
- Monteith, J.L. Dew. Q. J. R. Meteorol. Soc. 1957, 83, 322–341. [Google Scholar] [CrossRef]
- Muselli, M.; Beysens, D.; Mileta, M.; Milimouk, I. Dew and rain water collection in the Dalmatian Coast, Croatia. Atmos. Res. 2009, 92, 455–463. [Google Scholar] [CrossRef]
- Wang, H.; Jia, Z.F.; Wang, Z. Dew amount and its inducing factors in the loess hilly region of northern Shaanxi Province, China. Chin. J. Appl. Ecol. 2017, 28, 3703–3710. (In Chinese) [Google Scholar]
- Wen, X.M. Research of Dew and Evaporation Characteristics of Semi-Arid Area. Master’s Thesis, Institute of Arid Meteorology, CMA, Lanzhou, China, 2009; pp. 35–36. (In Chinese). [Google Scholar]
Figure 1.
Location of the experimental site—Jinghuiqu Irrigation Experimental Station (JIES).

Figure 2.
Calibration curve of leaf wetness sensor (LWS) for measuring the amount of dew.

Figure 3.
Filed experimental setup. Sensors include: (a) LWS; (b) ECRN-100 rain gauge; (c) VP-3; (d) Davis Cup Anemometer; (e) GS-3; (f) EM50 datalogger inside the security box.
Figure 3.
Filed experimental setup. Sensors include: (a) LWS; (b) ECRN-100 rain gauge; (c) VP-3; (d) Davis Cup Anemometer; (e) GS-3; (f) EM50 datalogger inside the security box.

Figure 4.
Diagrammatic of possible variations in dewfall.

Figure 5.
Typical daily variations of dew amount and intensity in (a); hourly dew frequency and cumulative dew frequency in (b).
Figure 5.
Typical daily variations of dew amount and intensity in (a); hourly dew frequency and cumulative dew frequency in (b).


Figure 6.
Average daily variations of dew occurrence in different seasons: (a) dew amount; (b) intensity; and (c) cumulative frequency.
Figure 6.
Average daily variations of dew occurrence in different seasons: (a) dew amount; (b) intensity; and (c) cumulative frequency.

Figure 7.
Variations of dew and rainfall amounts: (a) daily amounts of dew and rainfall; (b) annual distribution of daily dewfall; and (c) monthly and annual cumulative dewfall.
Figure 7.
Variations of dew and rainfall amounts: (a) daily amounts of dew and rainfall; (b) annual distribution of daily dewfall; and (c) monthly and annual cumulative dewfall.


Figure 8.
Comparison of the number of dew days and rain days in all the monitored months.

Figure 9.
Comparison of the amounts of dew versus rainfall in all months monitored.

Figure 10.
Relationships between the daily dew amount and meteorological and soil parameters: (a) relative humidity; (b) difference between air temperature and dewpoint temperature; (c) wind speed; (d) wind direction; (e) surface soil moisture; and (f) difference between soil temperature and air temperature.


© 2019 by the authors. Licensee MDPI, Basel, Switzerland. This article is an open access article distributed under the terms and conditions of the Creative Commons Attribution (CC BY) license (http://creativecommons.org/licenses/by/4.0/).
Share and Cite
MDPI and ACS Style
Jia, Z.; Wang, Z.; Wang, H. Characteristics of Dew Formation in the Semi-Arid Loess Plateau of Central Shaanxi Province, China. Water 2019, 11, 126. https://doi.org/10.3390/w11010126
AMA Style
Jia Z, Wang Z, Wang H. Characteristics of Dew Formation in the Semi-Arid Loess Plateau of Central Shaanxi Province, China. Water. 2019; 11(1):126. https://doi.org/10.3390/w11010126
Chicago/Turabian StyleJia, Zhifeng, Zhi Wang, and Hao Wang. 2019. "Characteristics of Dew Formation in the Semi-Arid Loess Plateau of Central Shaanxi Province, China" Water 11, no. 1: 126. https://doi.org/10.3390/w11010126
Note that from the first issue of 2016, this journal uses article numbers instead of page numbers. See further details here.