Role of Water User Associations on the Restoration of the Ecosystem in Tanzania


1
Institute of Water and Energy Sciences (Including Climate Change), Pan African University, Tlemcen 13000, Algeria
2
Faculty of Social Sciences, Centre for Middle Eastern Studies, Lund University, 22100 Lund, Sweden
*
Author to whom correspondence should be addressed.
Water 2019, 11(1), 141; https://doi.org/10.3390/w11010141
Submission received: 13 November 2018
/
Revised: 6 January 2019
/
Accepted: 8 January 2019
/
Published: 15 January 2019
(This article belongs to the Section Water Resources Management, Policy and Governance)
Abstract
:The Mkoji sub-catchment is the most populated sub-catchment in the uppermost part of the Rufiji basin in Tanzania, with critical users downstream, and it is vulnerable to water shortages. Despite the efforts made by governmental and non-governmental organizations in forming and supporting water user associations, little is known about their role on water resource management in the country. This study aimed to investigate the role of water user associations on the restoration of decreased environmental flow and degraded aquatic ecosystems in Tanzania, taking the Mkoji sub-catchment as a case study. Six water user associations were assessed, focusing on their strategies and influence on restoration, land use, ecosystem degradation, and their role in climate change mitigation strategies. Data were collected from various sources using interviews, focus group discussions and questionnaires. The Spearman correlation test was used to seek the relationship between the flow and the aquatic ecosystem. Statistical results showed that there was no correlation between the flow and rainfall, and there was a correlation between freshwater ecosystems and the flow. The results showed that 89% of the sample population accepted the decrease of the flow while 75% accepted the decrease of the fish catch in the freshwater ecosystem of the study. Based on the results obtained, the paper concluded that water user associations are doing a great job in management and restoration while politics, funding, and water permits were the main obstacles. Therefore, the government should play a role in restoring the ecosystem, bridging the gaps between farmers and animal keepers, land use planning, and developing aquaculture.
1. Introduction
Competition for water resources among different users in water basins creates challenges in managing and allocating these resources. According to the Brisbane Declaration of 2007, environmental flows describe the quantity, timing, and quality of water flows required to sustain freshwater and estuarine ecosystems and the human livelihoods and well-being that depend on these ecosystem flows [1]. The definition took a broad view including transboundary resources. The pressure of water uses has deteriorated both the quality and the quantity of the resources and worsened the environmental flow situation in many rivers across the world, which has highlighted the need for better and more sustainable basin management.
Before the 1990s, the environment was not considered to be a rightful user of water in Tanzania, and environmental flow was not in place in the management of the water resources. Not only Tanzania, but most countries failed to incorporate environmental goals in their productivity goals, which led to an inequality between water security, environmental conditions and ecosystem services [2].
Sustainable development goals (SDGs) 6, 13 and 15 highlighted the need for the protection and restoration of water-related ecosystems. There are many interrelationships between hydrological cycles and ecosystems, including terrestrial ecosystems. Water resource management links directly with ecosystem management and vice versa. Moreover, it may contribute essentially to the socially acceptable and cost-effective forms of land use [3].
In 1981, Tanzania adopted river basin management and established the River Basin Water Boards (RBWB) to manage its waters resources, in which formal and informal community participation were recognized [4].
The decrease in ecological metrics was due to the various alterations by human activities such as water abstraction and the construction of dams in the river systems [5]. The multidimensional value of the ecosystem services reflected the interrelationship between ecosystems and human activities [6].
Climate change is associated with the poor management of land and water resources. The destruction of catchments has worsened the energy crisis and land degradation, especially in the central semi-arid areas and the dry sub-humid areas in the southern highlands of Tanzania [7,8]. Climate change is expected to have great impacts on the global hydrological cycle [9]. Climate change and its variability caused extremities such as floods that have affected the quality of the water in rivers [10]. Many climate change studies conducted in Tanzania showed an increase in the rainfall in some parts of the country and a decrease in rainfall and increase in temperature in other parts, which would lead to extreme natural events such as floods and drought [11].
In Africa, agriculture is the main user of freshwater resources, accounting for almost 70% of the total annual use, which has affected the natural flows of water and sediments, and thus the riverine ecosystems [12]. Irrigation and land are dynamically related, and they are also seen to be causative of dryness [13]. The movements of water and alluvial materials led to the adaption of the riparian vegetation based on the new characteristics of the river flow regime, while the modification of the rivers by human activities altered the riparian vegetation [12].
The Mkoji sub-catchment, one of the most populated sub-catchments in Tanzania, is characterized by its multiple water users, including hydropower production, agriculture, livestock and other land uses. The growth of the activities in the area to produce food crops has increased the conflicts between water users at the upstream, middle and downstream areas. The multiple users and the intensive water use in the sub-catchment have increased the abstraction and the encroachment of the reserved areas, such as forests, which have led to deforestation and poor agricultural activities. According to [14], the issues of decreased environmental flows, water user conflicts, and the decrease in the size of the wetland in the sub-catchment contributed to the decrease in the flow of rivers and has affected downstream users.
Engaging farmers in management and decision-making can increase water productivity and increase transparency and accountability in water management [15,16]. Water use associations (WUAs), which are considered the lowest unit in the IWRM framework of Tanzania, have a vital role in water management, allocation and spreading water-related information within communities [17]. The formation of WUAs was the basis to fulfilling the pillars of IWRM, including equity, the sustainability of the environment and efficiency, while the associations are expected to serve as technical organs [18]. Moreover, research conducted in the Ilonga sub-catchment of the Wami-Ruvu basin in Tanzania reported that WUAs had a good role in managing water conflicts in the basins. The water-related conflicts decreased from 22% to 4% before and after the formation of the WUAs, respectively [19].
According to [20], water user associations in India were responsible for the management and maintenance of irrigational canals, resolving water-related disputes among users while collecting the irrigation charges and agriculture and land-water management related tasks. The involvement of WUAs in water-land-related activities indicated their role in the restoration of the environment and the ecosystem.
Despite the efforts made by governmental and non-governmental organizations in forming and supporting WUAs, little is known about their role in water resource management. Furthermore, the extent to which the formation of WUAs restored environmental flows or improved water resource management is also unknown. The study contributed to the gap left by other researchers identified during the literature review whilst researching WUAs. This paper, therefore, aimed to investigate the role of the WUAs as stakeholders in the IWRM plan and in the restoration of the decreased environmental flow and the degraded freshwater ecosystems in Tanzania, taking the Mkoji sub-catchment as a case study. The study assessed the status of the environmental flow and its degraded ecosystems in the basin. The findings helped in highlighting the knowledge gap among the WUAs about climate change, variabilities in water resources and the different impacts of land uses. It was also important to study the effectiveness and sustainability of the water resources for the development and for the ecosystem in Tanzania and how WUAs can disseminate the information (or advice) to the public.
2. Methodology
2.1. Study Area
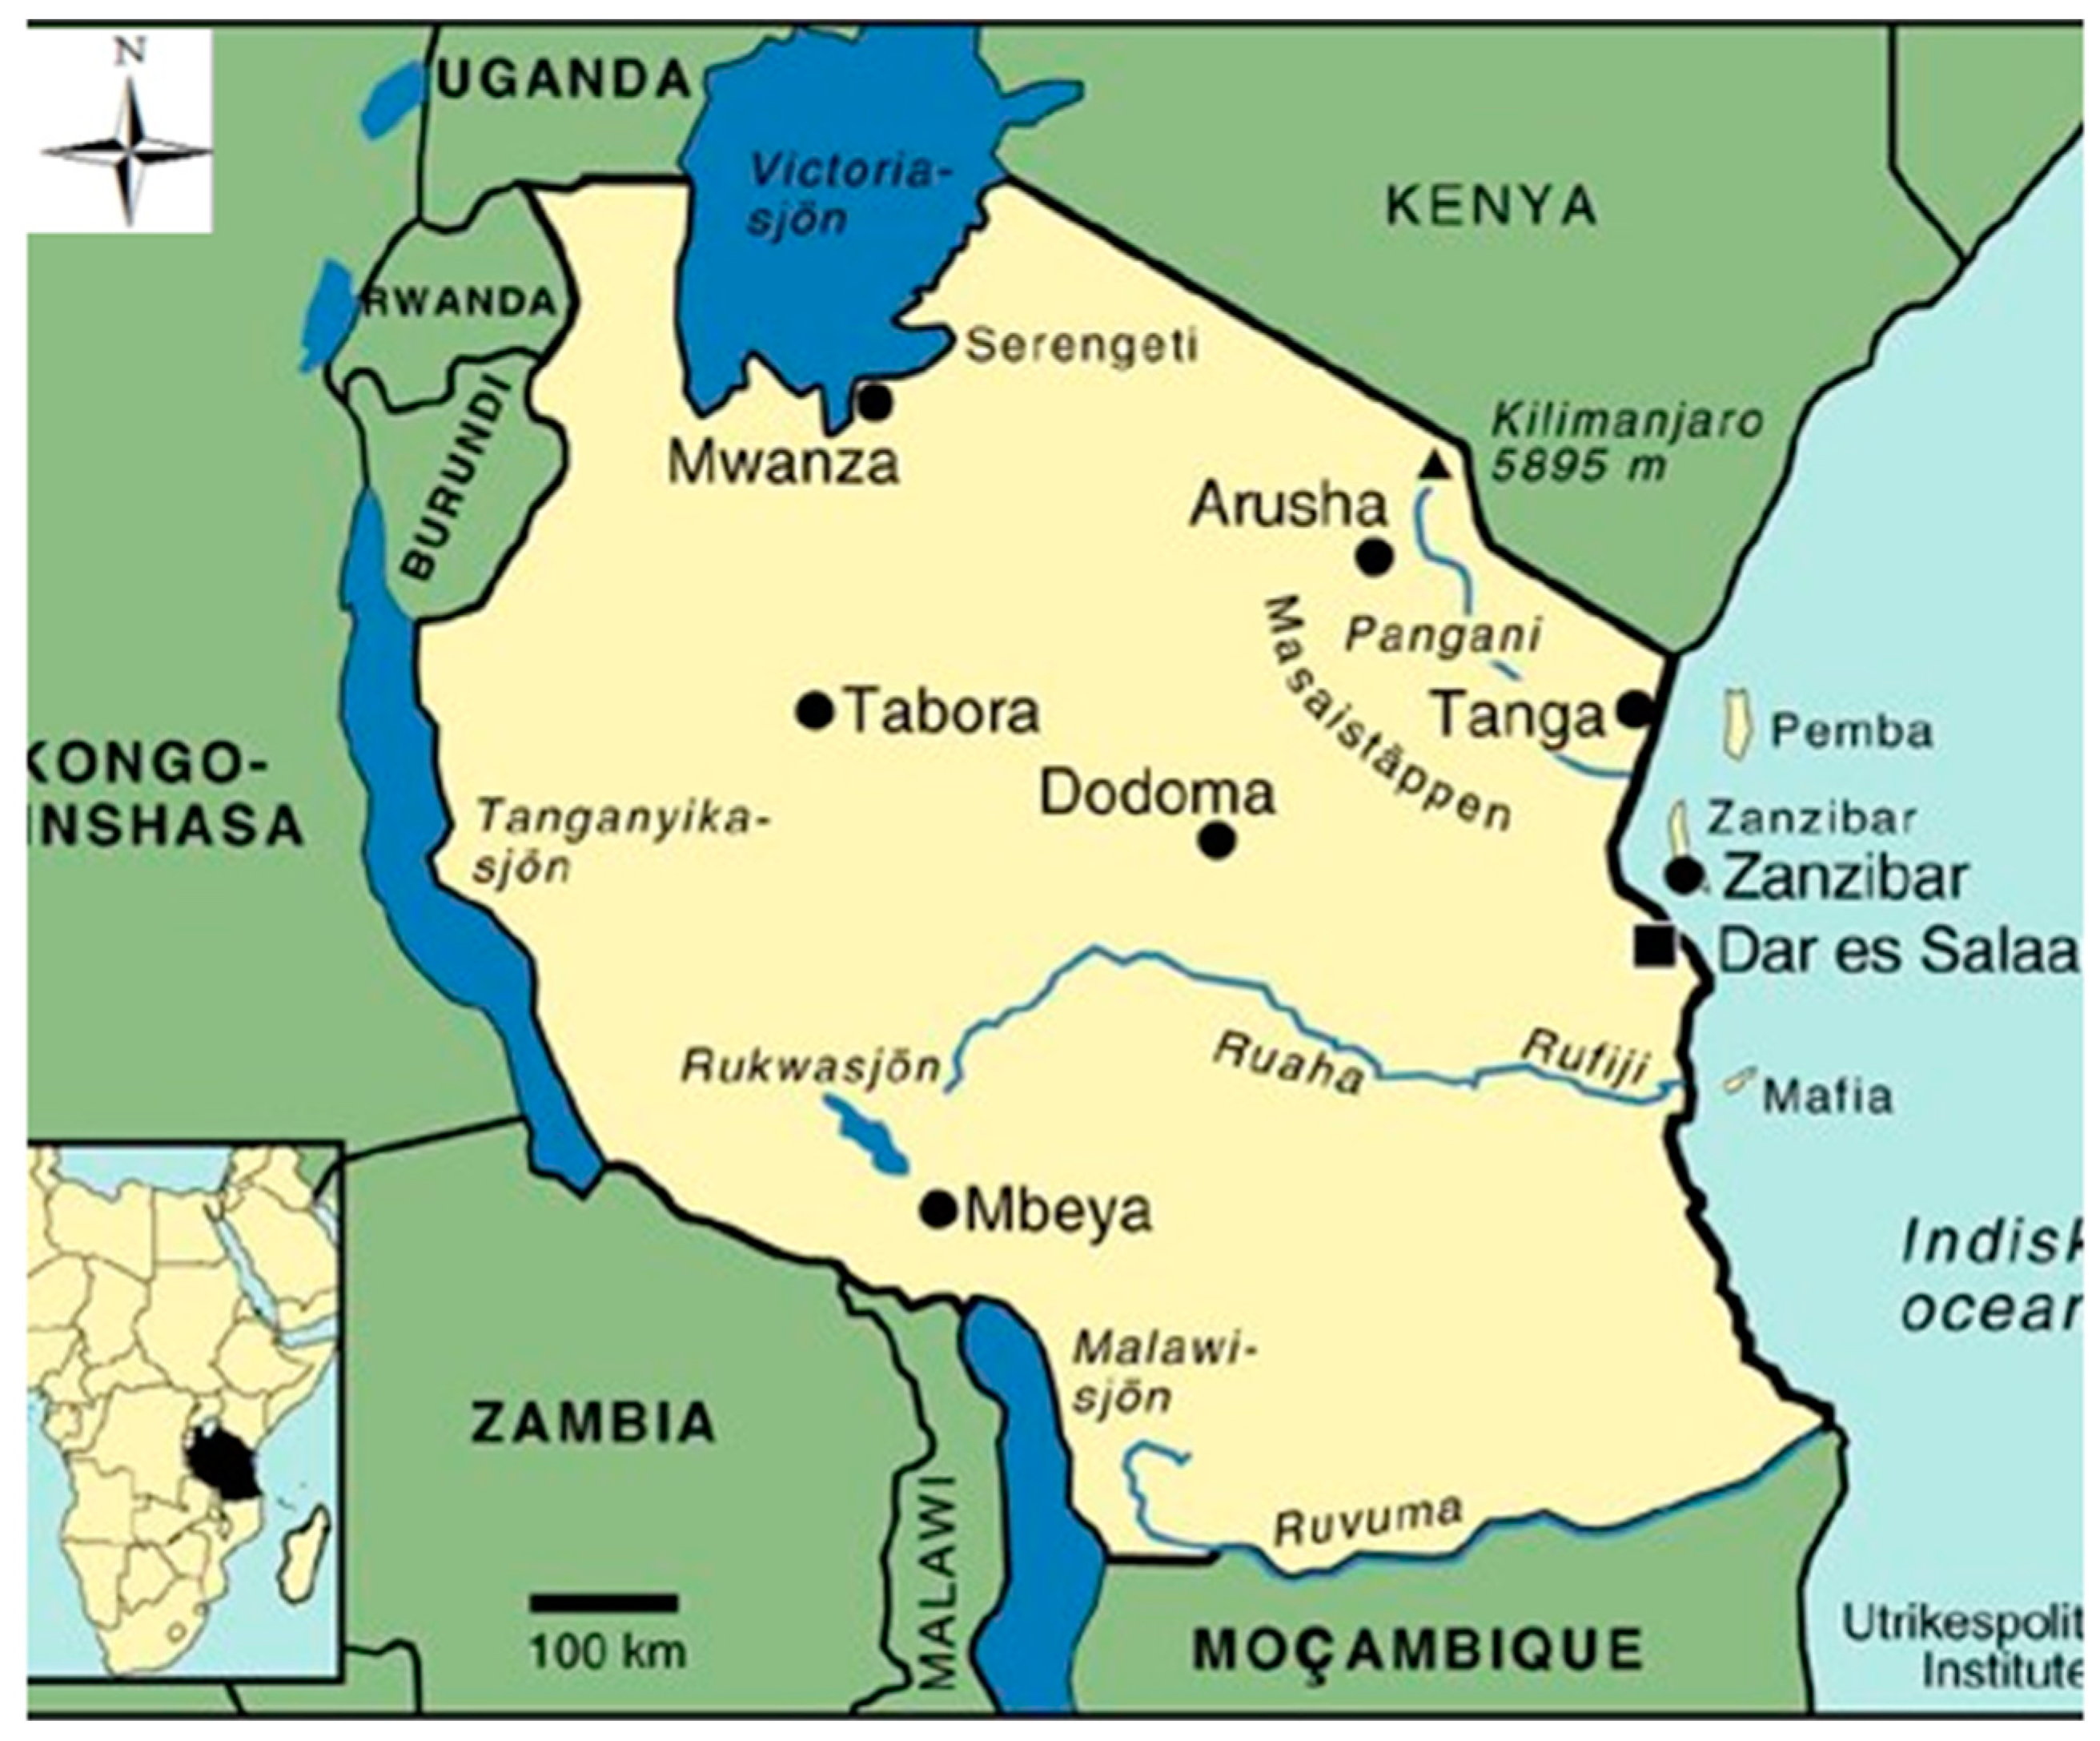
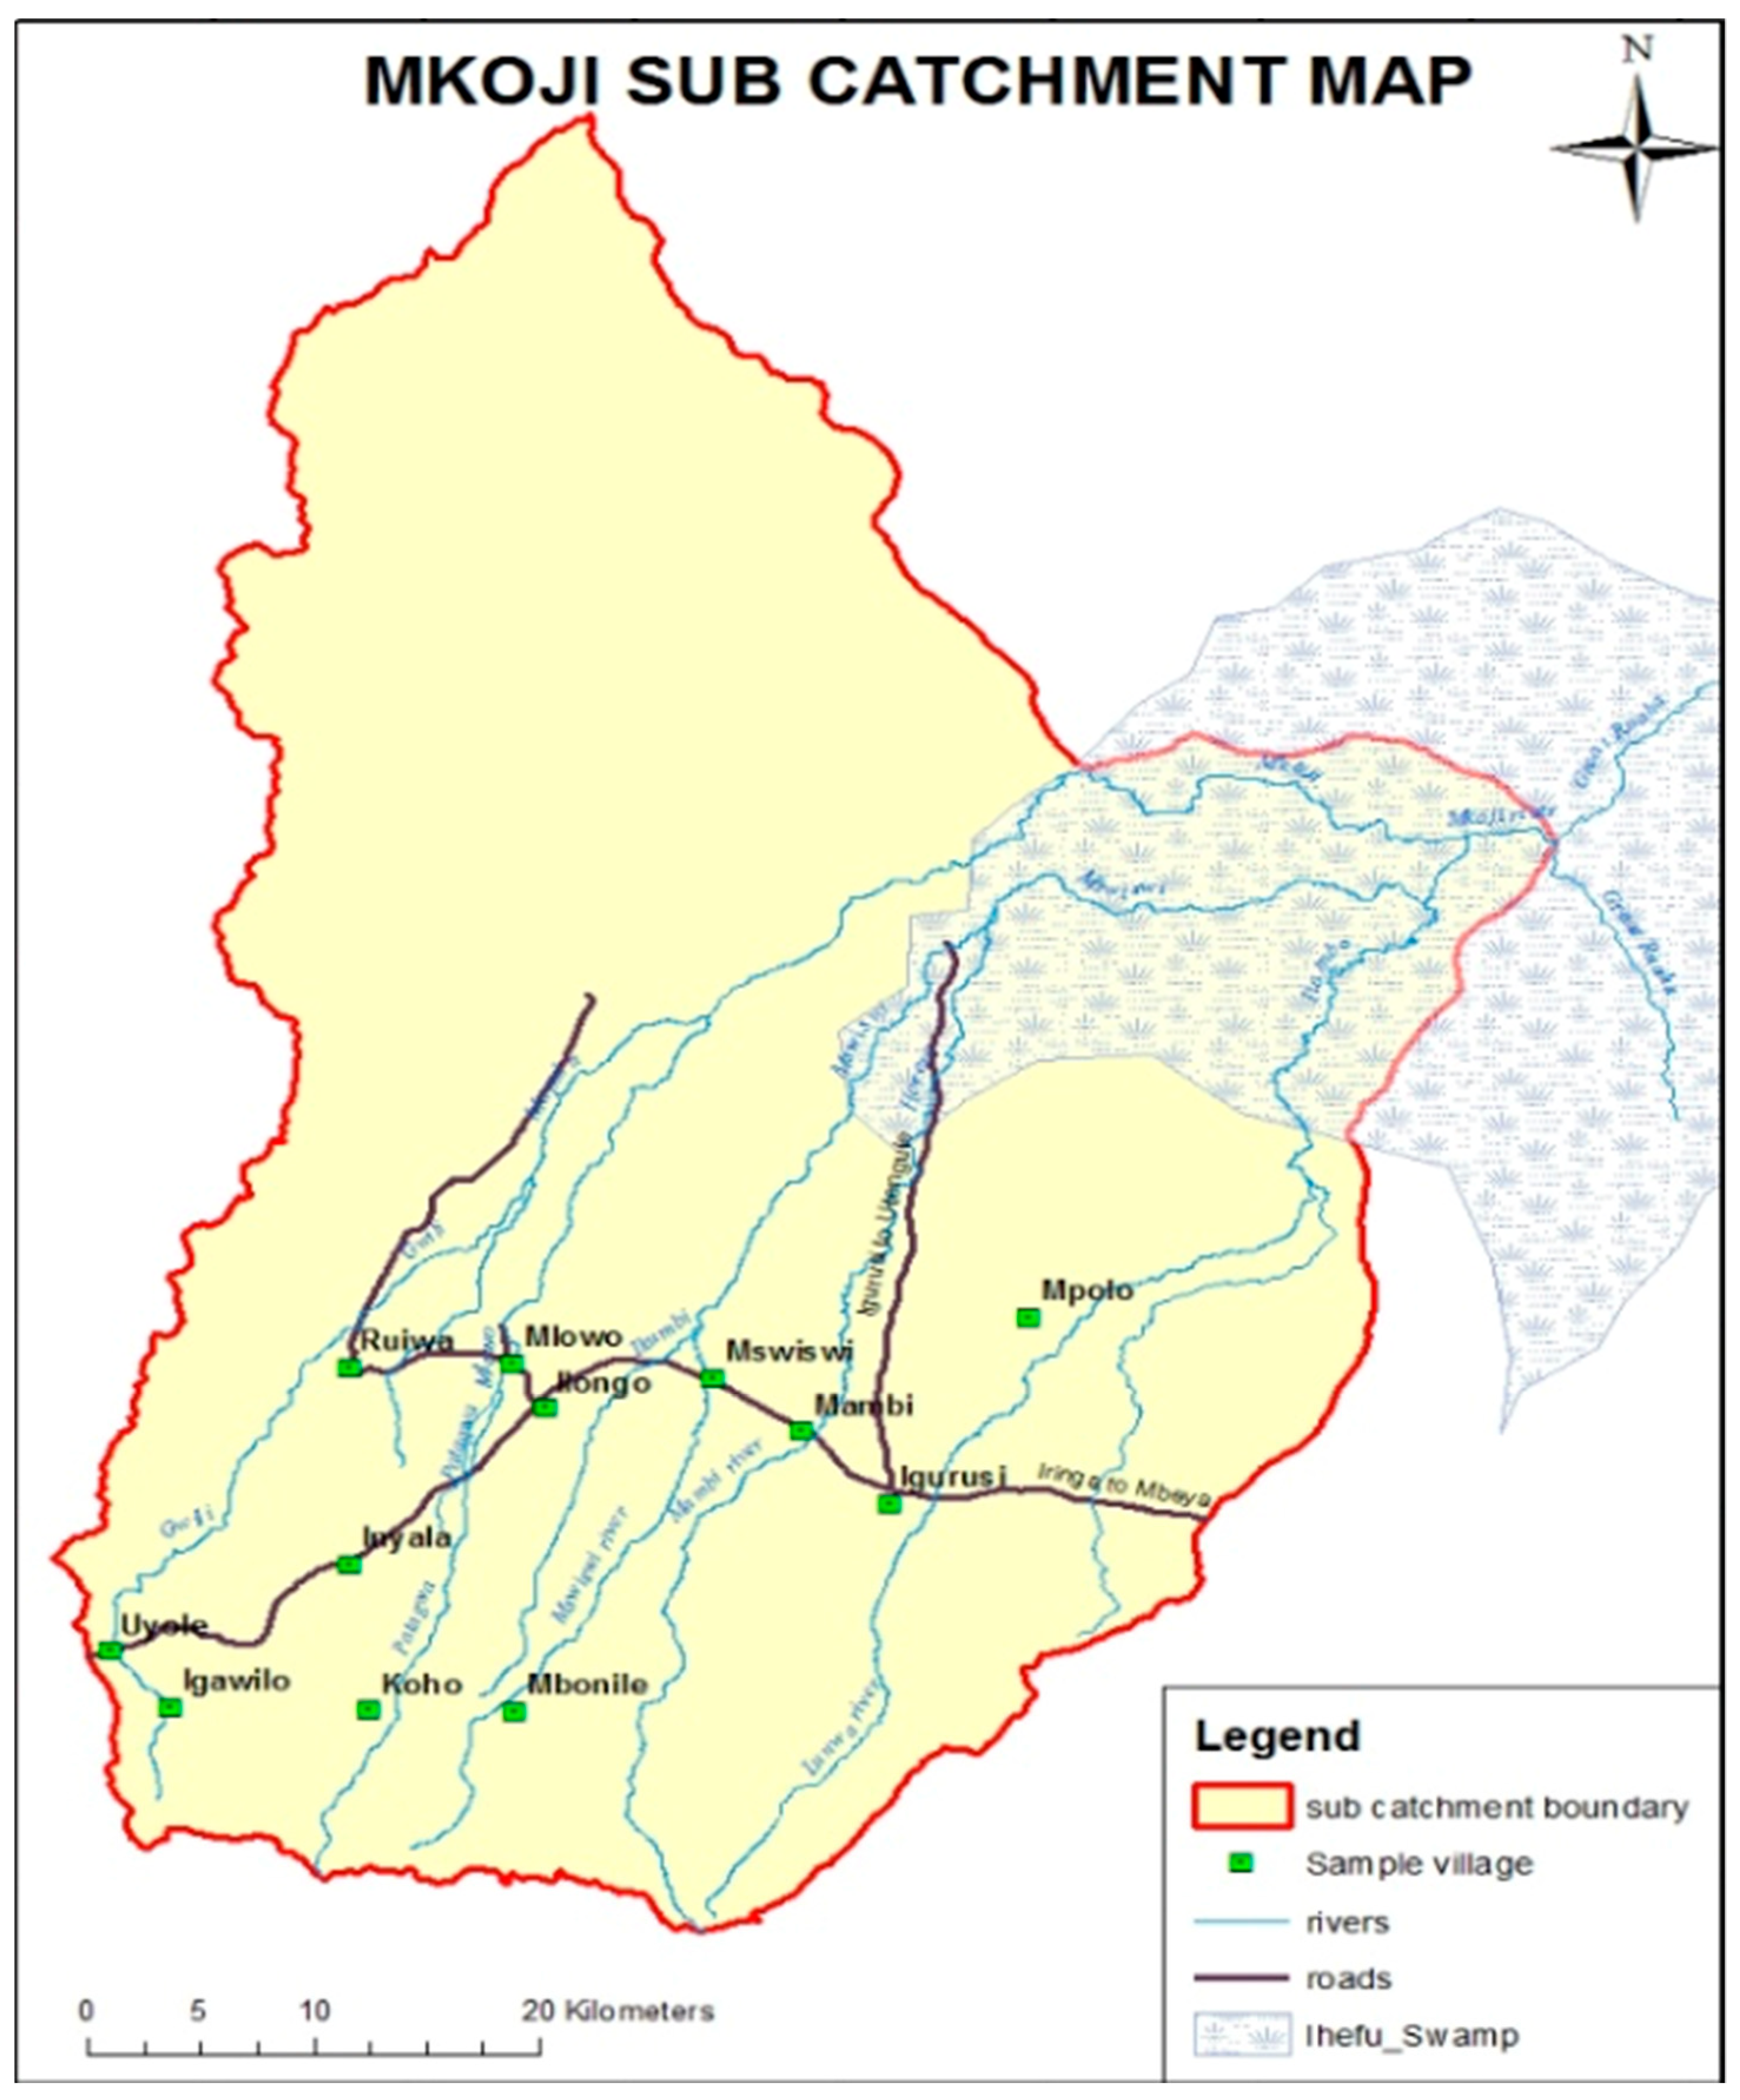
Tanzania is bordered by Burundi, Rwanda, Uganda, Kenya, Mozambique, Malawi, Zambia, Congo and the Indian ocean (Figure 1). The Mkoji sub-catchment (MSC) of the Ruaha River Basin in Tanzania, shown in Figure 2, with about 150,000 people in 3400 km2, is located in the southwest of Tanzania between the latitudes 8°10′0″ and 9°5′0″ south, and longitudes 33°35′0″ and 34°10′0″ east. MSC is one of the uppermost sub-catchments of the Rufiji river basin (Figure 1). Its upper zone receives water from the Poroto and Chunya mountains. The climate of the studied area is unimodal, with two seasons: a rainy season between November and April and a dry season between May and October. The annual rainfall ranges from 600 mm to 800 mm in the lowlands and 1500 mm in the highlands. MSC is characterized by a various number of water users from upstream to downstream, which has intensified the pressure on the water resource and to some extent caused conflicts between users, especially during the dry season. Water uses include irrigation, domestic and livestock (76, 18, and 6%, respectively) [21] The available water resources during the rainy season are estimated to be 3190 Mm3. Socioeconomic activities in the area include crop production, livestock keeping, fishing, business, and some industries.
2.2. Data Collection and Analysis
Qualitative data were collected in the villages that cover the six water user associations, namely Mkoji, Mambi, Mlowo, Gwili, Mpolo and Mswiswi. Random sampling was done on upstream, middle and downstream waters users for each zone, while a purposive method was used for the selection of the interviewees and groups for the focus-group discussion. The purposive method was used by focusing on people with good knowledge and understanding about the WUAs and conservation activities.
About 216 questionnaires were distributed among WUAs and villagers from the entire study area. The questions focused on collecting different views from association members and water users in general and determining the perceptions of people on the associations. Out of the 216 questionnaires, 136 were from individuals from WUAs and 80 were from individuals from villages.
Interviews with WUA leaders, water basin managers and NGO workers in the restoration departments and the environmental flow research were carried out during the data collection as key informants. Focus group discussion (FGD) was used to collect data from water basin officers and other staff as well as staff from the natural resource office, villagers and WUAs (a group of five to seven people was involved in the focus group discussion).
We used the triangulation approach to analyze the collected data, which facilitates the validation of data through cross-verification from two or more sources [23], based on other studies such as [24,25,26], to obtain data on the role of water user associations. Secondary data was used to validate the primary data collected. The triangulation method gave us the opportunity to validate the primary qualitative data collected in the study.
Secondary data was taken from reports and documents from basin offices, environment and natural resources departments and NGOs that are working in the basin. Reports from governmental offices about the flow of the river were collected and used as quantitative data, while rainfall data were taken from Tanzania Meteorological Agency (TMA). Fisheries data were taken from the department of fisheries of the Mbarali district in the Mbeya region to determine the condition of the ecosystem.
Then, the qualitative data was analysed in a narrative form, after being collected, classified, summarized and tabulate, while the quantitative data was analysed by a correlation method (Spearman’s correlation) to assess the relationship between the environmental flow and the degradation of the ecosystems using Statistical Package for Social Science (SPSS) software. Ecosystem goods and services in the area quantify the status of the degradation of the ecosystem.
3. Results and Discussion
3.1. WUAs Strategies on Restoration
WUAs in Tanzania have three main tasks: (i) the collection of water fees, (ii) the maintenance of the infrastructure, and (iii) the scheduling and distribution of water. For the restoration of the environmental flow in MSC, most of the methods used by WUAs were the same. However, there were some differences due to their bylaws. WUAs have their own strategies, which are based on the environmental management act and the water resource management act, which guided them in managing water resources and the environment in general.
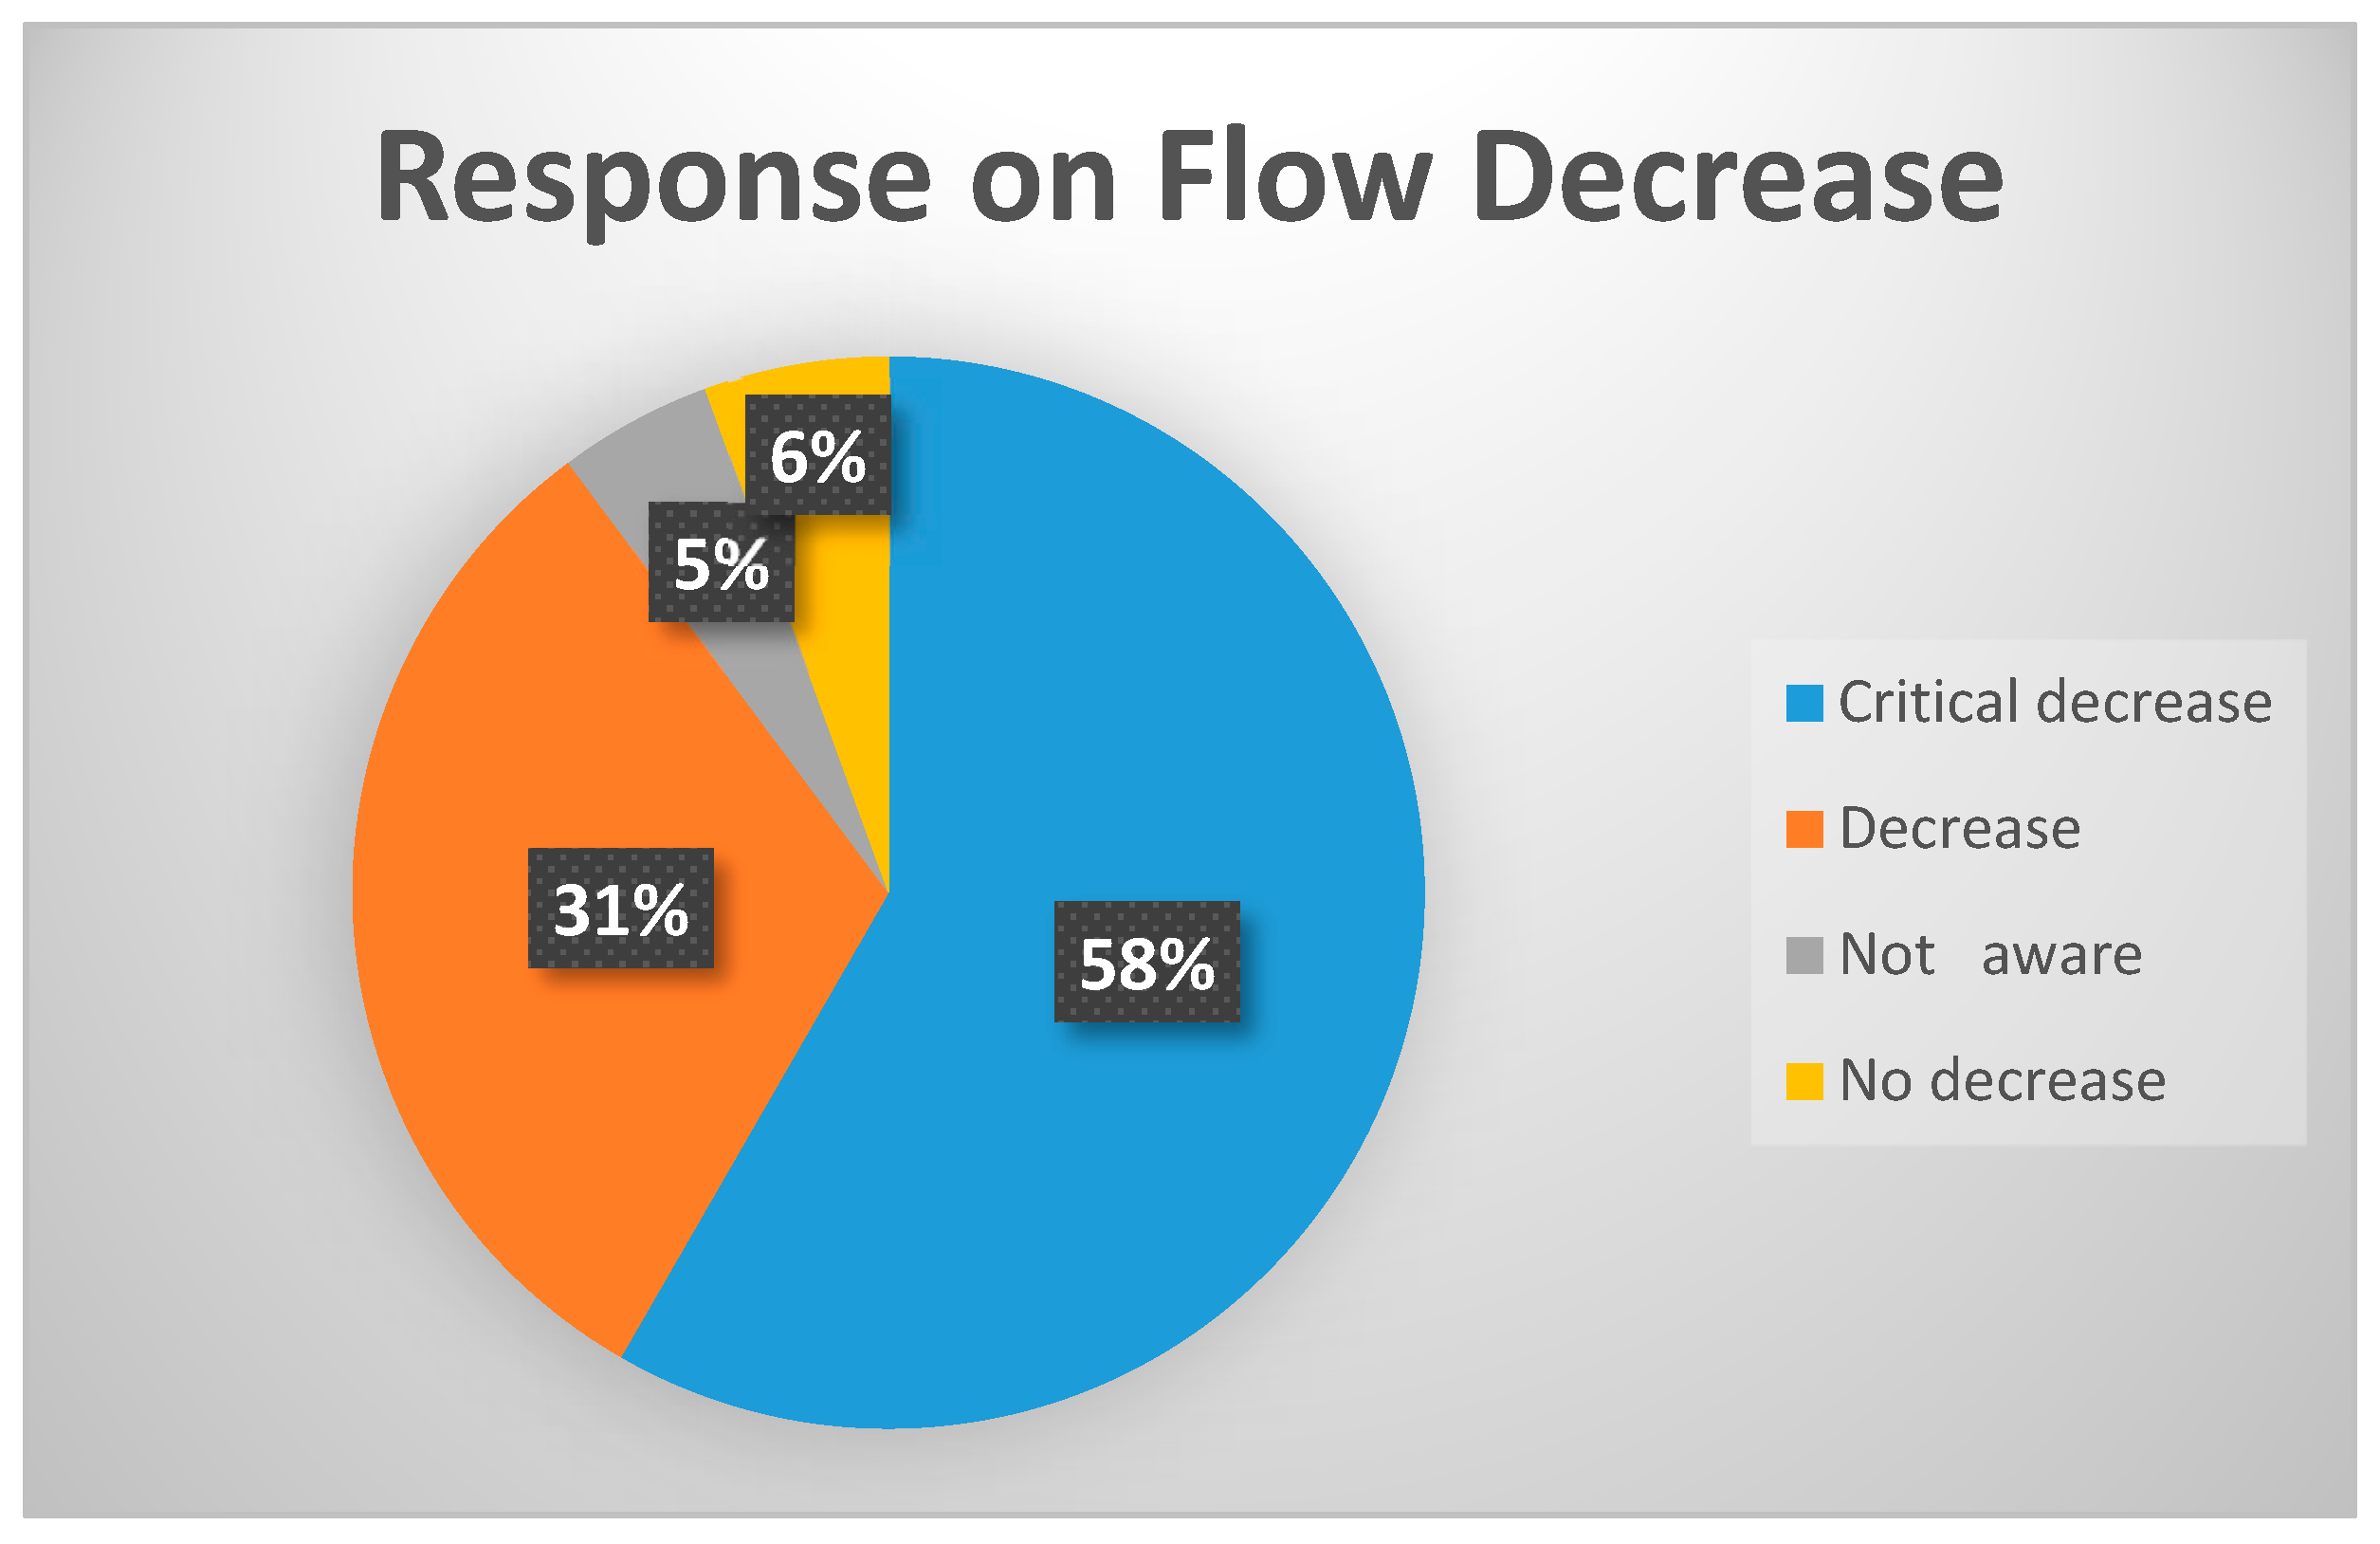
The results showed that villagers and WUAs were aware of the decrease of the flow in the rivers and its tributaries, as follows: 58% of the respondents were aware of the critical decrease of water flows within the sub-catchment, 31% reported that the decrease was not critical, 5% were not aware of any decrease, and 6% strongly disagreed about the decrease of the flow in the river. This is shown in Figure 3.
3.2. Land Use Management Restoration Strategies
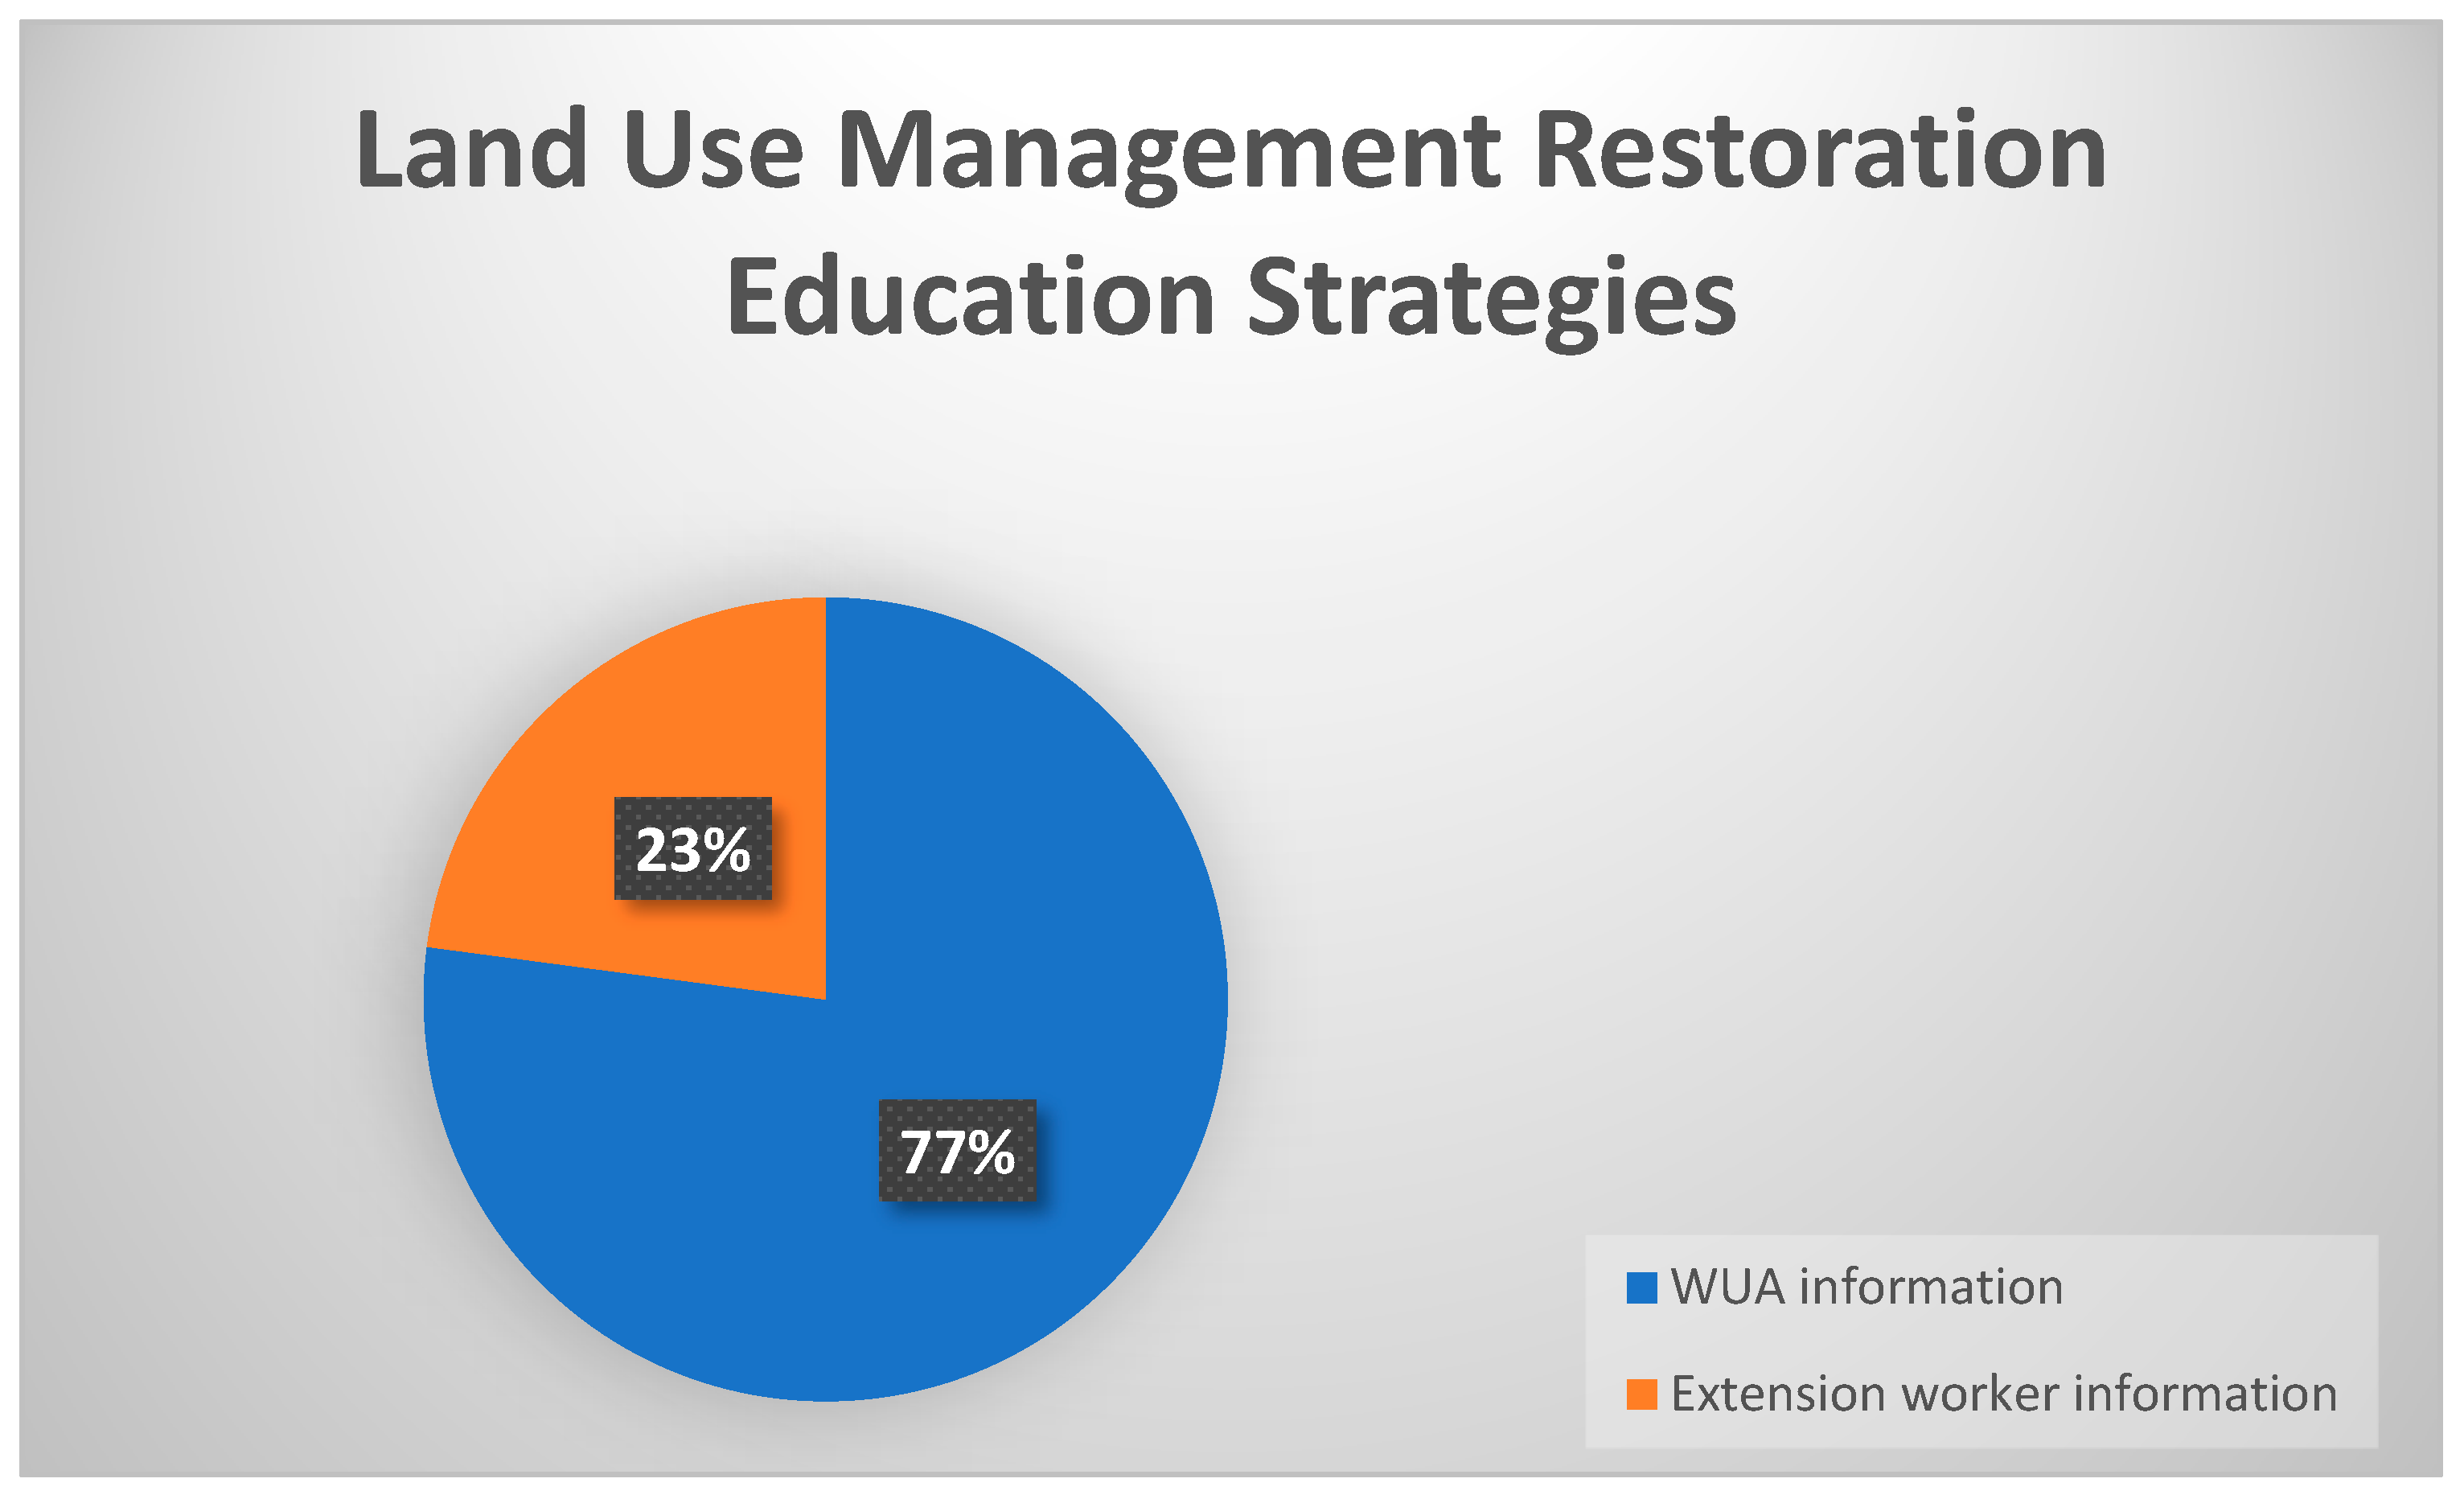
During the interviews and the focus group discussion, respondents reported on the use of the climate resilient crops in some of the areas and the cultivation of short-term seeds of rice that take a short time to mature without exhausting the land. Most of the farmers from the lower zone of the sub-catchment reported cultivating seeds that take a short time to mature so they can harvest them before the dry season and avoid encroachment of the flood plains and water source areas for cultivation. All the respondents from WUAs in the lower zone reported that they played a good role in educating farmers about the seeds to be used based on their availability and the irrigation time. A total of 77.08% of the respondents who were not from the WUAs agreed that they received information and education from WUAs regarding water availability and suitable seeds for cultivation, while 22.92% disagreed and reported that they got the information from the government extension workers who were working in their areas; see Figure 4. However, WUAs collected their money for the irrigation schemes operations.
Regarding land management, it was reported that WUAs tended to prevent all economic activities at the buffer zones of the rivers or near water sources to reduce erosion and siltation. WUAs also planted trees at the buffer zones (protected areas) according to the environmental act of 2004. According to the environmental act of 2004, 60 m from the water sources is considered to be reserved land (not to be used for any human activities).
3.3. Water Resource and Ecosystem Restoration Strategies
The Rufiji Basin Water Office is the responsible body for water permit holders, while WUA leaders have a mandate in supervising the use of water in the schemes through the collection of fees and by making sure that water is returned to the rivers for ecosystem needs. The results showed that WUAs were responsible for water allocation for the irrigation schemes, recommending users to the basin office for permission, and they were engaged in banning all washing activities in rivers or illegal fishing that may kill organisms.
For the management and the conservation of the water resources, WUAs used to fence-off all the restored and vulnerable water resources, dig up the buried springs and allow water-flow rotation during the dry periods for irrigators to ensure equity. This was done by considering the environmental flow within the sub-catchment and after the sub-catchment boundary for the Ihefu wetland downstream. However, users blamed WUAs for the shortage of water despite their payments while WUAs blamed the sub-catchment authority for granting permits to users that exceeded the capacity of the rivers, which was reported during FGD.
WUAs were involved in the mission of banning illegal fishing and the replanting of riparian vegetation in all rivers within the sub-catchment. WUAs reported that illegal fishing was one of the major problems causing the decrease in the flows because fishermen diverted the rivers and closed the rivers to catch fishes. Fishermen made rectangle-shaped ridges in the rivers to catch fishes by pumping all water in those rectangles out. Encouraging afforestation and reforestation for carbon sequestration, WUAs planted about 166,500 trees between 2007 and 2017 with an average of 27,750 trees per association and an average of 2775 trees per year. WUA leaders reported being aware of the role of trees on climate change mitigation when they emphasized that they distributed tree seedlings to the villagers on World Environmental Day. All the WUAs surveyed reported their contribution in increasing awareness in villages about environmental conservation and the importance of water resource management to people and the environment in general.
3.4. The Effect of Land Uses and Flow Change on the Environmental Flow and the Ecosystem
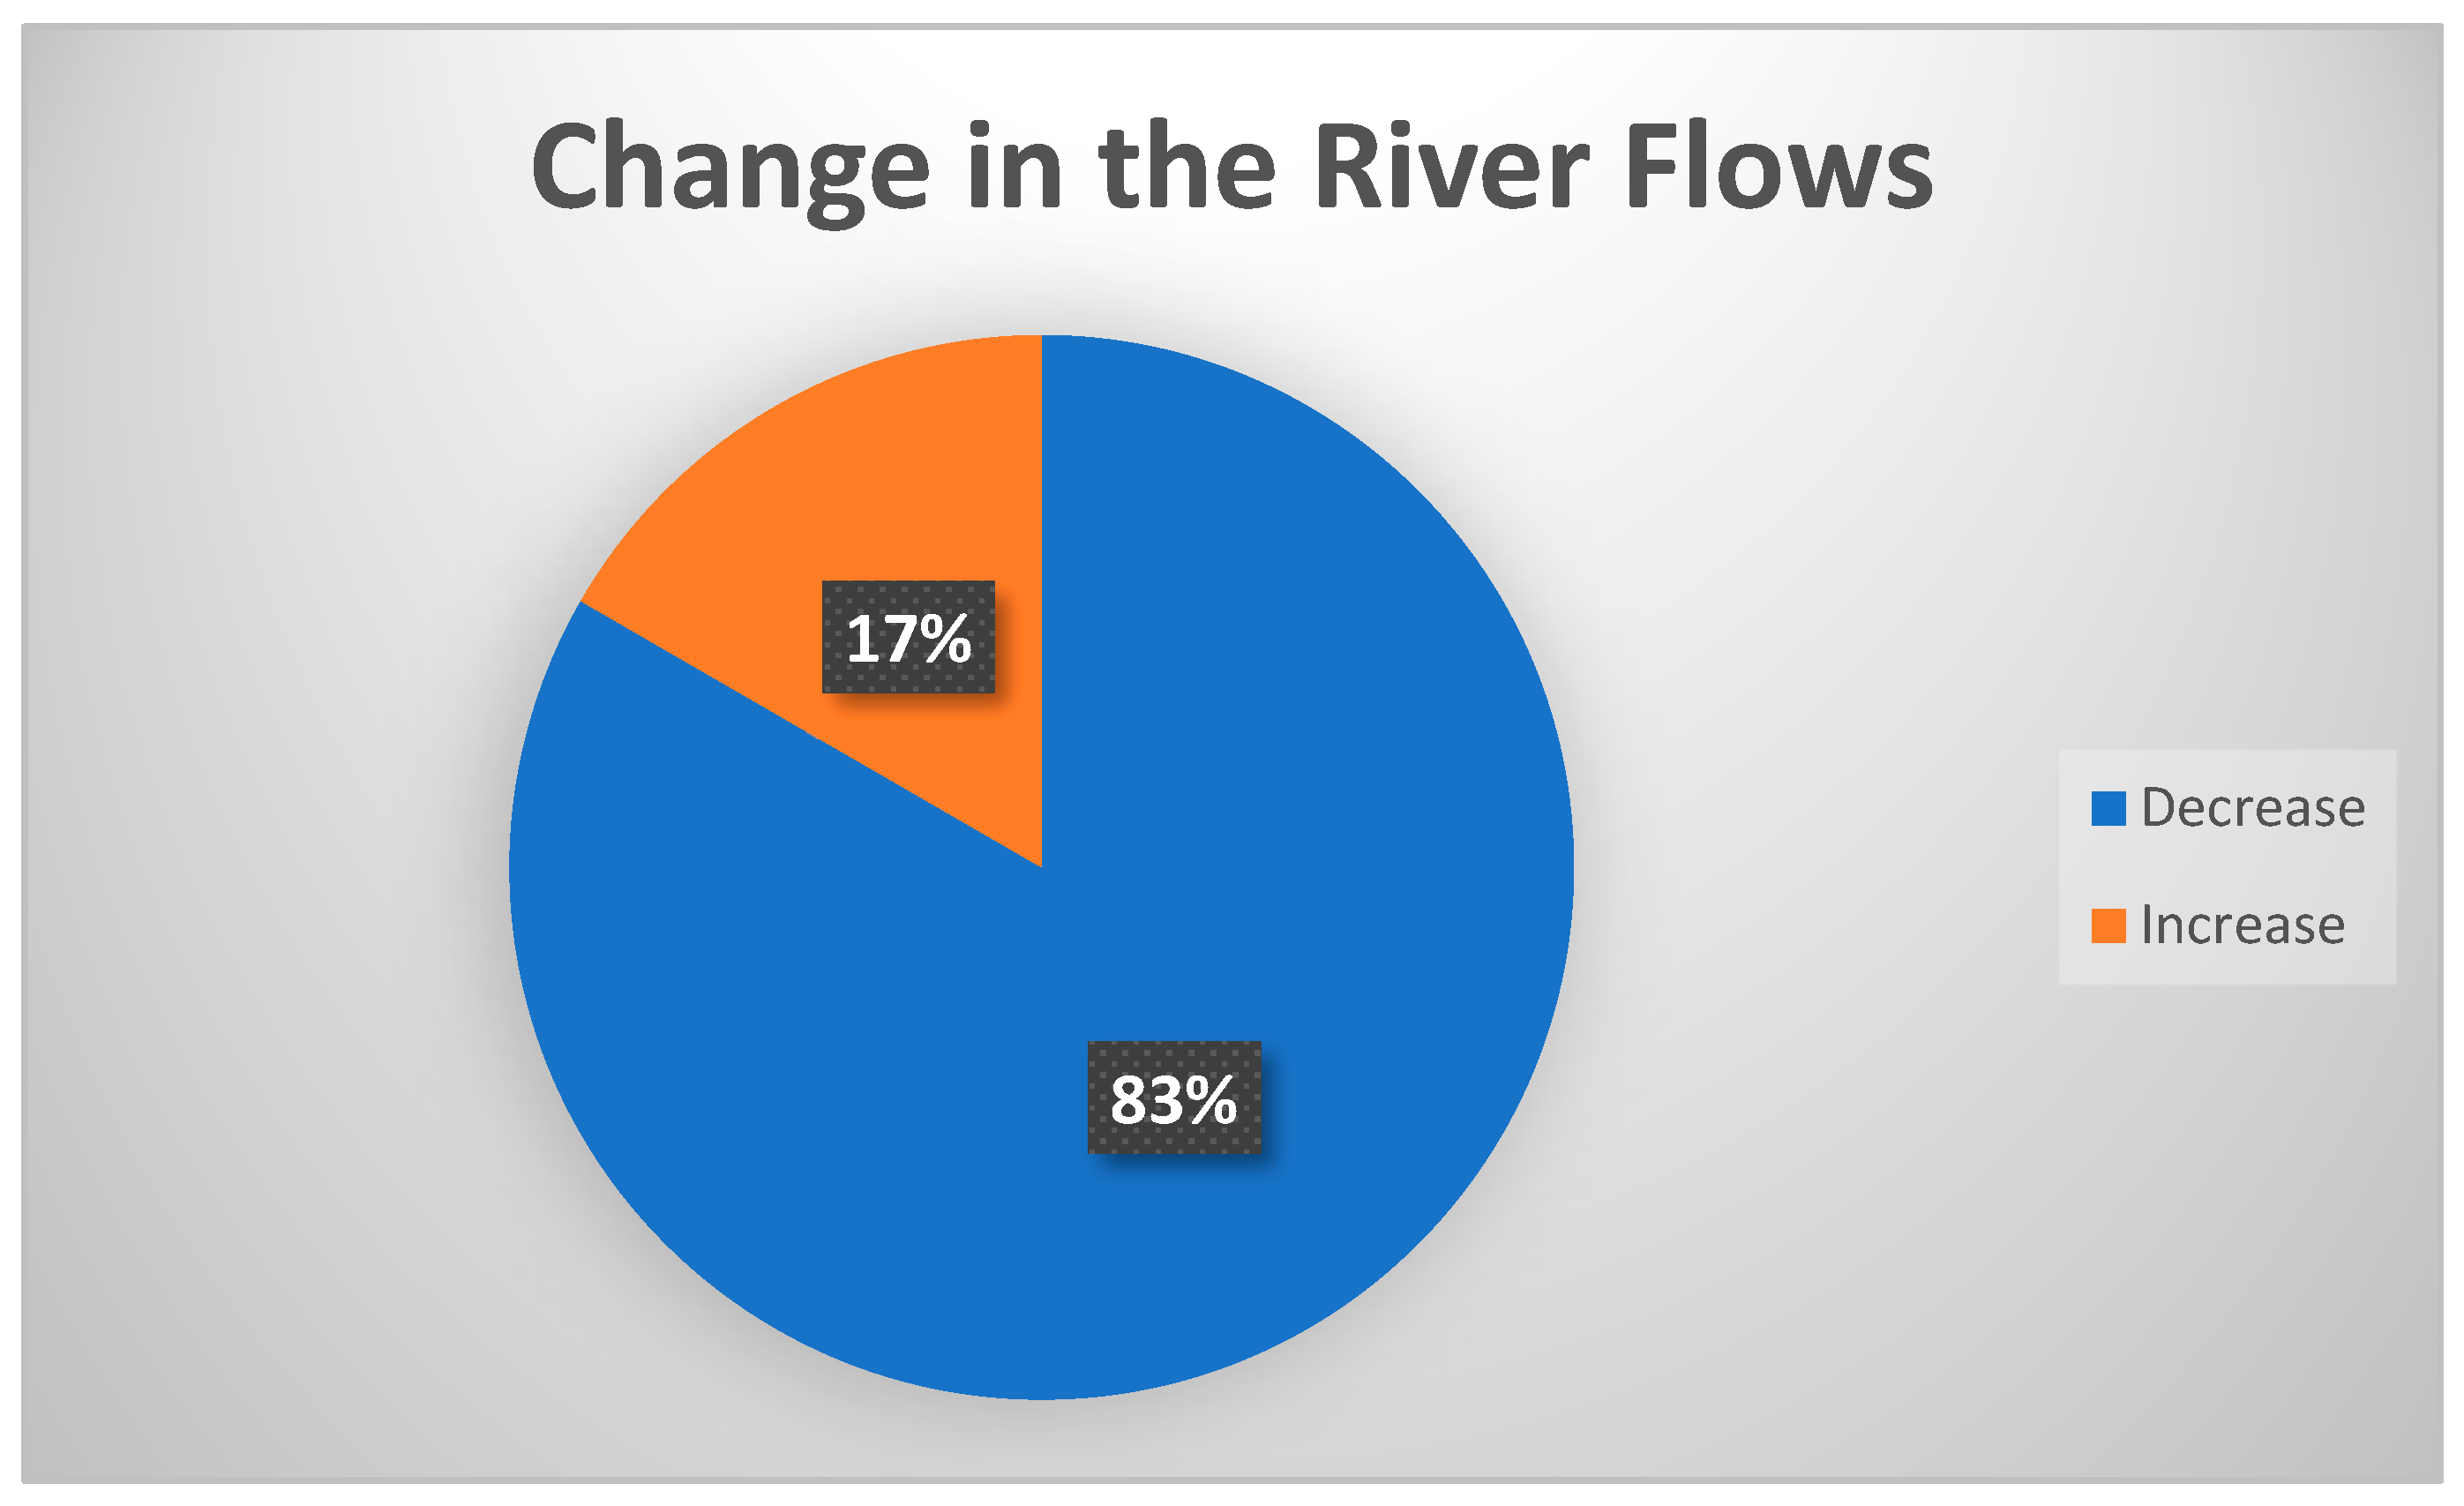
A total of 83.3% of the respondents agreed on the decrease in the flow of the water in the sub-catchment, explaining it to be critical in the dry season, while 16.7% of the respondents said that there was an increase in the flow within the sub-catchment. The increase in the flow was reported to be the result of WUA activities in the area after the restoration of some of the water sources, which were already dried up before the engagement of the WUAs in water resource management. From the Mkoji juu association, it was reported during FGD that the restoration activities had revived the flow of the Shamwengo water resource and increased the flow to the Ipatagwa river. Land use activities were reported to be the reason behind the decreasing flows and increasing ecosystem degradation. Table 1 presents dates of dryness and flow resumptions for some rivers in the Mkoji sub-catchment.
3.5. Agriculture
All the respondents from the middle and the lower zones of the sub-catchment reported that they noticed a zero flow in their areas during the dry season. During the FGD that was conducted in the lower and middle zones of the sub-catchment, the participants agreed that the water decrease was due to the extension of the agriculture activities. The interviews showed that 83% of the respondents agreed that agriculture activities were the main reason behind the decreasing water flow in the river, as shown in Figure 5. Participants also agreed that the growth of agriculture activities contributed to the degradation of the ecosystem due to traditional agriculture practices. In this regard, most farmers tended to cut down forests to extend their farms, which extended the cultivating areas to reach the flood plains and along the river banks. This extension degraded the riparian ecosystems and blocked the way for the aquatic fauna to move up and down the stream. The increase in water abstraction for irrigation decreased the flow and reduced habitats and refugia for the aquatic animals, hence degrading the ecosystem as a holistic system. From the department of agriculture and the water basin, it was reported that there was an increase in the number of irrigation schemes from 18 in 2009 in all six associations in the sub-catchment to 37 in only five associations out of six within the area [21]. The zero flow in the Mkoji river itself cut the connections between the downstream and upstream ecosystems of the aquatic ecosystem.
On the other hand, responses from the departments of agriculture and irrigation mentioned that the presence of both traditional and developed irrigation schemes in the area and the increase in the number of irrigation schemes in the sub-catchment decreased the flows. These results were the same in 2005 as those presented by [27].
The department of natural resources under the forests office and the environmental office reported that the environmental destruction in various areas was due to human activities, which reduced water quality as well, as shown in Table 2. They spotted that the Matajiwazi area was the most destructive, while the Mromboji River was reported to be dried up in every dry season.
Table 2 showed that the levels of some parameters are higher than the allowable limits. Looking into all water resources, the levels of coliforms were higher than the normal allowable ranges for the country. The presence of total coliform in water indicated the presence of poor sanitation in these areas. Grazing along the water resources, as it was reported, was one of the reasons for the presence of these coliforms in water. Turbidity and colour were also shown to be very high due to the extension of agriculture activities around the water resources.
In places where there were improved irrigation schemes, such as in Ipatagwa, Motombaya, Luanda Majenje and Majengo, the irrigation committees were more active and responsible for the allocation and management of irrigation water use. The area under rainfed agriculture was identified to be larger in the lower Mkoji followed by the middle Mkoji, while the upper Mkoji zone had the smallest area under rainfed agriculture compared to all other zones of the sub-catchment. This could be due to the fact that a large amount of water was used in the upper Mkoji, which ends up mostly in the middle part of the sub-catchment.
3.6. Livestock Keeping
After making the land near the Ihefu wetland a reserved area, livestock keepers had to move to Mkoji, which became populated with animal keepers. The increase in livestock reduced the land’s carrying capacity and increased water loss through evapotranspiration. During the FGD, it was reported that cattle grazing near water resources was one of the causes of riparian ecosystem degradation. A total of 75% of the questionnaires reported on the decrease in the fisheries in their rivers due to illegal fishing. A total of 72% of questionnaire respondents reported on the loss of riparian vegetation in most of their rivers. Out of those respondents, 55.8% described it as a critical decrease while the rest said it is a normal decrease.
3.7. Settlement and Infrastructure Development
The increase in human population expanded settlement over green areas and changed the land cover, which caused a change in the flow regime in the rivers and the ecosystem of the area. Reducing the green areas for settlement increased the bare lands and soil erosion due to the lack of the compactness of the soil particles. During the FGDs, respondents were aware of the soil erosion taking place in the area and its effects on the flow. It was reported that people built their houses in the course of seasonal rivers during the dry period, which changed the water flow during the rainy season. Rivers such as the Mlowo and Gwiri valley in the Lwiwa area changed their flows and had no water-ways, which forced the water to flow over the land during the rainy season. Changes in the flow and overflowing of water decreased fishing and destroyed the fish habitats and the nursery ground. Data from the fisheries office showed that fisheries’ production dropped from 700 tonnes per year to 216 tonnes per year in 2017. Settlements in the river ways decreased water quality due to the poor sanitation, as shown by the water quality data from the water basin office.
Infrastructure development altered the river flow regime, degraded the riparian vegetations and destroyed the aquatic ecosystems. Modifications of these rivers were reported to be among the reasons affecting the flow and the aquatic ecosystem in general. During the FGDs that were conducted in the lower zone of the sub-catchment, it was reported that the construction of the irrigation schemes in the upper zones was the main reason for the water over-abstraction, which decreased the flow downstream to reach zero flow in some rivers during the dry season. From the questionnaires from the lower zone of the sub-catchment, 82% of the respondents reported a decrease of flow due to the modification of the river and the regulation of the flow by the developed irrigation schemes that were built in the upper zone. The data showed that, during the years 2003 and 2004, the Lwanyo and Mlowo rivers had coefficients of abstractions of almost 100% and 95%, respectively (the coefficient of abstraction means the proportion of water allowed from various uses to allow the continuity of the environmental flow in the rivers).
3.8. Climate Change Effects and Variability for Environmental Flow and the Ecosystem
All the respondents were asked if they are aware of climate change and variability. The results showed that 91% of the respondents were aware of these factors. Respondents explained climate change in different ways. Most of the interviewees mentioned that training was their source of information, while others had mixed answers on how they were aware of climate change and variability. The extent to which respondents were aware of climate change and variability were as follows: 56% medium, 32% high, and 12% low awareness. Regarding how the respondents got information about climate change, 54% of the respondents got the information from formal studies and trainings, 27% from the media and through informal studies, while 19% got it through local perceptions of climate change and variability identification.
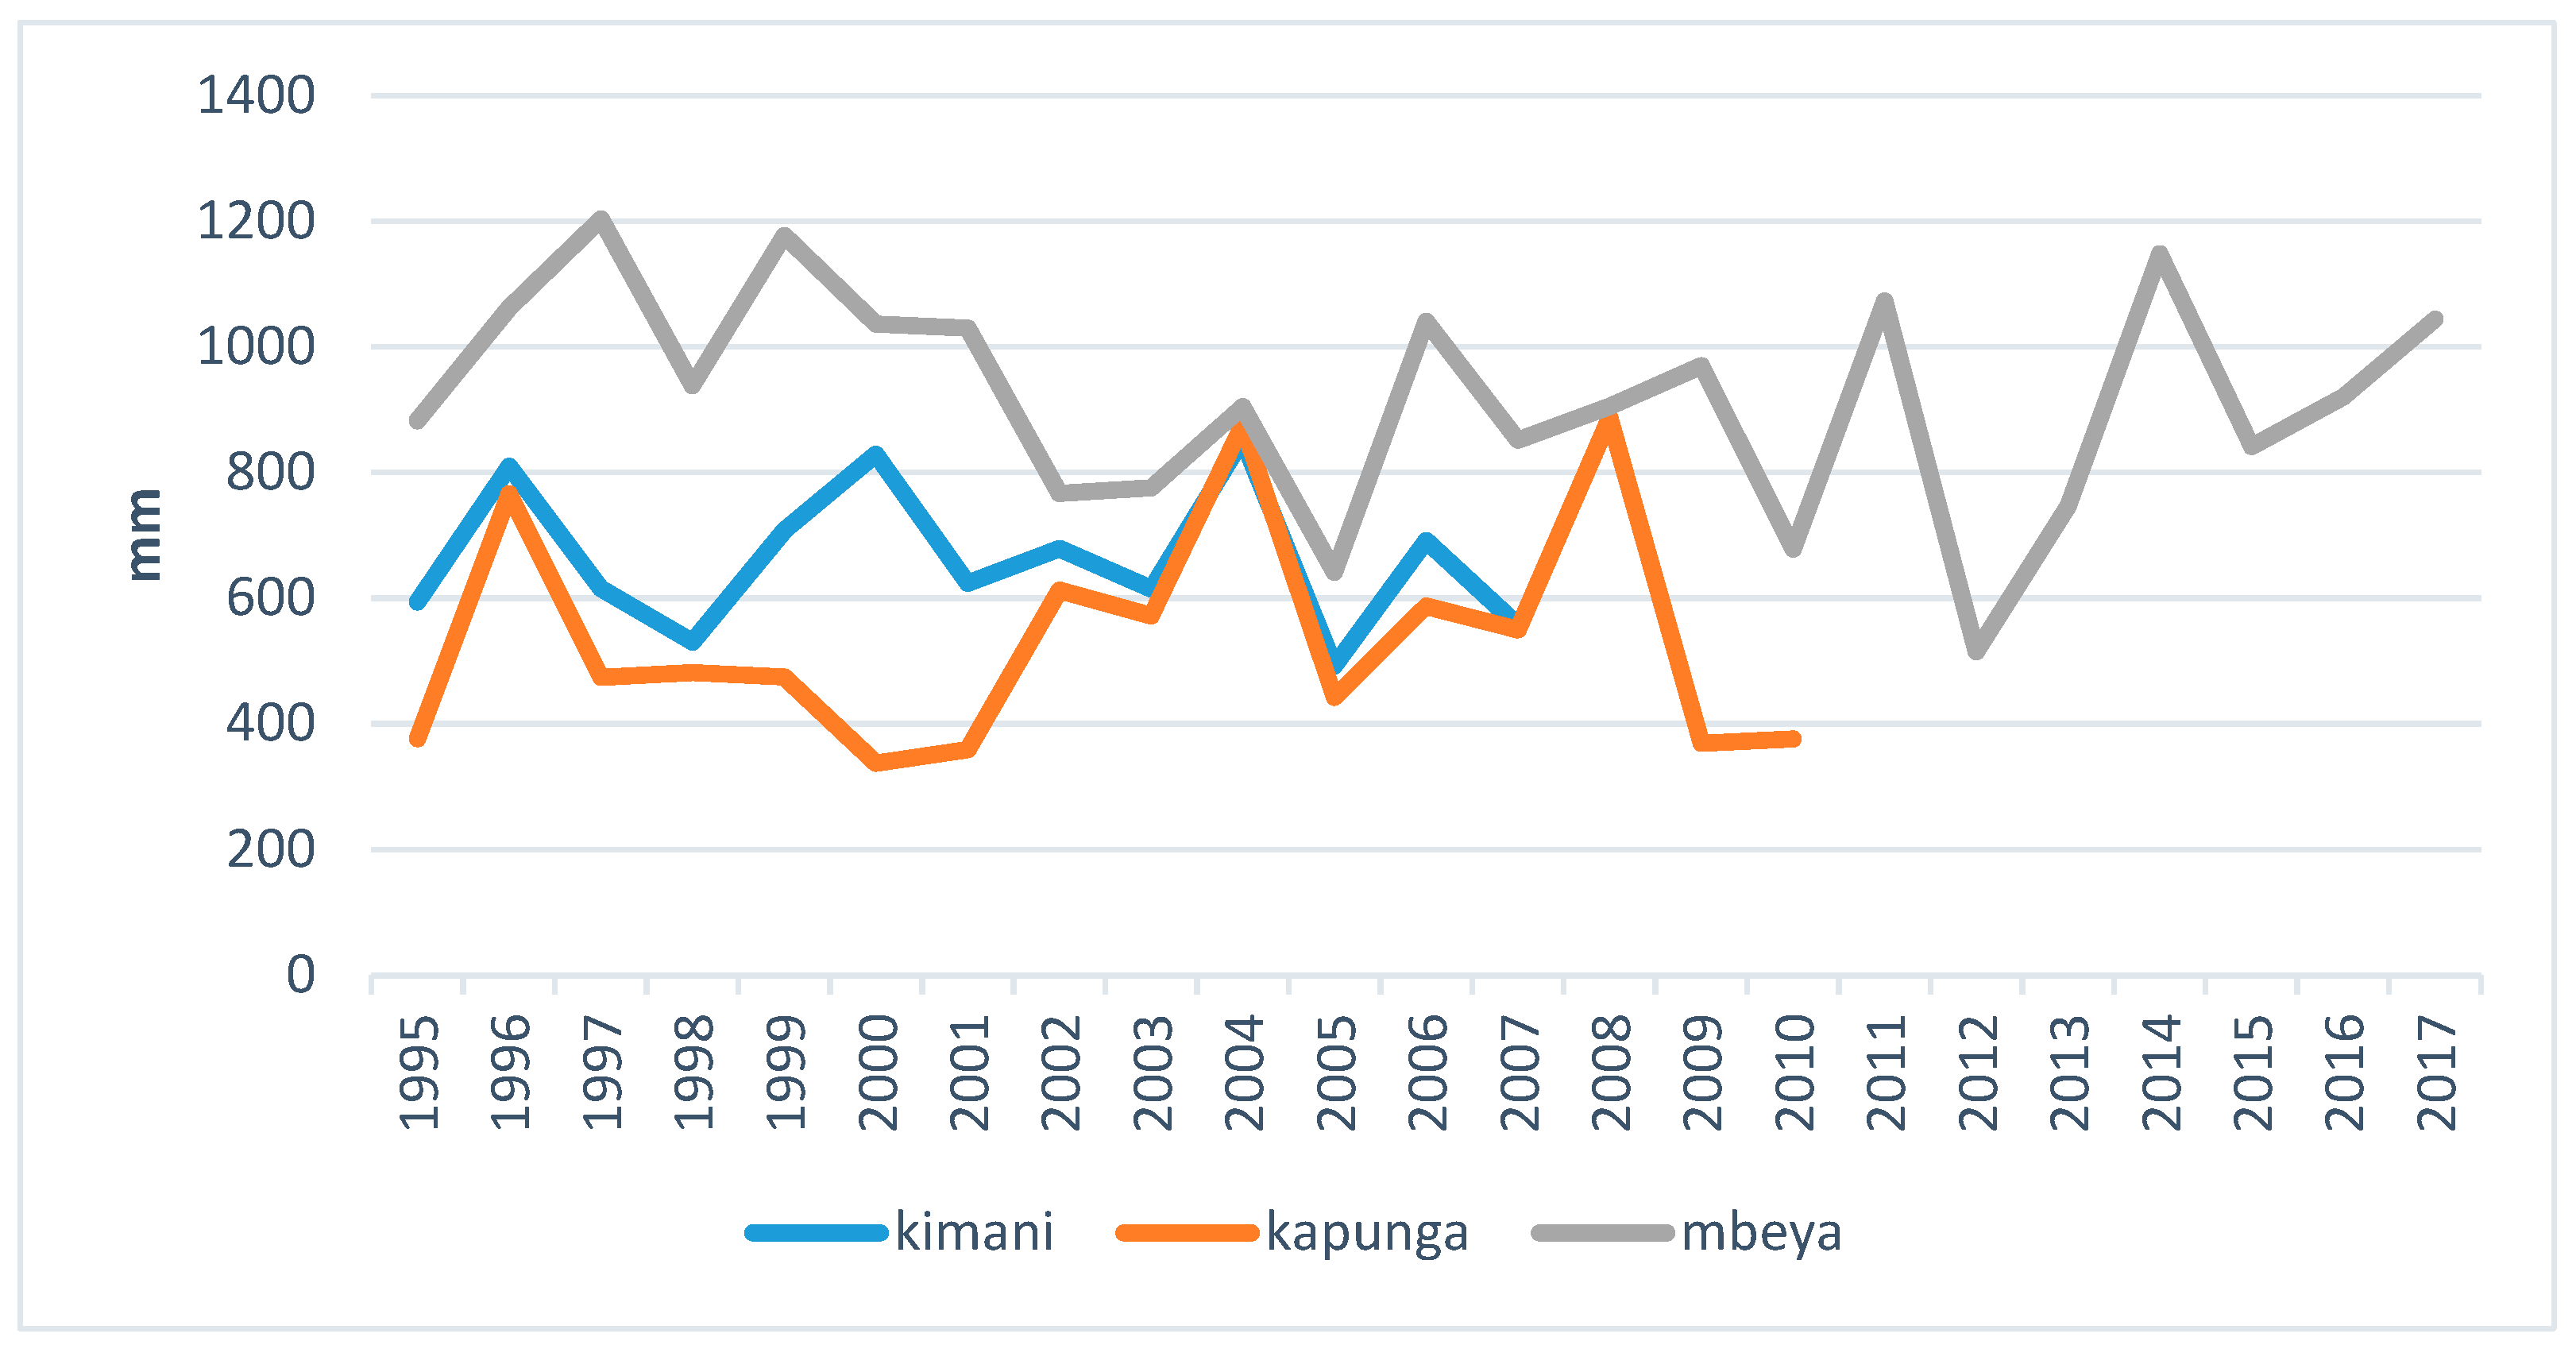
The data for rainfall plotted in Figure 6 showed that there was not much difference in the rainfall amount from 1995 to 2017 for the upper, lower and middle Mkoji. Figure 6 shows a decrease in the rainfall in 2005, with a rainfall amount below 500 mm in both the middle and lower zones of the sub-catchment as it was reported during the interviews and the FGD, which mentioned that there were seasonal and spatial rainfall changes with early starts and early stops of rainfall compared to the previous years. It was also reported that there was a change in the duration of the rainfall. Changes in rainfall patterns were reported to be a reason for birds’ migration to other areas in the dry seasons due to the drying up of the rivers and the disappearance of riparian vegetation.
Evaporation data showed a variation within the sub-catchment zones, with a low rate of evaporation at a higher altitude and high rate of evaporation in the lower Mkoji. Results from the evaporation pan method were 2430 mm/year at Igurusi (the middle zone) and 1890 mm/year in Mbeya (the upper zone). In this regard, many farmers reported that climate change affected crop water requirements by increasing water demand for the irrigation activities.
Statistical analysis showed no significant direct correlation between the flow of the water in the rivers and the rainfall in the area. However, an indirect relationship can be seen in the wet season as the high rainfall influenced high flows while low rainfall had low flows. In other words, the longer the rainy season, the longer the high flows, and vice versa.
3.9. WUAs’ Role in Climate Change Mitigation Measures
Some of the WUAs acknowledged that training opportunities regarding climate change and variability issues were given in their areas while others had not received training. WUAs were engaged in planting trees near the water resources and along the river banks in collaboration with the Tanzania Forest Service Agency (TFS) as a kind of restoration and climate mitigation strategy to increase the infiltration and holding capacity of the water and to reduce evaporation rates. WUAs also reported the awareness they have on the contributions of trees in increasing humus content in the soil and reducing the problem of infertile and unsuitable soil for cultivation. Crop rotation and crop changes were among the strategies that WUAs suggested for mitigating climate change and variability in the area. They suggested that crops that used a small amount of water and took a short time to mature should be considered by farmers for water use efficiency in the Mkoji area. Water rationing through crop changes would make it possible for farmers to harvest even during the dry season despite the shortage of water. Farmers indicated that planting drought-resistant crops such as millet and sorghum and early maturing varieties such as beans were important strategies during drought years as a measure of reducing risks and maximising returns. NGOs were reported to be involved in the WUA awareness activities. During the FGDs with the upper Mkoji association, it was reported that they had a project with the African Wildlife Foundation (AWF) on raising awareness of WUAs on afforestation and reforestation programs in the springs to restore water flow in the sub-catchment as it is located in the upstream, the origin of most of the water resources.
WUAs reported that the use of climate information and hydrological data in water rotation and water allocation for the irrigation made it possible for them to manage the allocation of water in the irrigation schemes while managing the environmental flow within the rivers without harming the water resources. They also reported that the data were useful for forecasting the agricultural season and advising farmers on the situation. Variability in terms of the duration or amount of the rainfall necessitated the use of sustainable practices to mitigate the climate’s influences on land degradation. The data also helped WUAs in the management of the water resources by advising the farmers on the reduction of the land size for cultivation depending on the available water.
3.10. Statistical Analysis
Statistical data showed that there was a significant correlation between the flow and the aquatic ecosystem. The statistical relationship was in line with the primary data collected from various sources and as explained above: 89% agreed on the decreased flow, from which 75% of the respondents agreed on the decrease in the fish catch in the sub-catchment due to many reasons such as the change of the flow, drying up of rivers, the change of the rivers and land use changes.
This statistical relationship, shown in Table 3, shows that as rainfall increases, the aquatic ecosystem gets better, and as rainfall decreases, the aquatic ecosystem gets worse. In this regard, rainfall increases the flow of water in the river, which increases the number of refugia and habitats for fish, the nutrient load and food fir fish.
4. Conclusions
This paper aimed to assess the role of WUAs in Tanzania, taking the Mkoji sub-catchment as a case study. Questionnaires, interviews, focus group discussions, government documents and scientific papers were the main sources of information for the used method and the achieved results. The paper concluded that WUAs had played a role in the restoration of the decreased environmental flow and the degraded freshwater ecosystem through the use of various strategies in managing water resources and restoring land. Moreover, WUAs were aware of climate change effects; therefore, they worked together with other NGOs and governmental bodies on some mitigation measures and activities by addressing water scarcity in agriculture according to the water resource management act and the environmental management act of Tanzania. WUAs played a good role in helping farmers regarding crops rotation, patterns and selection, in addition to managing irrigation practices, which have reduced the conflicts in the river basin in general.
However, WUAs need more support and cooperation to give positive results regarding water shortages and the drying up of some of rivers. Consequently, the government and non-governmental organizations should implement more specific resources (funds, trainings and infrastructure such as storage facilities). Therefore, water basin authorities should support and contribute to the capacity building and increase the awareness of the WUAs in order to strengthen their roles in managing water resources, and the ministry of water and irrigation should give more focus and conduct more studies regarding the environmental flow issue in the basin.
Author Contributions
Methodology, H.N., K.A.M.; Analysis, H.N.; Resources, K.A.M., H.N.; Data & field visits, H.N.; Writing-Original Draft Preparation H.N.; Writing Review, Editing and Submission, K.A.M.; Supervision, K.A.M.; Open Access Publication, K.A.M.
Funding
This research was funded by the African Union Commission and GIZ.
Acknowledgments
Background research for this article was done in the context of master’s thesis in water policy at PAUWES. Therefore, the authors thank the African Union Commission and GIZ for funding this research and the Centre for Middle Eastern Studies at Lund University for funding the publication of this paper in an open access journal.
Conflicts of Interest
The authors declare no conflict of interest, the funders had no role in the design of the study; in the collection, analyses, or interpretation of data; in the writing of the manuscript, and in the decision to publish the results.
References
- Forslund, A.; Renöfält, B.M.; Barchiesi, S.; Cross, K.; Davidson, S.; Farrell, T.; Korsgaard, L.; Krchnak, K.; McClain, M.; Meijer, K.; et al. Securing Water for Ecosystems and Human Well-Being: The Importance of Environmental flow. In Proceedings of the World Water Week, Stockholm, Sweden, 16–22 August 2009; Available online: https://cmsdata.iucn.org/downloads/securing_water_for_ecosystems_and_human_well_being.pdf (accessed on 12 November 2018).
- Overton, I.C.; Smith, D.M.; Dalton, J.; Barchiesi, S.; Acreman, M.C.; Stromberg, J.C.; Kirby, J.M. Implementing environmental flows in integrated water resources management and the ecosystem approach. Hydrol. Sci. J. 2014, 59, 860–877. [Google Scholar] [CrossRef] [Green Version]
- Bastian, O.; Grunewald, K.; Syrbe, R.-U. Terrestrial Ecosystem Services in River Basins: An Overview and an Assessment Framework. In Ecosystem Services and River Basin Ecohydrology; Springer: Dordrecht, The Netherlands, 2015; pp. 107–132. [Google Scholar]
- Sokile, C.S.; Koppen, B. Local water rights and local water user entities: The unsung heroines of water resource management in Tanzania. Phys. Chem. Earth 2004, 29, 1349–1356. [Google Scholar] [CrossRef]
- Poff, N.L.; Zimmerman, K.H.J. Ecological responses to altered flow regimes: A literature review to inform the science and management of environmental flows. Environmental Flows. Sci. Manag. 2010, 55, 194–205. [Google Scholar]
- Busch, M.; La Notte, A.; Laporte, V.; Erhard, M. Potentials of quantitative and qualitative approaches to assessing ecosystem services. Ecol. Indic. 2012, 21, 89–103. [Google Scholar] [CrossRef]
- Muyungi, R.S. Managing Land use, Protecting Land and Mitigating Land Degradation: Tanzania Case Study. In Climate and Land Degradation. Environmental Science and Engineering 2007; Sivakumar, M.V.K., Ndiangui, N., Eds.; Springer: Berlin/Heidelberg, Germany, 2007. [Google Scholar] [CrossRef]
- Silas, S.R. Reducing Impact of Land Degradation in Tanzania: Do Incentive Market Based Mechanisms Work for Sustainable Land Management? J. Sustain. Dev. 2014. [Google Scholar] [CrossRef]
- Thompson, J.R.; Laizé, C.L.R.; Green, A.J.; Acreman, M.C.; Kingston, D.G. Climate change uncertainty in environmental flows for the Mekong River. Hydrol. Sci. J. 2014, 59, 935–954. [Google Scholar] [CrossRef] [Green Version]
- Dyer, F.; ElSawah, S.; Croke, B.; Griffiths, R.; Harrison, E.; Lucena-Moya, L.P.; Jakeman, A. The effects of climate change on ecologically relevant flow regime and water quality attributes. Stoch. Environ. Res. Risk Assess. 2014, 28, 67–82. [Google Scholar] [CrossRef]
- Noel, S. The Economies of Climate Change in Tanzania, Water Resources. Stockholm. Environmental Institute SEI-Africa Centre Institute of Resource Assessment, University of Dar es Salaam. 2011. Available online: http://economics-of-cc-in-tanzania.org/images/Water_resources_final_.pdf (accessed on 12 November 2018).
- Merritt, D.M.; Michael, L.; Scott, M.D.; Poff, L.N.; Gregor, T.A.; Lytle, A.D. Theory, methods and tools for determining environmental flows for riparian vegetation: Riparian vegetation-flow response guilds. Freshwater Biol. 2010, 55, 206–225. [Google Scholar] [CrossRef]
- Kangalawe, R.; Mwakalila, S.; Masolwa, P. Climate Change Impacts, Local Knowledge and Coping Strategies in the Great Ruaha River Catchment Area, Tanzania. Nat. Resour. 2011, 2, 212–223. [Google Scholar] [CrossRef]
- WWF Tanzania Country Office (WWF-TCO). Assessing Environmental Flow Assessment. The Great Ruaha River and Ihefu Wetlands, Tanzania, and Options for the Restoration of Dry Season Flows; WWF Tanzania Country Office (WWF-TCO): Dar es Salaam, Tanzania, 2010. [Google Scholar]
- Mourad, K.A. Marginal and Virtual Water for Sustainable Water Resources Management in Syria. Ph.D. Thesis, Lund University, Lund, Sweden, 2012. [Google Scholar]
- Zhang, L.; Heerink, N.; Dries, L.; Shi, X. Water user’s associations and irrigation water productivity in Northern China. Ecol. Econ. 2013, 95, 128–136. [Google Scholar] [CrossRef]
- Aboniyo, J.; Mourad, K.A. Role of Community Based Organization in Transferring Climate Change Information in Rwanda. Res. J. Environ. Sci. 2017, 11, 156–169. [Google Scholar] [CrossRef]
- Derman, B.; Prabhakaran, P. Reflections on the formulation and implementation of IWRM in Southern Africa from a gender perspective. Water Altern. 2016, 9, 644–661. [Google Scholar]
- Ndelwa, L.L. Role of Water User Associations in the Management of Water Use Conflicts: A Case of Ilonga Sub-Catchment in Wami-Ruvu Basin, Tanzania. Master’s Thesis, Sokoine University of Agriculture, Morogoro, Tanzania, 2014. Available online: http://www.suaire.suanet.ac.tz:8080/xmlui/bitstream/handle/123456789/503/LONZE%20LUSANI%20NDELWA.pdf?sequence=1&isAllowed=y (accessed on 14 January 2019).
- Hooja, R. Below the Third Tier Water User Association in India. 2005. Available online: http://www.forumfed.org/libdocs/Misc/0312-in-Rakesh-Hooja1.pdf (accessed on 22 December 2018).
- Lusuva, A.E. An Assessment of Gender Mainstreaming in Water Resources Management: A Case Study of Mkoji Sub Catchment in Usangu Plains, Tanzania. Master’s Thesis, University of Zimbabwe, Harare, Zimbabwe, 2012. Available online: http://ir.uz.ac.zw/handle/10646/1034 (accessed on 5 January 2019).
- SLU. Bilateral Collaboration with Tanzania. 2017. Available online: https://www.slu.se/en/collaboration/international/slu-global/projects-and-themes/capacity-development/tanzania1/ (accessed on 5 January 2019).
- Carter, N.; Bryant-Lukosius, D.; DiCenso, A.; Blythe, J.; Neville, A.J. The use of triangulation in qualitative research. Oncol. Nurs. Forum 2014, 41, 545–547. [Google Scholar] [CrossRef] [PubMed]
- Zeng, Y.; Xie, Z.; Yu, Y.; Liu, S.; Wang, L.; Jia, B.; Qin, P.; Chen, Y. Ecohydrological effects of stream–aquifer water interaction: A case study of the Heihe River basin, northwestern China. Hydrol. Earth Syst. Sci. 2016, 20, 2333–2352. [Google Scholar] [CrossRef]
- Chase, J.W.; Benoy, G.A.; Hann, S.W.R.; Culp, J.M. Small differences in riparian vegetation significantly reduce land use impacts on stream flow and water quality in small agricultural watersheds. J. Soil Water Conserv. 2016, 71, 194–205. [Google Scholar] [CrossRef]
- Garssen, A.G.; Baattrup-Pedersen, A.; Riis, T.; Raven, B.M.; Hoffman, C.C.; Verhoeven, J.T.A.; Soons, M.B. Effects of increased flooding on riparian vegetation: Field experiments simulating climate change along five European lowland streams. Glob. Chang. Biol. 2017, 23, 3052–3063. [Google Scholar] [CrossRef] [PubMed] [Green Version]
- Rajabu, K.R.M.; Henry, F.; Mahoo, H.F.; Sally, H. Water abstraction and use patterns and their implications on downstream river flows: A case study of Mkoji Sub-catchment in Tanzania. In Proceedings of the East Africa Integrated River Basin Management Conference, Morogoro, Tanzania, 7–9 March 2005. Theme Four: Water Governance and Institutions; Lankford, B.A., Mahoo, H.F., Eds.; Soil-Water Management Research Group, Sokoine University of Agriculture: Morogoro, Tanzania, 2005; pp. 233–245. Available online: https://cgspace.cgiar.org/handle/10568/38290 (accessed on 5 January 2019).
Figure 1.
Map of Tanzania and its borders [22].
Figure 1.
Map of Tanzania and its borders [22].

Figure 2.
The Mkoji sub-catchment.

Figure 3.
Respondents’ response percentages on the flow decrease.

Figure 4.
Non-WUA responses on the climate resilience education on land management.

Figure 5.
Change of the river flow in the Mkoji sub-catchment.

Figure 6.
Rainfall trends in the sub-catchment (1995–2017) in mm.


Table 1.
Flow resumption in the Mkoji sub-catchment.
| NO | River Name | Start of Zero Flow | Resumption of Flow | Zero-Flow Days | Remarks |
|---|---|---|---|---|---|
| 1 | Lwanyo | November 2003 | December 2003 | 41 | The river never dried in 2004 |
| 2 | Mswiswi | 2003 | 3 | The river never dried continuously due to rotational water abstraction schedules | |
| 2004 | 2 | ||||
| 3 | Mkoji | September 2003 | December 2003 | 102 | |
| August 2004 | December 2004 | 121 | |||
| 4 | Mlowo | June 2003 | January 2004 | 198 | |
| July 2004 | December 2004 | 136 |
Table 2.
Water quality in the different areas in the catchment and their allowable limits.
| Parameter | Mkoji | Umrobo | Nsalaga | Ipatagwa | Mlowo | Inyala | Hayuya | Uta | Mwambalizi | Allowable Limits in Tanzania |
|---|---|---|---|---|---|---|---|---|---|---|
| Dissolved Oxygen DO (mg/L) | 6.9 | 7.43 | 7.6 | 6.4 | 8.08 | 9.54 | 0.85 | 9 | 8.7 | 5 to 9.5 |
| Sediment (mg/L) | 0.2 | 0.1 | 0.1 | 0.1 | 0.2 | 0.1 | 0.1 | 0.2 | 0.1 | 0 |
| Colour (Pt/Co) | 783 | 753 | 41 | 475 | 789 | 14 | 328 | 867 | 296 | 50 |
| Turbidity (NTU) | 386 | 278 | 9.3 | 251 | 414 | 4.45 | 103 | 452 | 91.3 | 25 |
| Total coliform (nu/100 mL) | 110 | 144 | 152 | 20 | 120 | 82 | 30 | 88 | 130 | 0 |
| Faecal coliform (nu/100 mL) | 235 | 295 | 320 | 56 | 280 | 180 | 67 | 190 | 290 | 0 |
| pH (mg/L) | 7.59 | 6.63 | 5.72 | 6.82 | 6.63 | 5.21 | 6.59 | 6.25 | 6.38 | 6.5 to 9 |
Source: internal document from the water basin office.
Table 3.
Correlation between the aquatic ecosystem and the flows.
| Control Variable | Pain Fall Period 1 | Pain Fall Period 2 | Pain Fall Period 1 | Pain Fall Period 2 | Pain Fall Period 1 | ||
|---|---|---|---|---|---|---|---|
| Fish catch period 1 and Fish catch period 2 | Pain fall period 1 | Correlation | 1 | - | - | - | - |
| Significance | - | - | - | - | 0 | ||
| DF | 0 | 0 | 0 | 0 | - | ||
| Pain fall period 2 | Correlation | - | 1 | - | - | - | |
| Significance | - | - | - | - | 0 | ||
| DF | 0 | 0 | 0 | 0 | - | ||
| Pain fall period 1 | Correlation | - | - | 1 | - | - | |
| Significance | - | - | - | - | 0 | ||
| DF | 0 | 0 | 0 | 0 | - | ||
| Pain fall period 2 | Correlation | - | - | - | 1 | - | |
| Significance | - | - | - | - | 0 | ||
| DF | 0 | 0 | 0 | 0 | - | ||
| Pain fall period 1 | Correlation | - | - | - | - | 1 | |
| Significance | - | - | - | - | - | ||
| DF | 0 | 0 | 0 | 0 | 0 | ||
© 2019 by the authors. Licensee MDPI, Basel, Switzerland. This article is an open access article distributed under the terms and conditions of the Creative Commons Attribution (CC BY) license (http://creativecommons.org/licenses/by/4.0/).
Share and Cite
MDPI and ACS Style
Ngonyani, H.; Mourad, K.A. Role of Water User Associations on the Restoration of the Ecosystem in Tanzania. Water 2019, 11, 141. https://doi.org/10.3390/w11010141
AMA Style
Ngonyani H, Mourad KA. Role of Water User Associations on the Restoration of the Ecosystem in Tanzania. Water. 2019; 11(1):141. https://doi.org/10.3390/w11010141
Chicago/Turabian StyleNgonyani, Happyness, and Khaldoon A. Mourad. 2019. "Role of Water User Associations on the Restoration of the Ecosystem in Tanzania" Water 11, no. 1: 141. https://doi.org/10.3390/w11010141
Note that from the first issue of 2016, this journal uses article numbers instead of page numbers. See further details here.