Temporal Variation and Reduction Strategy of Nutrient Loads from an Urban River Catchment into a Eutrophic Lake, China
by
 ,
,
Chengxin Qin
1 ,
,
Zhiyi Li
2,
Pengcheng Xie
3,
Qianting Hao
4,
Xuejun Tang
5,
Yihui Wu
6 and
Pengfei Du
1,* 1
State Key Laboratory of Environmental Simulation and Pollution Control, School of Environment, Tsinghua University, Beijing 100084, China
2
Beijing Tsinghuan Smart Water Tech Co., Ltd., Beijing 100086, China
3
Urban Planning and Design Institute of Shenzhen, Shenzhen 518028, China
4
Information Center, Ministry of Ecology and Environmental Protection, Beijing 100029, China
5
Kunming Meteorological Bureau, Kunming 650501, China
6
Kunming Dianchi Water Treatment Co., Ltd., Kunming 650228, China
*
Author to whom correspondence should be addressed.
Water 2019, 11(1), 166; https://doi.org/10.3390/w11010166
Submission received: 2 December 2018
/
Revised: 22 December 2018
/
Accepted: 9 January 2019
/
Published: 17 January 2019
(This article belongs to the Section Urban Water Management)
Abstract
:Excessive nutrient input from urban areas increases the occurrence of eutrophication. Control of nutrient loads is perceived as the primary restoration method. Quantifying temporal variation of nutrient loads is essential to understand the dynamic relationships of nutrient source-impacts in the urban water system and investigate the operational efficiency of treatment facilities for eutrophication control. Here, a holistic approach was developed to estimate nutrient loads from different sources and evaluate nutrient impacts on the urban water environment. An integrated catchment model of nutrient loads was built and applied to calculate river nutrient loads from untreated rainfall runoff, untreated sewage, and treated recharge into the eutrophic Dianchi Lake from an urban river catchment with limited infrastructure. Nutrient impacts on the lake were evaluated and a load reduction strategy was given a hint to reduce nutrient impacts of urban rivers. During the study period 2014–2016, nutrient loads from the urban river generally decreased except during heavy winter rainfall events and high-intensity pollution events associated with rainfall runoff. The average contribution of annual nutrient loads to the lake capacity indicated the underestimation of nutrient impacts of urban rivers. This approach provides new insights into urban water management and underscores the importance of sewage infrastructure.
1. Introduction
Rapid urbanization challenges city drainage infrastructure and modifies river flow regime [1,2]. Excessive nutrient input from urban areas leads to water quality degradation. Controlling nutrient loads in urban areas is a key component of urban water management. The nutrient discharge of urban rivers depends on the dynamic characteristics of wastewater generation and variable rainfall input into the catchment. These dynamic factors render it difficult to quantify the exact number of loads that are released from point and nonpoint sources, especially during unequally distributed rainfall events [3,4]. Improving the identification of temporal variation in nutrients generated by various sources that affect the total loads into receiving water will support to understand the dynamic relationships of nutrient source-impacts in the urban water system, as well as investigate the performance of facilities for nutrient removal.
Previous studies have developed methods to estimate nutrient loads from point sources and nonpoint sources into urban rivers. The effluent from wastewater treatment plants (WWTPs) is an identifiable point source of pollution into river systems. Its loads were determined with online water quality monitoring and real-time control systems [5]. However, the occurrence and magnitude of nonpoint sources of pollution are difficult to evaluate due to variability in rainfall. For example, urban sewer networks will experience hydraulic overload during rainy days. Combined sewer overflow (CSO) then occurs in the combined sewer network and untreated sewage discharges directly from overflow structures without any treatment. Nonpoint source pollution models were built to simulate spatial and temporal distributions of nonpoint source pollution loads [6,7]. Nevertheless, quantifying the impact of highly transient CSOs has remained a challenge for large urban drainage systems [8]. Even et al. modeled the impact of CSOs on the water quality of the Seine River and demonstrated the complexity of response in the receiving system [9]. In addition, some microbial, chemical markers and isotopes have been increasingly used to distinguish nutrient sources in urban rivers and estimate the mixing ratio of wastewaters [10,11,12]. However, the relative contribution of water volumes is not equivalent to that for nutrient loads. Consequently, a complete understanding of the temporal relationship of nutrient source-impacts requires a holistic approach that combines reliable simulation of urban drainage systems and a feasible long-term monitoring framework.
Understanding nutrient source-impacts in urban water systems provides hints of enhancing urban water management for eutrophication control [13,14]. Dianchi Lake comprises an area of more than 300 km2 and lies south of Kunming City, which is the largest city in the Yunnan Province of China. The lake is one of the three most eutrophic lakes in China that is fed by 35 rivers [15]. Some of the rivers are actually artificial waterways that function as sewage pathways forced by limited infrastructure. Urban rivers contribute large amounts of nutrient loads into the lake as they convey treated effluent, rainfall runoff, and untreated sewage. Attempts to quantify nutrient loads into the Dianchi Lake watershed have been conducted over the last 20 years. Temporal characteristics of the point sources of pollution have also been described by a probability distribution of WWTP effluent concentrations [16,17]. Further, a number of studies have investigated rainfall nonpoint source pollution processes in urban and rural areas [18,19]. Based on these in situ monitoring data, the spatio-temporal distribution of nutrient loads into Dianchi Lake have been evaluated with export coefficient models [20,21,22] and nonpoint source pollution models [23,24,25]. From these studies, point source loads were considered to be in decline due to increased WWTP capacity and decreased effluent concentrations in the watershed, while urban nonpoint sources of pollution were concomitantly becoming important because of the expansion of built-up areas over the preceding 30 years [26]. However, these nutrient load estimations were based on annual statistical data and thus could not identify temporal variation in urban river loads necessary to estimate differences in dry and wet weather annually. In addition, untreated sewage loads from urban rivers were theoretically assumed the difference of the load generated and the load removed by WWTPs and were failed to identify the real contribution into the lake by downstream river monitoring data either. Furthermore, control of nutrient loadings is regarded as the primary restoration method [27]. The lack of temporal quantification of nutrient loads from urban rivers hinders the ability of researchers and officials to understand the dynamic relationships of nutrient source-impacts in the drainage system of Kunming City and correspondingly reduce nutrient impacts of urban rivers.
This study aimed to develop a holistic approach to evaluate nutrient source-impacts in an urban river catchment. An integrated catchment model of river nutrient loads was built based on the semi-distributed storm water management model (SWMM) [28] using long-term monitoring data. The model was then applied to calculate the discharge of nutrient sources, including rarely quantified untreated sewage, in addition to identifying temporal variation of nutrient loads. This approach was then validated with a case study of an urban river into the eutrophic Dianchi Lake. A load reduction strategy was suggested based on the performances of combined sewer detention tanks (CSDTs) and WWTPs and the analyses of load reduction scenarios in order to provide new insights into urban water management.
2. Materials and Methods
2.1. Methodology
Nutrient source-impacts in an urban catchment were evaluated using the following holistic approach in Figure 1. Primary sources were identified by field inspections and the drainage network analysis. Temporal variation of nutrient loads from point sources and nonpoint sources were then estimated under dry and wet weather conditions using long-term monitoring data and reliable simulation results. Consequently, dynamic nutrient impacts on the urban water environment were evaluated based on the performances of CSDTs and WWTPs and the analyses of load reduction scenarios. Reduction efficiencies under assumed load reduction scenarios were compared to guide suggestions for urban water management to limit eutrophication.
There was significant variability in the measurement of irregularly discharged untreated sewage. This was particularly evident in the underground section of the river passing through the urban center of the city. Furthermore, untreated sewage discharged directly into the river without any treatment in the catchment with incomplete sewerage infrastructure, especially during wet weather days. The contribution of untreated sewage and rainfall runoff were separately analyzed by dry and wet weather characterizations, and the assumption of untreated sewage loads with a holistic perspective. Wet weather days were considered as those days of rainfall runoff occurrence when daily rainfall exceeded a given threshold, which was assigned by the simulation results of nonpoint source pollution models. In addition, the volume of untreated sewage was assumed to be the amount of wastewater that exceeded the transport capacity of the sewer system during dry weather and remained static for a period of time that was independent of rainfall quantity. A longer antecedent dry weather period (ADWP) provided a more convincing estimate of the static assumption, but the effective data was sparse and insufficient for monthly calculations. The static period was set as one month. Thus, the concentration of untreated sewage was equal to that of the WWTP influent during dry weather days over one month.
During wet weather conditions, rainfall runoff was simulated by an SWMM-based nonpoint source pollution model. Fine-discretized sub-catchments were classified into four groups based on land surface characteristics: Rooftops, paved roads, walkways, and lawns. Each component was calibrated by separating hydrology and water quality portions of the model with monitoring data. The nutrient load from rainfall runoff could be calculated if validation results exhibited good agreement between observed and simulated values.
2.2. Site Description
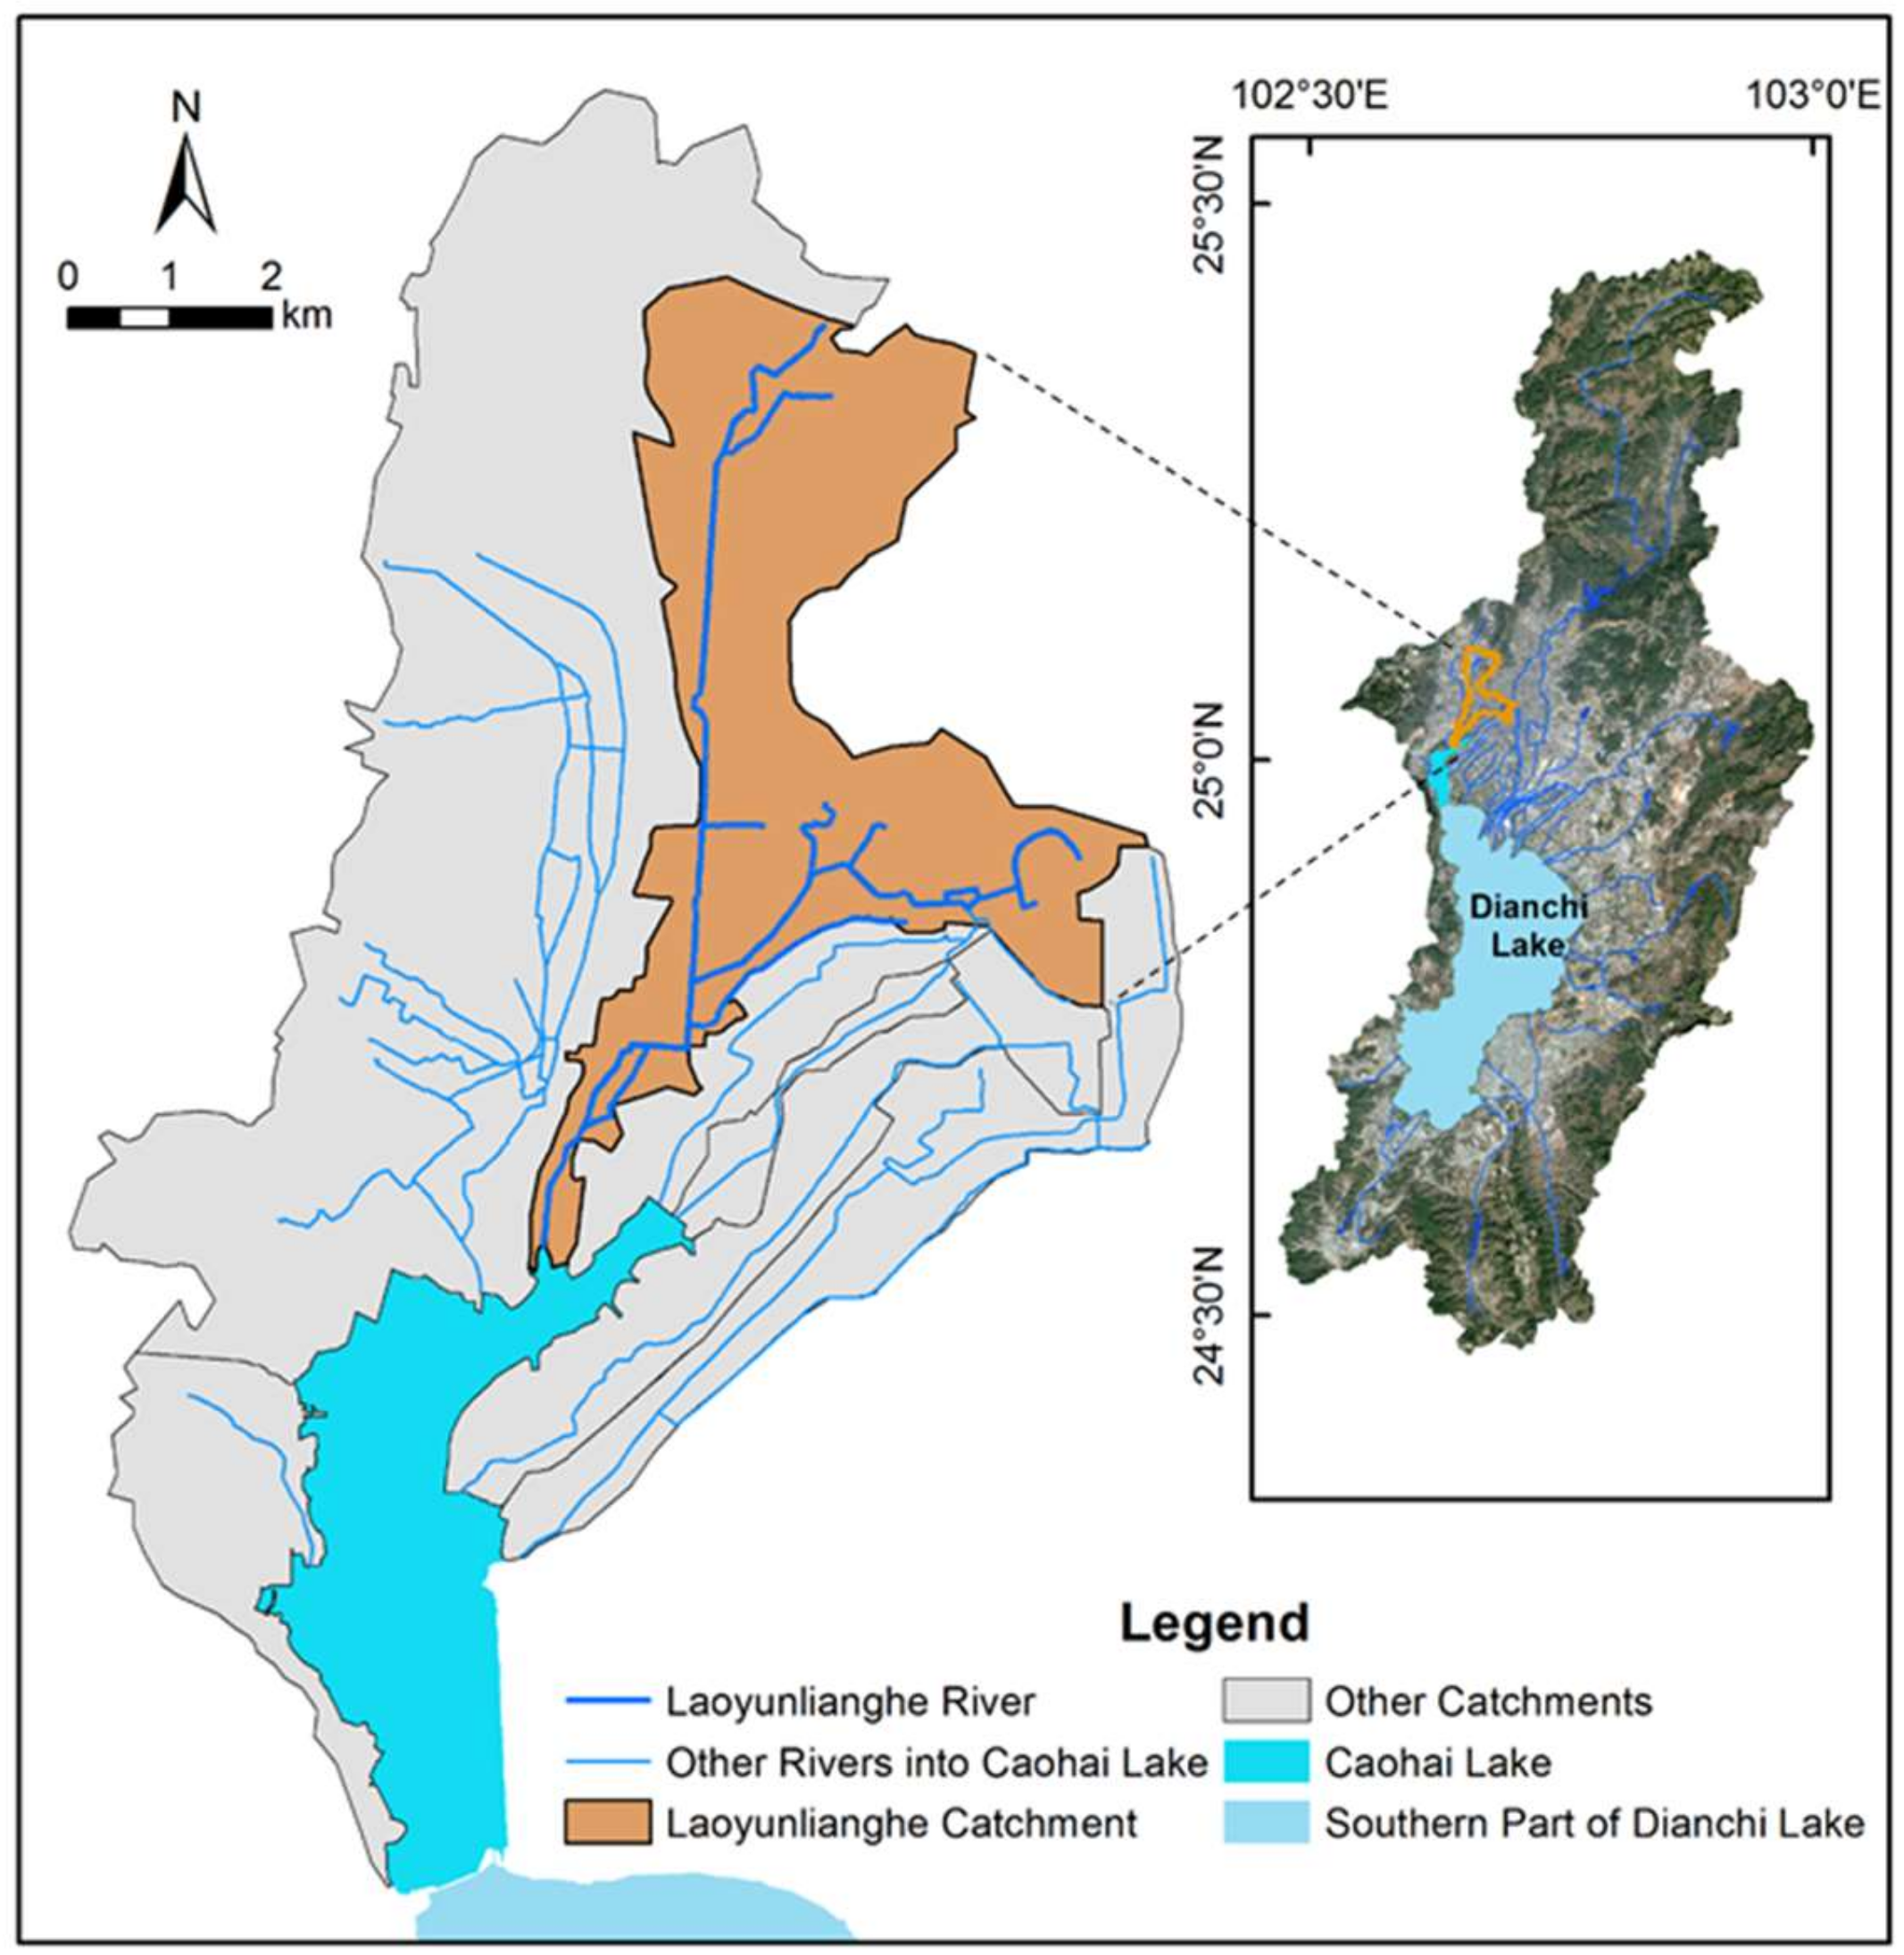
Laoyunlianghe River is a man-made 11.3 km waterway in urban Kunming, which is the capital of the Yunnan Province in southwest China (Figure 2). The river catchment is intensely urbanized with more than 250,000 residents living in a total area of 19.8 km2. The major land use types are residential (31%) and public service (18%) (right side of Figure 3). The Laoyunlianghe River lacks a clean headwater source, due to a reservoir that has dried up, and receives untreated sewage and WWTP recharge along its path. The river becomes a severely polluted river along its path that discharges into Caohai Lake with the average water level of 1886.5 m above sea level (asl) in the northern section of Dianchi Lake with the average water level of 1887.0 m asl. Caohai Lake comprises a total area of about 10.7 km2 and suffers from eutrophication as a result of excessive nutrient input from Kunming City [29]. Seven urban rivers contribute the majority of nutrient loads into Caohai Lake, which is more eutrophic than the southern section of Dianchi Lake [30]. To facilitate the recovery of Dianchi Lake from eutrophication, the project of Niulanjiang River-Dianchi Lake Water Replenishment diverts an annual average volume of 6.0 × 10⁸ m3 fresh water to Dianchi Lake since 2014, which half of the water is diverted to Caohai Lake through Daguanhe River [31,32].
The complex drainage network of the catchment dominates the nutrient source-impacts of the Laoyulianghe River. The middle stream of the river passes through the urban center where it becomes an underground waterway, contributing to the difficulty in identifying pollution sources. The drainage network of the Lower Laoyunlianghe River is illustrated on the left side of Figure 3 to differentiate hydrological processes of varied nutrient sources. Domestic wastewater and intercepted rainfall runoff are collected and conveyed to the WWTP by pipelines, CSDTs, and pumping stations. The treated WWTP effluent is discharged to replenish the Lower Laoyunlianghe River at two different points (before and after the WWTP) in addition to the Wulong River. Due to incomplete sewerage infrastructure and the limited capacity of the WWTP (210,000 m3/day), untreated sewage and untreated rainfall runoff likely discharge directly into the lake, thereby posing a serious pollution risk to Caohai Lake.
Four CSDTs have been in full operation since 2016 to mitigate peak flows in pipelines and the river during rainy days. Gate valves of CSDTs are installed at the inlets to regulate flow rates into tanks. The filling of the tank occurs during rainy days but, when the tank is full, the filling is stopped and incoming flows from pipelines are discharged to pumping stations. The emptying of the tank begins when flow rates in the pumping station and WWTP remain below maximum potential output rates. A new filling of the tank is possible only when the CSDT has completed emptying. These CSDTs have a total capacity of 45,000 m3 and jointly serve a drainage area of 7.33 km2 within the catchment that is mostly inside the second ring road of Kunming City with combined sewer systems. Moreover, three downstream dams help reduce the frequency of overflow occurrences and render the east branch of the Lower Laoyunlianghe River as a reservoir for wastewater treatment and to buffer rainfall runoff.
2.3. Integrated Monitoring Framework and Data Acquisition
The present study refers to the period of 2014–2016. An integrated monitoring framework was established for water quality, hydrology, and rainfall in the Laoyunlianghe River catchment in order to document and evaluate the temporal variation of nutrient loads generated by treated effluent, rainfall runoff, and untreated sewage in the three years. River nutrients were sampled weekly at the river monitoring station (Figure 3) that is located prior to the confluence with Caohai Lake. A total of 148 samples were collected between 2014 and 2016, with the exception of times during construction at the monitoring site. Three rainfall runoff events with a total of 52 samples were monitored at locations of rooftops, paved roads, and lawns in the catchment, as described by Li et al. [24]. All samples were stored in polyethylene terephthalate (PET) bottles and analyzed at a certified laboratory. Chemical oxygen demand (COD), ammonia nitrogen (NH3-N), and total phosphorus (TP) of water samples were determined with official analytical methods (GB 11914-89 for COD, HJ 535-2009 for NH3-N, and GB 11893–89 for TP). The influent and effluent of the WWTP were monitored hourly by a real-time control system for flow rates and nutrient concentrations. Real-time sensors were calibrated monthly. Operation cycles of tank filling and emptying were recorded, thereby allowing the calculation of actual storage volumes for CSDTs.
Hourly rainfall was measured by seven rain gauges within the catchment (Figure 3), which helped reduce spatial uncertainty for rainfall measurements. Rainfall amounts varied significantly across stations and was due to the plateau mountain topography of Kunming City. The area-weighted rainfall over the catchment was calculated with the Thiessen polygon approach [33].
Nutrient impacts on the urban water environment were evaluated using the target capacity of Caohai Lake during the period of 2016-2020 that was specified by the thirteenth five-year plan [34].
2.4. Integrated Catchment Model of Nutrient Loads
The nutrient load of the Laoyunlianghe River into the lake ( [t/d]) was calculated as production of instantaneous concentration and instantaneous flow at the river monitoring station indicated in Figure 3.
where c is the concentration and q is flow, both considered as a function of time (t), and k is a unit conversion factor.
Three nutrient sources contributed to the nutrient load of the Laoyunlianghe River into the lake: (1) Treated recharge (); (2) untreated rainfall runoff (); and (3) untreated sewage (). Nutrient loads into the lake could be described with the following mass balance equation:
where , , , and are nutrient loads of river into the lake, treated recharge, untreated rainfall runoff, and untreated sewage, respectively.
Because the concrete-lined rectangular channel lacked riparian vegetation, no nutrient reduction was assumed to occur along the river channel. Treated loss, as part of the treated effluent, was replenished to the Wulong River catchment that was beyond the scope of the Laoyunlianghe River catchment and was excluded from the nutrient load calculation. The volume of untreated sewage was estimated using the following method.
During dry weather conditions, river flow without the impact of rainfall runoff can be assumed to be in a steady state, and thereby and . Based on the assumptions of the concentration of untreated sewage from the methodology section, the volume of untreated sewage was thus given by:
where , , and are nutrient concentrations of the river monitoring station (Figure 3), WWTP effluent, and WWTP influent, respectively. is the water volume of WWTP treated effluent to replenish the Lower Laoyunlianghe River.
Based on Equation (3), the monthly median load of untreated sewage, , was calculated and river loads into the lake during dry weather were given as .
During wet weather conditions, rainfall runoff was calculated at a catchment scale based on the nonpoint source pollution model SWMM that was calibrated by data from three monitored events with an average Nash-Sutcliffe efficiency on flow equal to 0.90 and mean relative errors for COD, NH3N, and TP each less than 35%, as described by Li et al. [24]. Due to the infiltration capacity of the prevailing sandy soils in the catchment, simulation results showed that there was no contribution from runoff when simulated daily rainfall was less than 5.0 mm. In other words, days with daily rainfall greater than 5.0 mm measured by at least one rain gauge in the catchment were defined as wet weather days. Thus, river loads into the lake during wet weather were given as .
2.5. Load Reduction Scenarios
One basic scenario and three nutrient load reduction scenarios were defined based on the identification of sources of the Laoyunlianghe River (Table 1).
The increased intercepted rainfall under scenario RT and the reduced untreated sewage under scenario US should be treated by the WWTP and therefore contribute to increases in the volume of treated water. The impact of load reduction was simulated by changing the volume (scenarios RT and US) or the concentration (scenario TE) by five percent increments or decrements and the load reduction efficiencies under these simulations were compared to guide suggestions for improvements in local water quality.
3. Results and Discussion
3.1. Temporal Distribution of Dry and Wet Weather
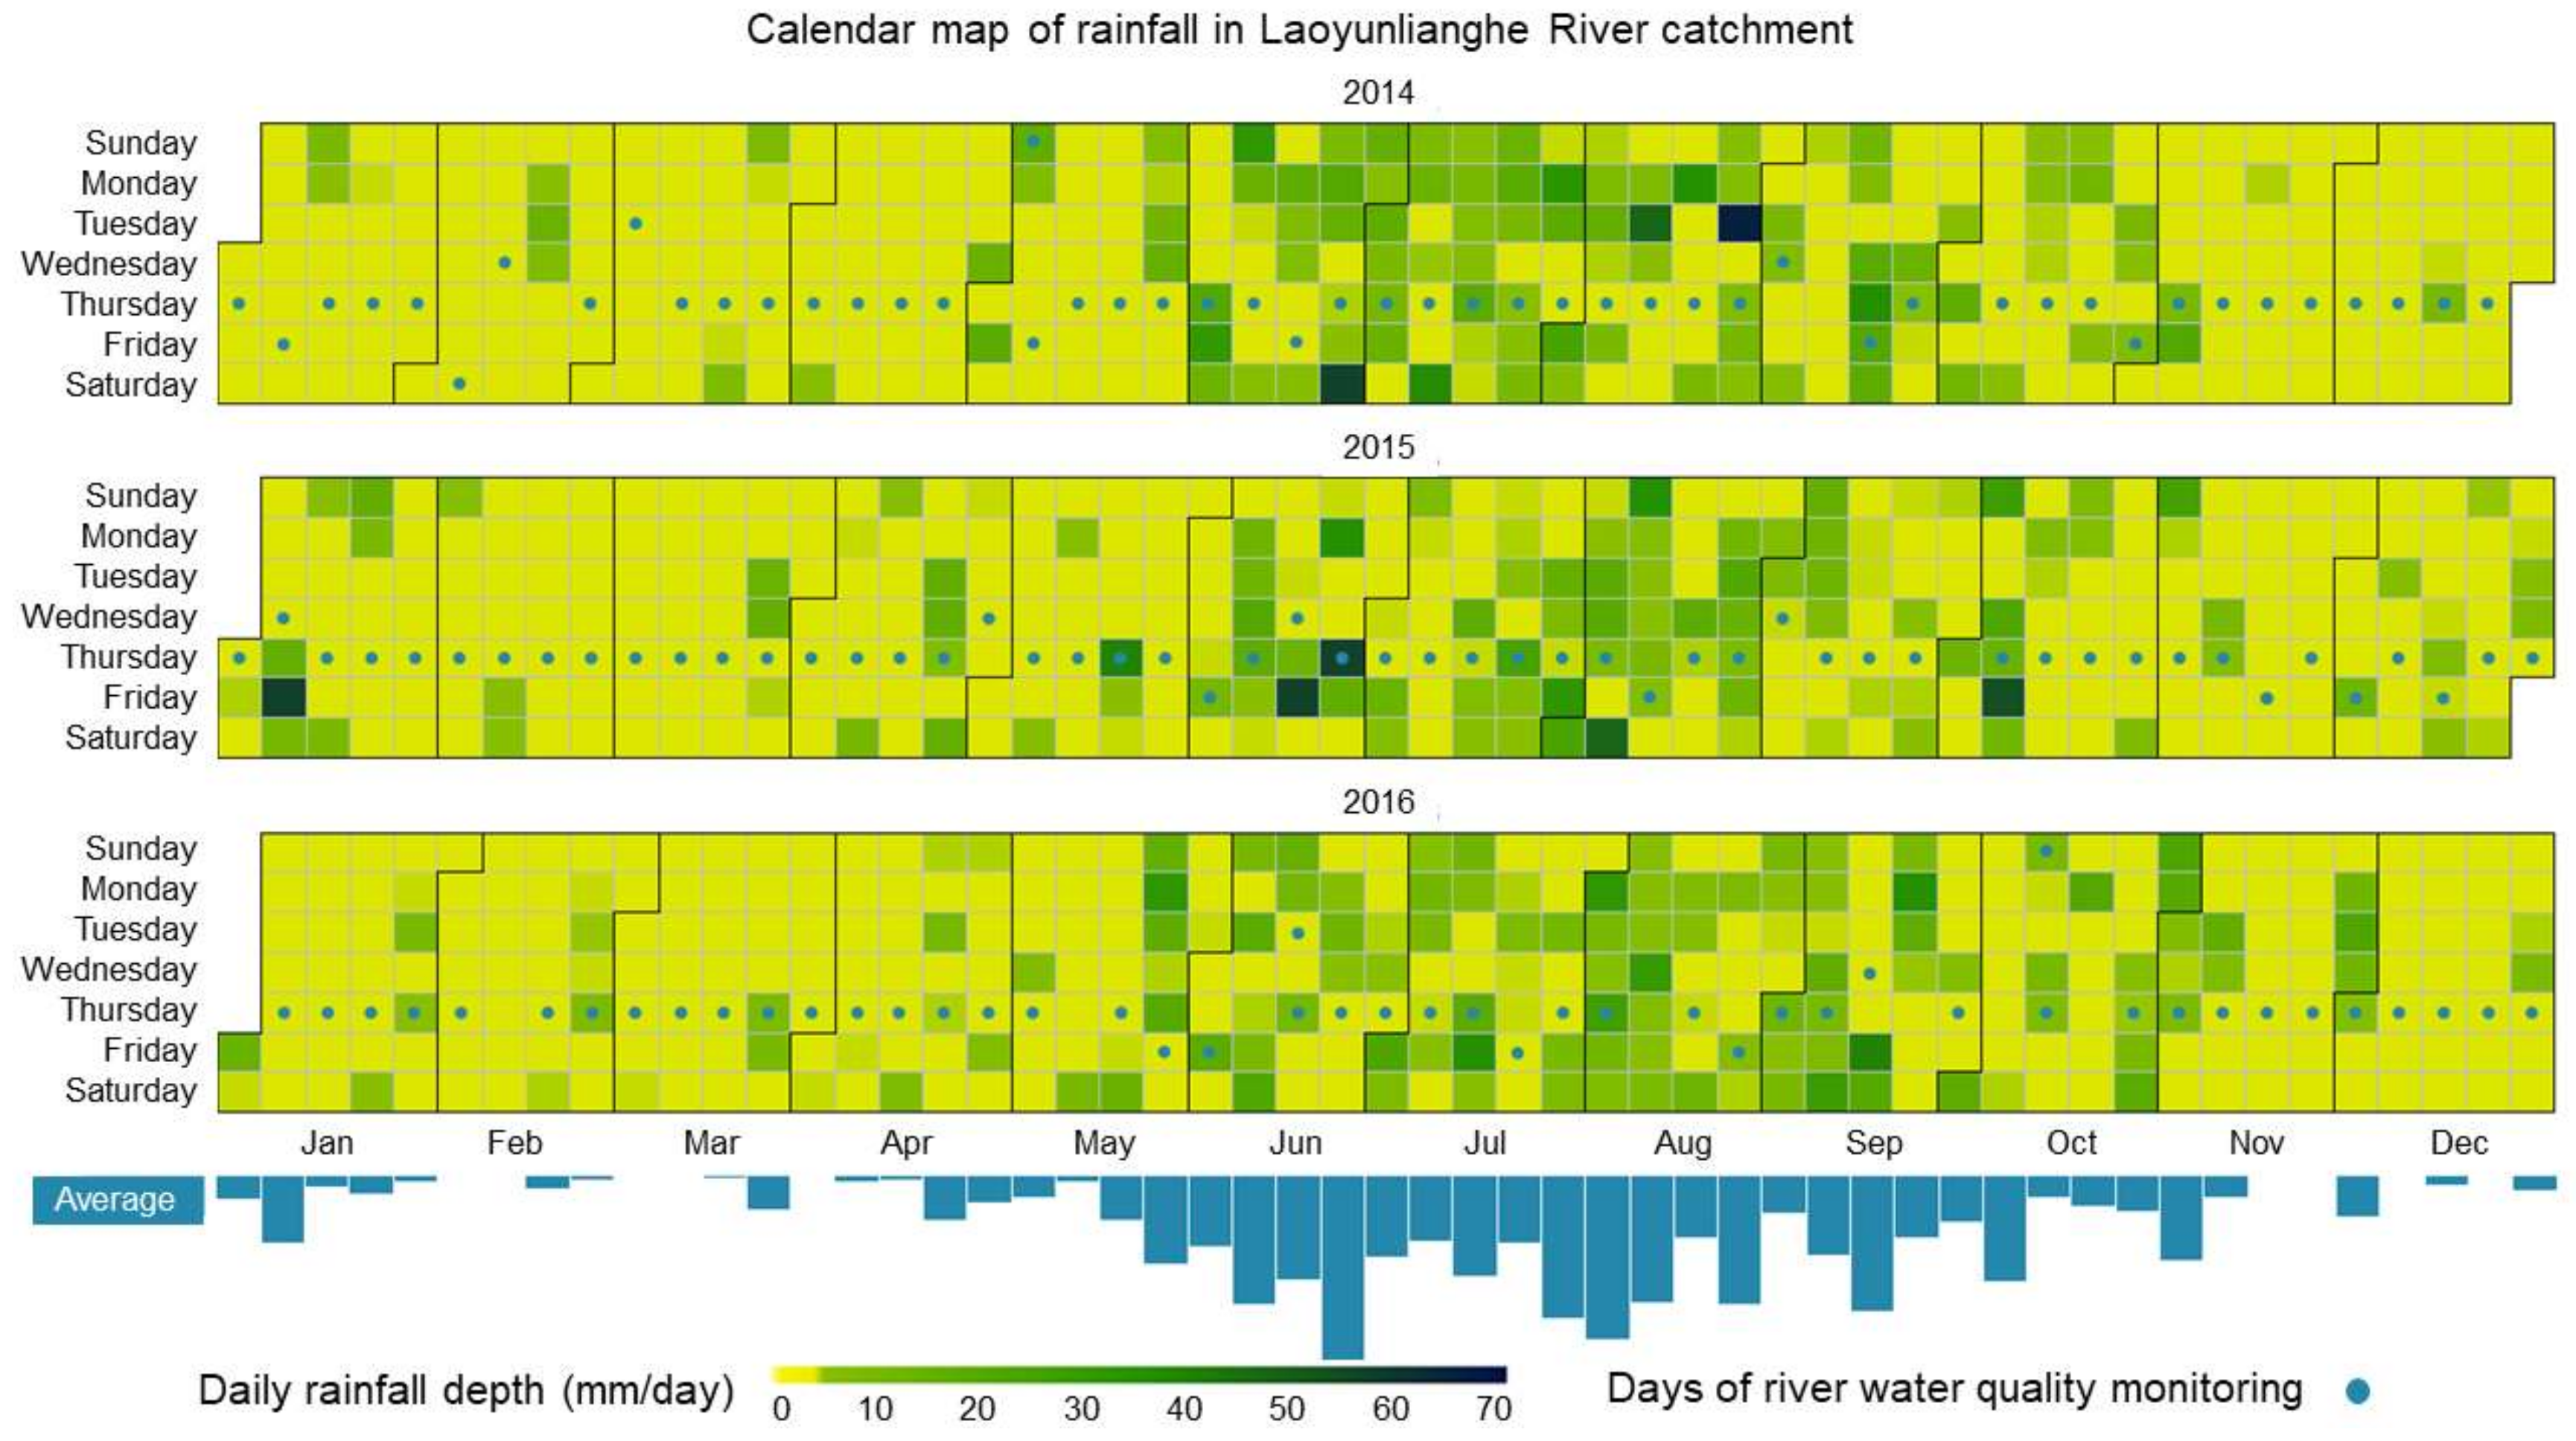
The average rainfall was calculated from seven rain gauge datasets in the Laoyunlianghe River catchment and visualized as a heat map of average daily rainfall depth during the period 2014–2016 (Figure 4). The annual rainfall depth in each year was greater than the annual average of 932.0 mm for the catchment [29], where at least 75% of the rainfall occurred in the rainy season (May to October). The catchment also experienced unusually heavy winter rainfall events comprising a total of 111.1 mm in January 2015. The total number of wet weather days during the three-year period were 71, 66, and 76, respectively. There was a nonlinear relationship between the number of wet days and the rainfall depth in a year. The number of wet days in 2015 was the lowest of the three years, although the annual rainfall was the highest in 2015 (1118.3 mm) owing to the highest number of heavy rain events (daily rainfall > 50 mm).
3.2. Temporal Characteristics of Untreated Sewage
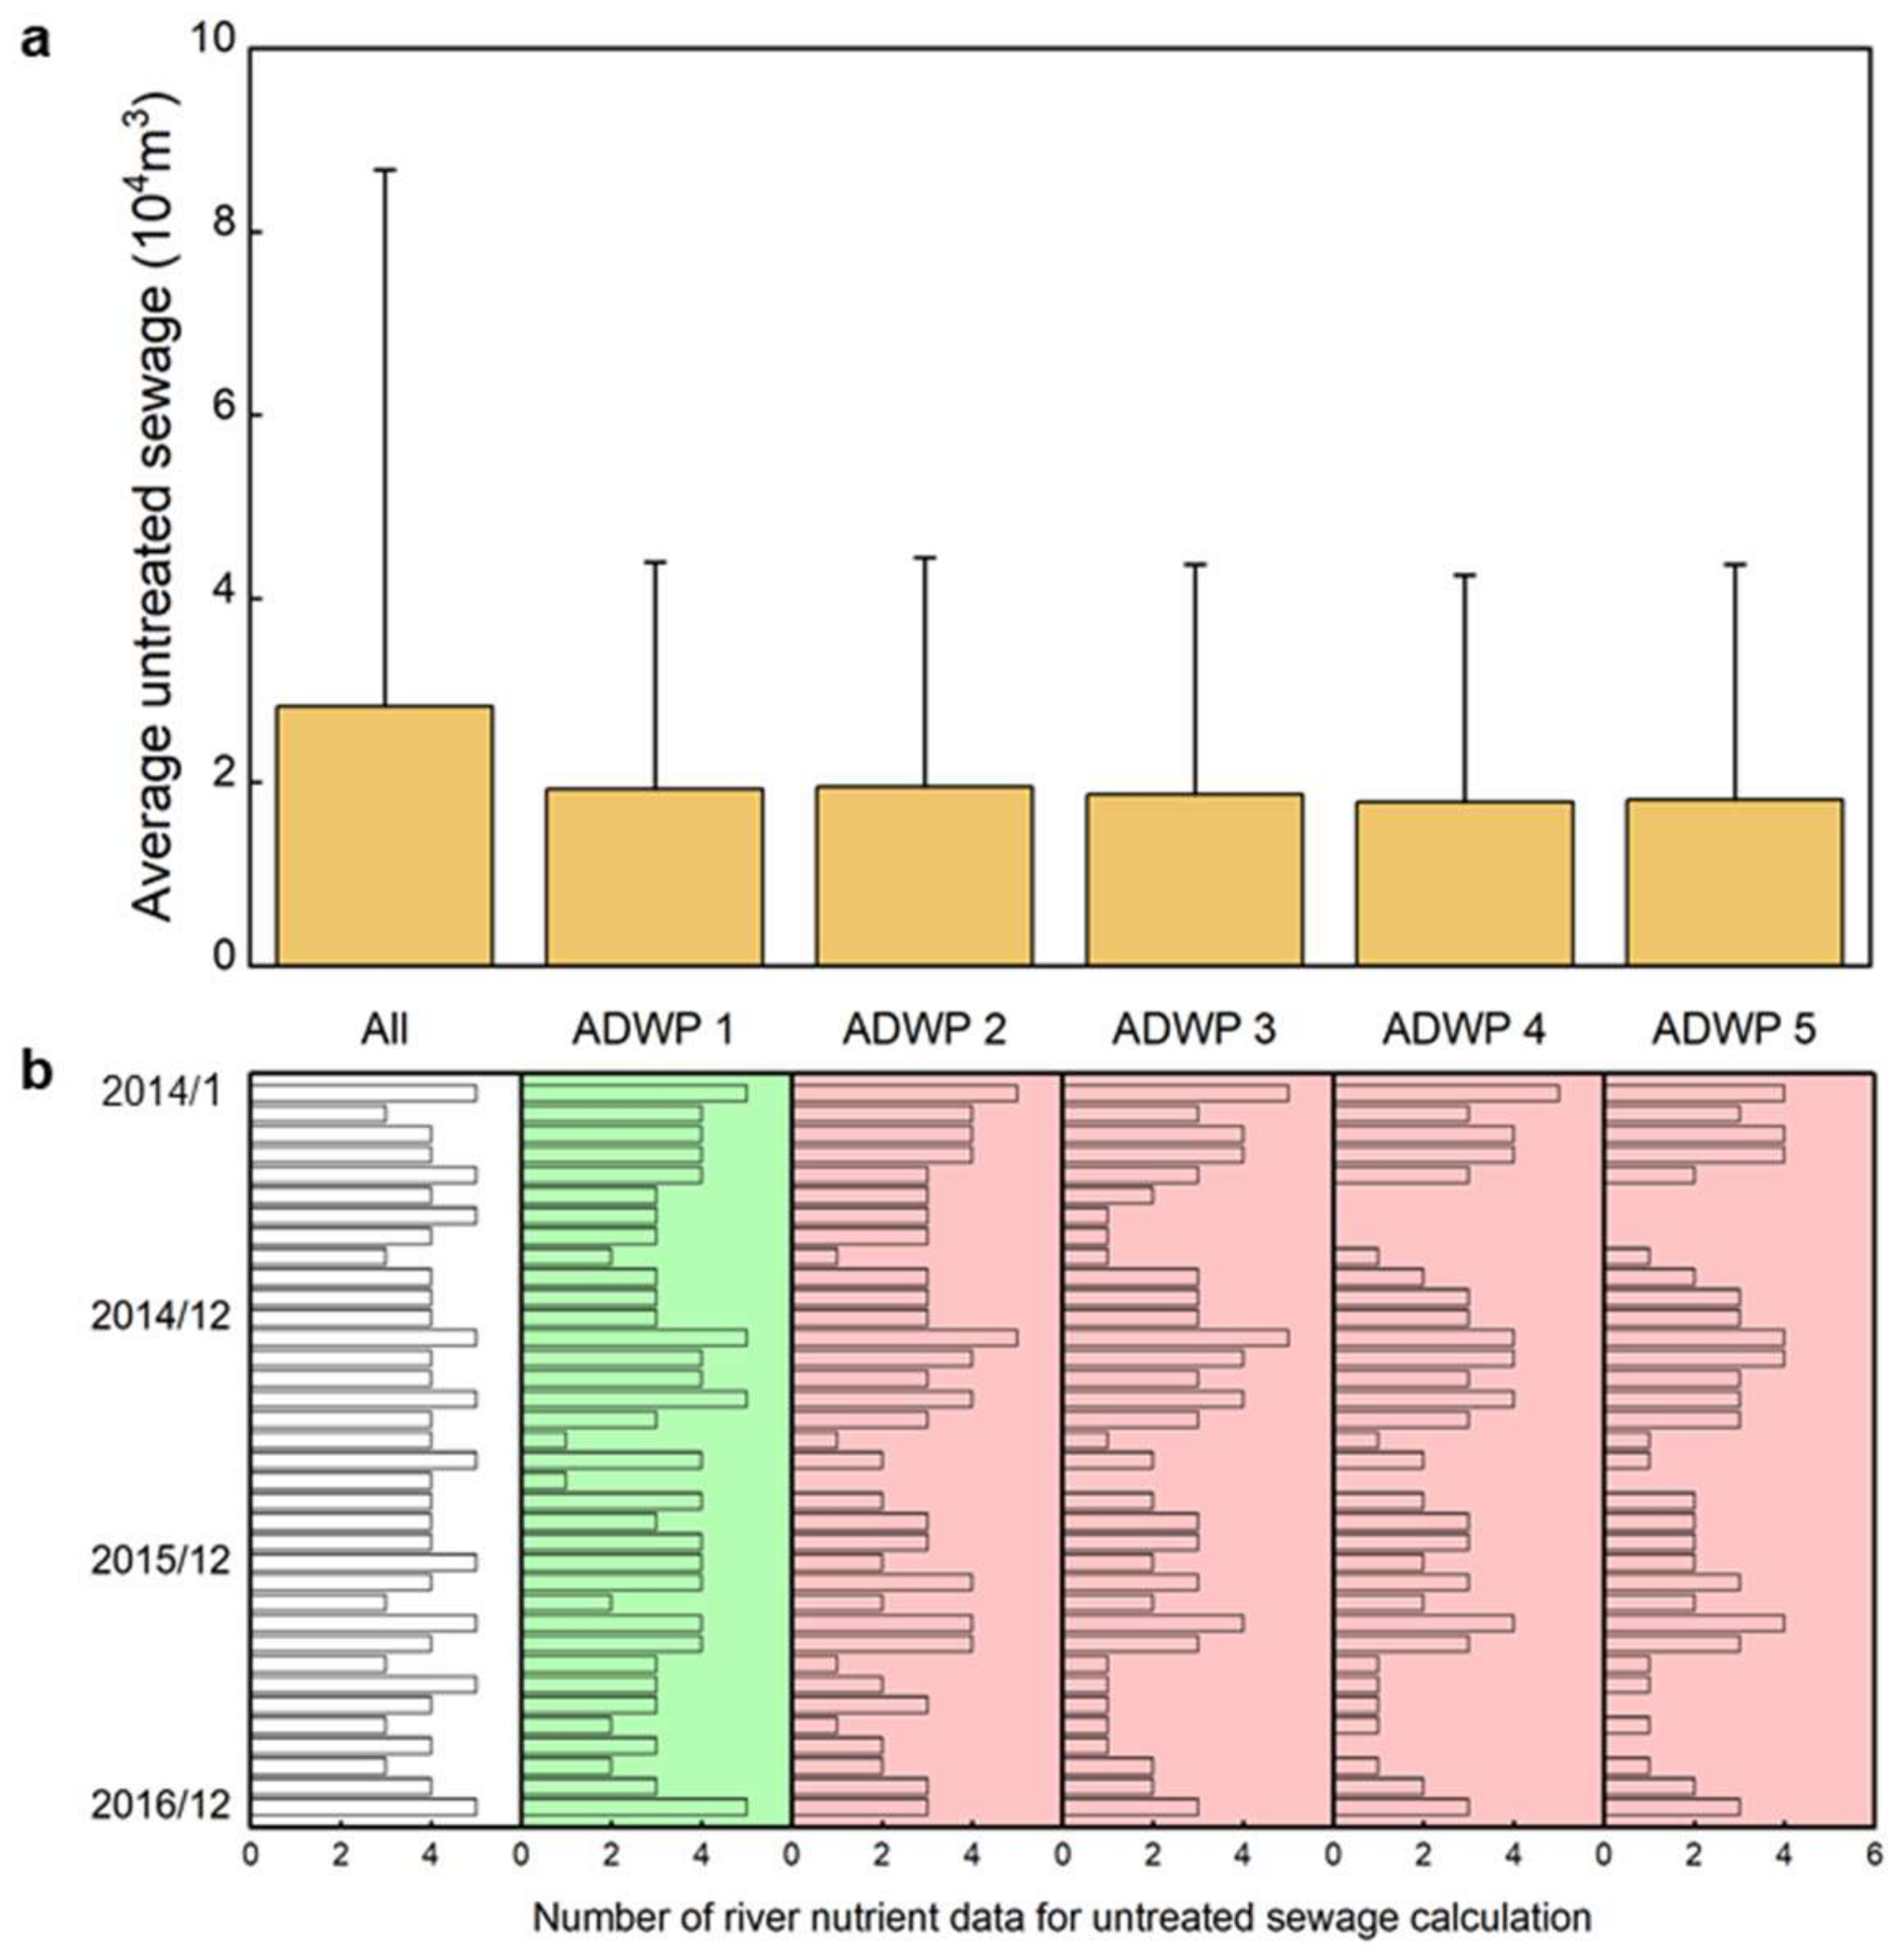
All river nutrient data were classified according to their ADWP and the three-year-average was calculated for untreated sewage volumes under six scenarios based on Equation (3) (Figure 5). The number after “scenario ADWP” is the duration of the antecedent dry weather period measured in days. The scenario “All” includes the use of data during wet weather. The scenario “ADWP 1” refers to the data with an ADWP of no less than one day. A significant difference in the volume was observed between scenario “All” and the other five ADWP scenarios, where the average volume of the former was 50% greater than that of the others. Further, the greater variability of scenario “All” indicated the occurrence of sewage overflows that were caused by intense rainfall events during wet weather. No obvious differences were observed for the average volumes and standard deviations for the five ADWP scenarios. These results implied that the average duration of individual rainfall runoff events was less than 24 h, which is consistent with other investigations of small urban catchments [35,36]. Monthly data was only available for scenario ADWP 1, because data gaps were present in the rainy season for ADWP scenarios 2 to 5. Therefore, untreated sewage was calculated based on scenario ADWP 1 because of data accuracy and availability.
3.3. Performance of the WWTP and CSDTs During Wet Weather
Facility efficiency was likely to be affected by rainfall runoff during wet weather. The WWTP and CSDTs in the catchment were typical facilities and their performances were assessed as follows.
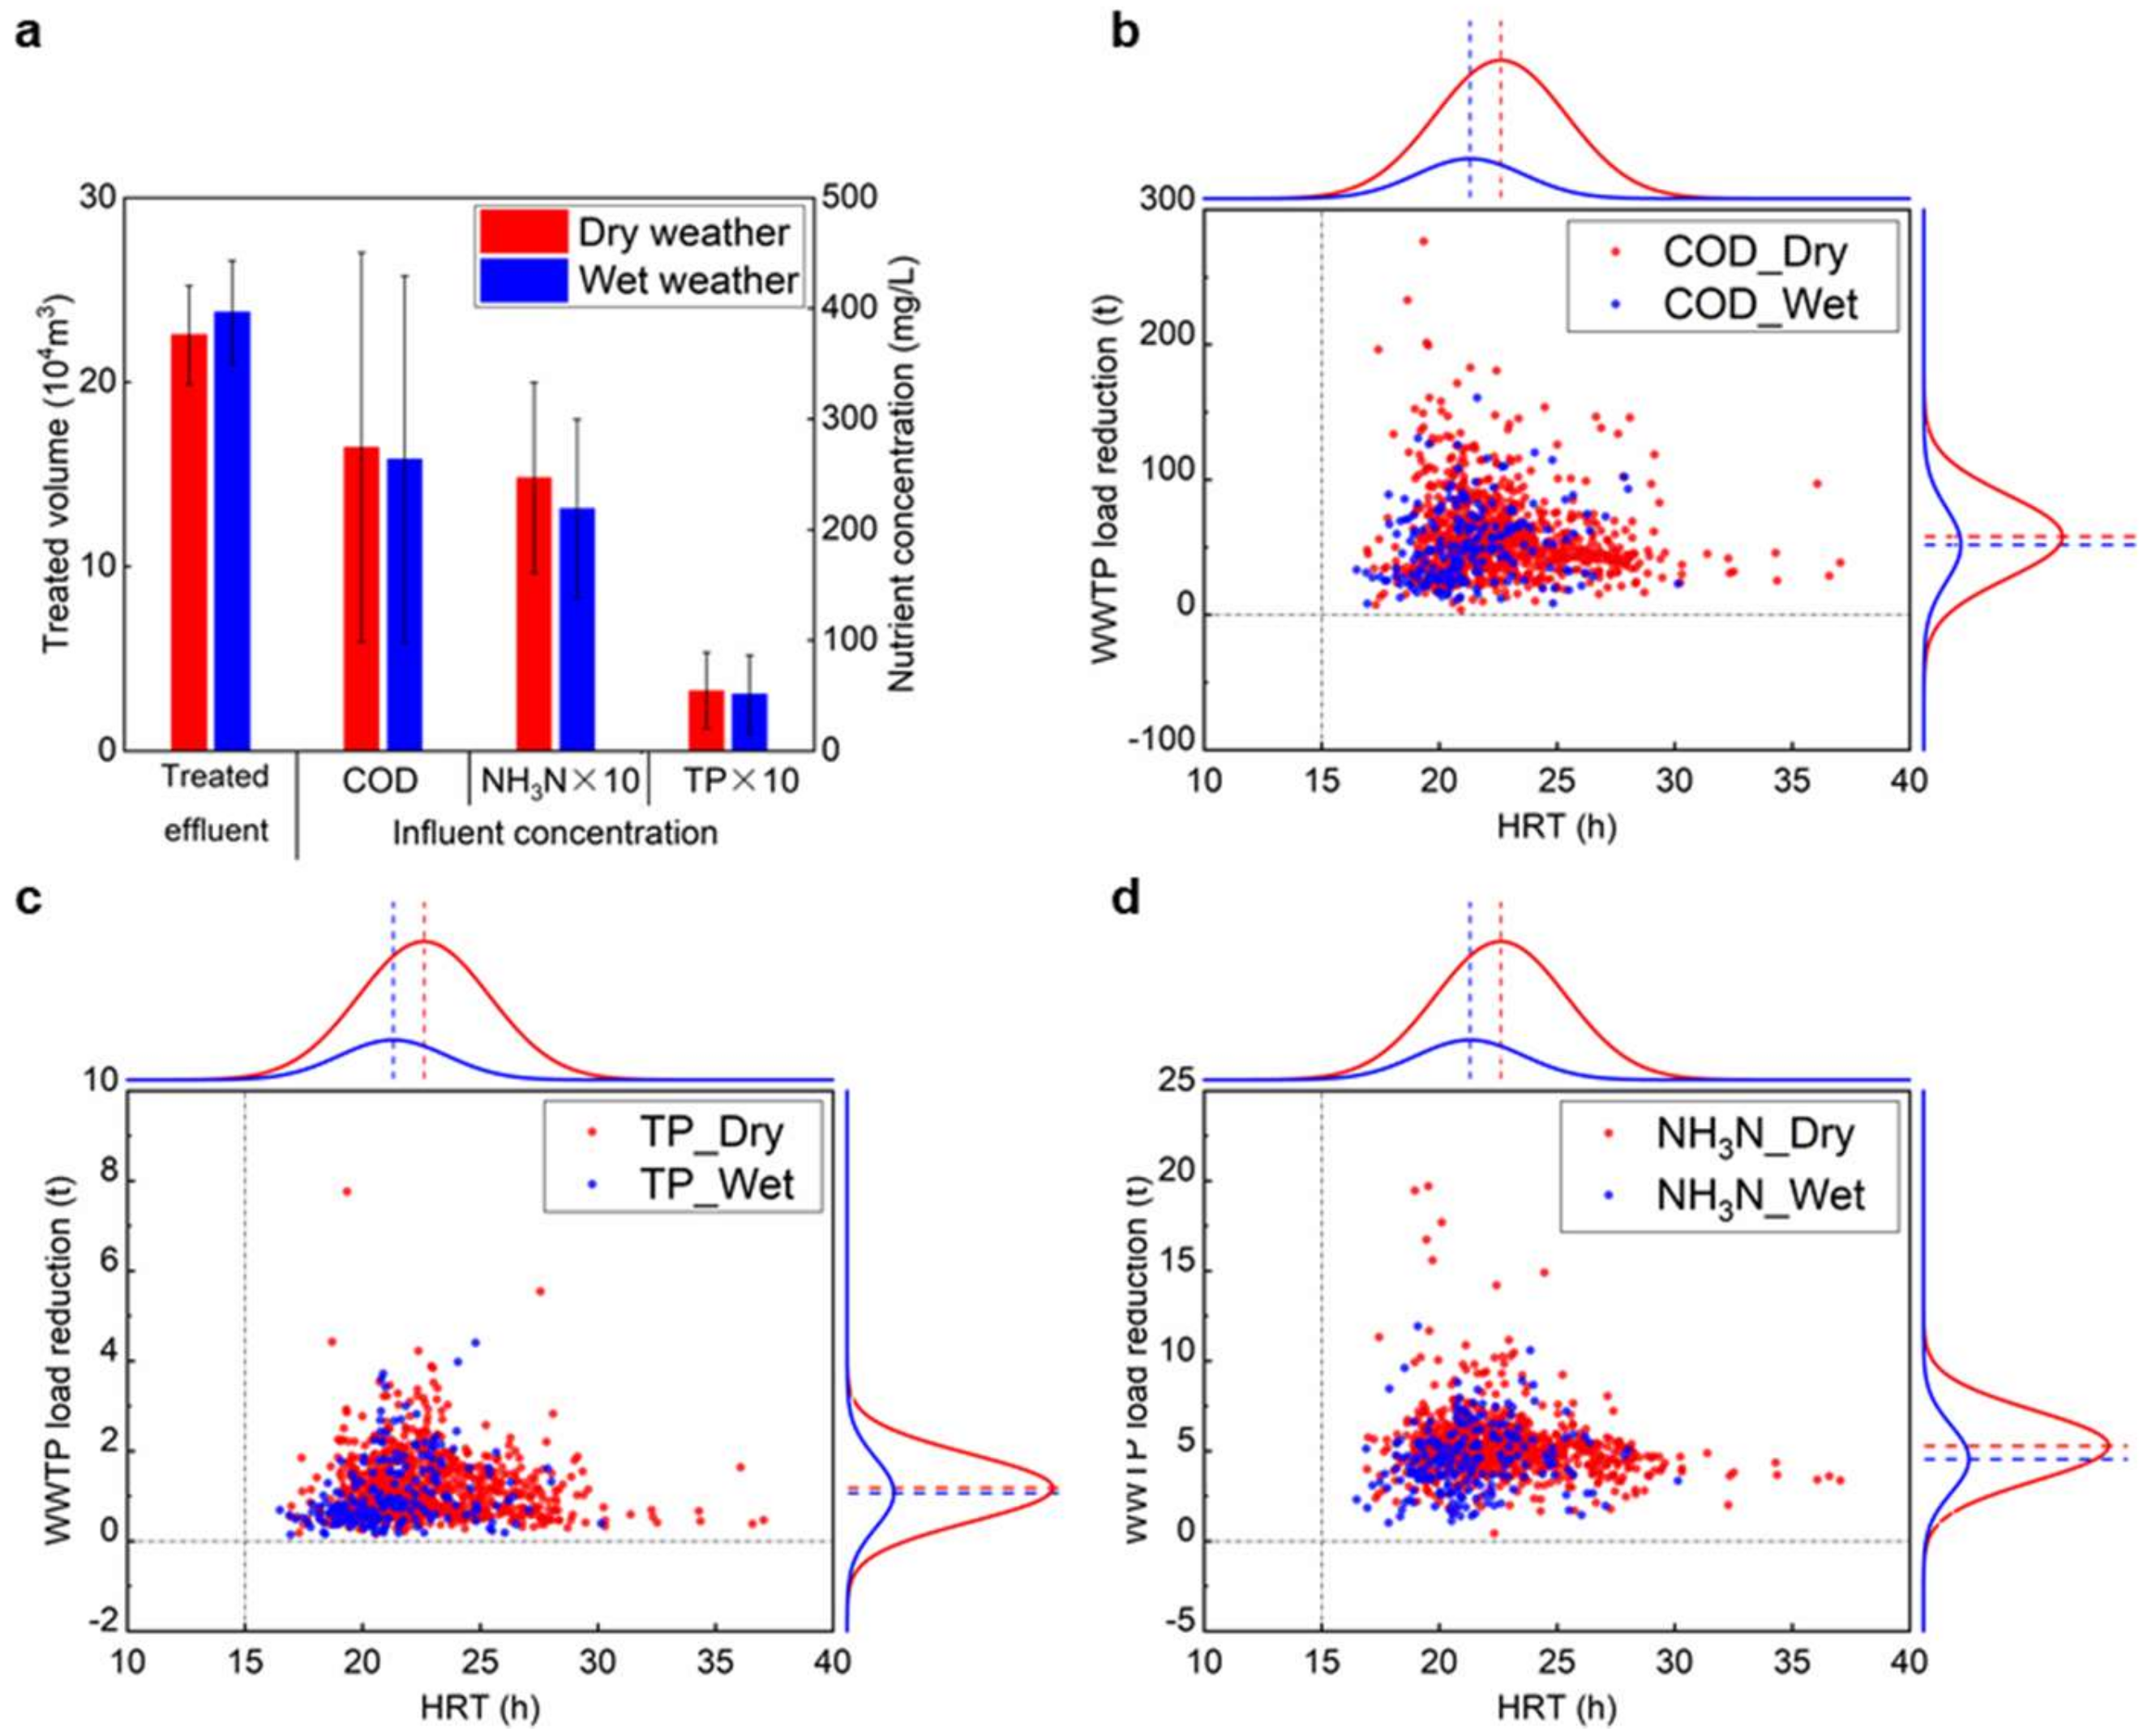
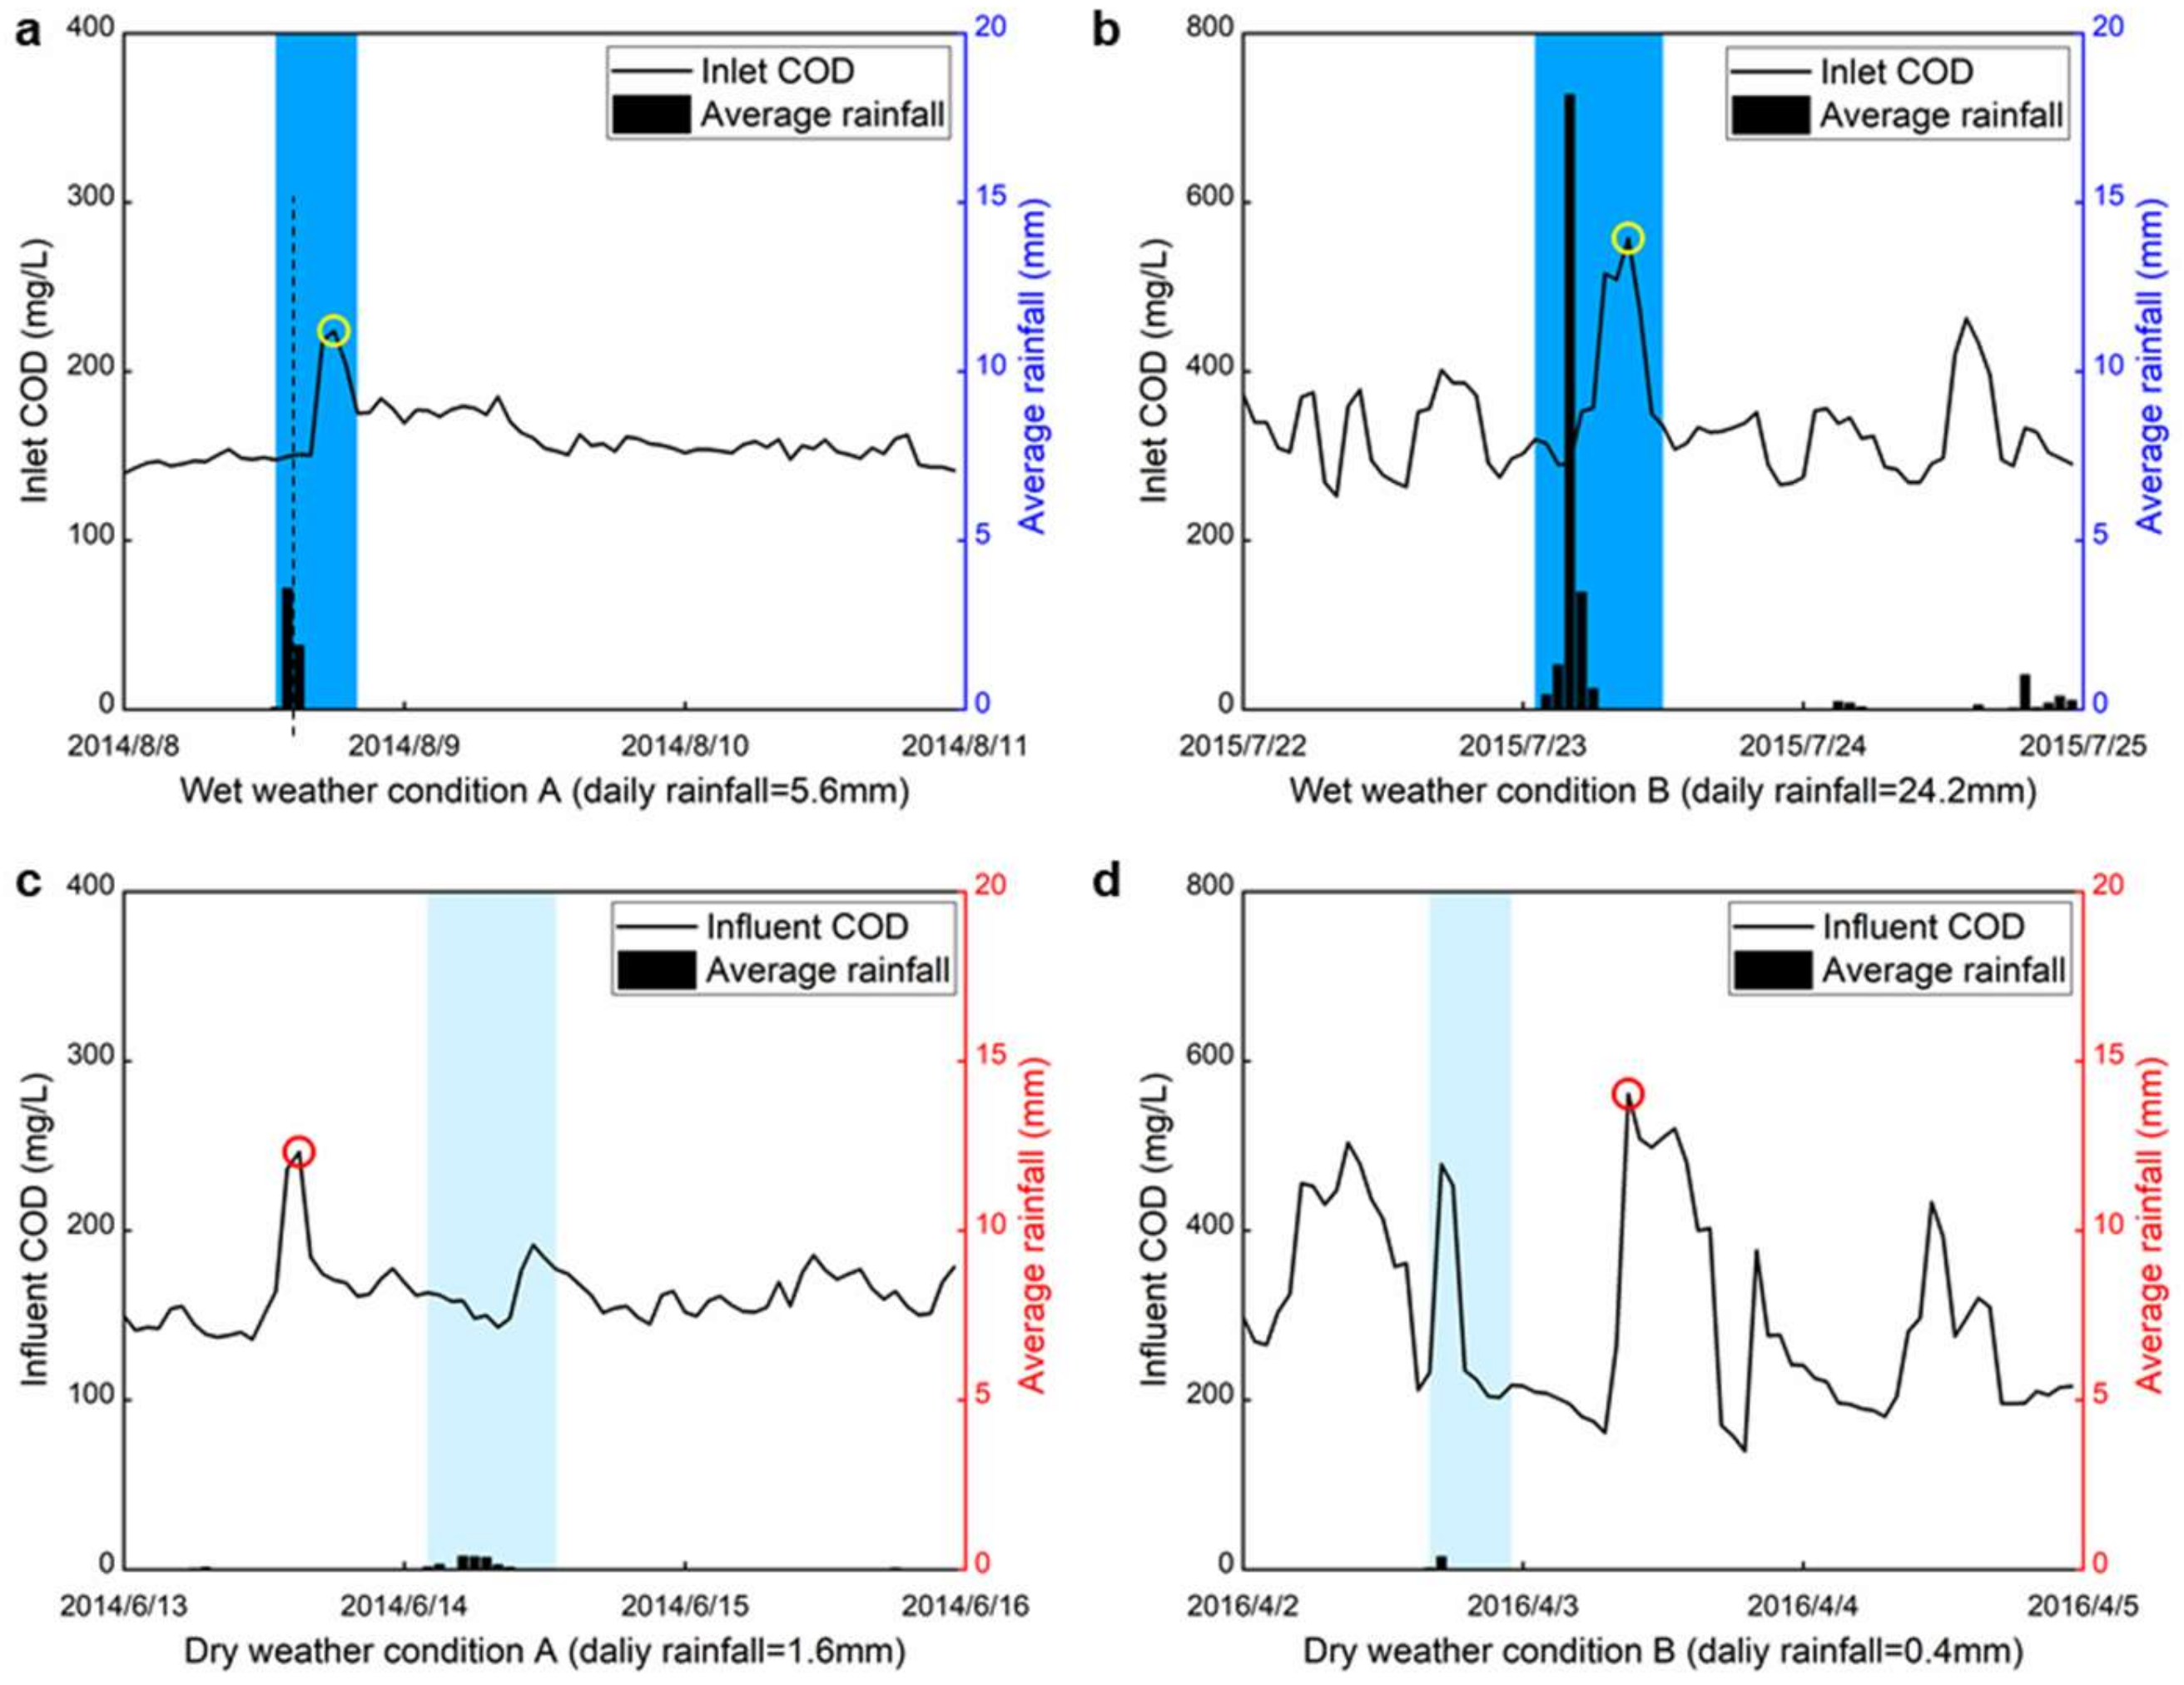
The WWTP performance during dry and wet weather over the three-year period is shown in Figure 6. An average of 12,000 m3 (5%) more diluted sewage was treated in the WWTP during one wet day, due to the combination of raw sewage and rainfall runoff, although there were obvious fluctuations in the influent quality and treated volume. Influent data fluctuations were also pronounced in the real-time data. Hourly influent COD response is illustrated during two wet and two dry weather conditions (Figure 7). The data showed that influent quality peaked in a rainfall event during wet weather that exacerbated the observed daily variation. WWTP load reductions on wet days are indicated in Figure 6 as individual blue points in the lower left corner of the scatter plots. The results suggested that the WWTP was more likely to operate at a short hydraulic retention time (HRT) with a low load reduction during wet weather. TP removal in wet days was significantly affected by weather conditions and was 21% lower than during dry weather.
CSDT efficiencies in 2016 were evaluated with daily rainfall intensities (Figure 8). Daily rainfall intensities were categorized as light (0–10 mm/day), moderate (10–25 mm/day), and heavy (>25 mm/day). The intercepted ratio was calculated as the fraction of rainfall runoff that was intercepted by CSDTs in the served area. Four CSDTs intercepted a total volume of 344,000 m3 in 2016 and a majority of the interception occurred under moderate rainfall intensities. The ratio of intercepted rainfall runoff decreased with increasing rainfall intensity. The maximum intercepted ratio was 0.34 and achieved under “light” rainfall conditions. These results implied that more than one-third of the runoff generated during light rainfall intensity events was collected and treated by the WWTP. Nonpoint source pollution under “light” rainfall conditions was mitigated significantly by CSDTs because CSDTs were designed to collect the dirty first flush and reduce the number and duration of overflow using limited capacity tanks [37,38]. However, continuous rainfall events in the rainy season resulted in WWTP overloads and weak performances of CSDTs under moderate and heavy rainfall intensities.
3.4. Temporal Variation of River Loads into the Lake
The integrated catchment model was used to calculate the water volume and nutrient loads contributed to the lake from untreated rainfall runoff, untreated sewage, and treated recharge. The temporal variation of river loads is discussed below with emphasis on identifying major sources and inter-annual variability.
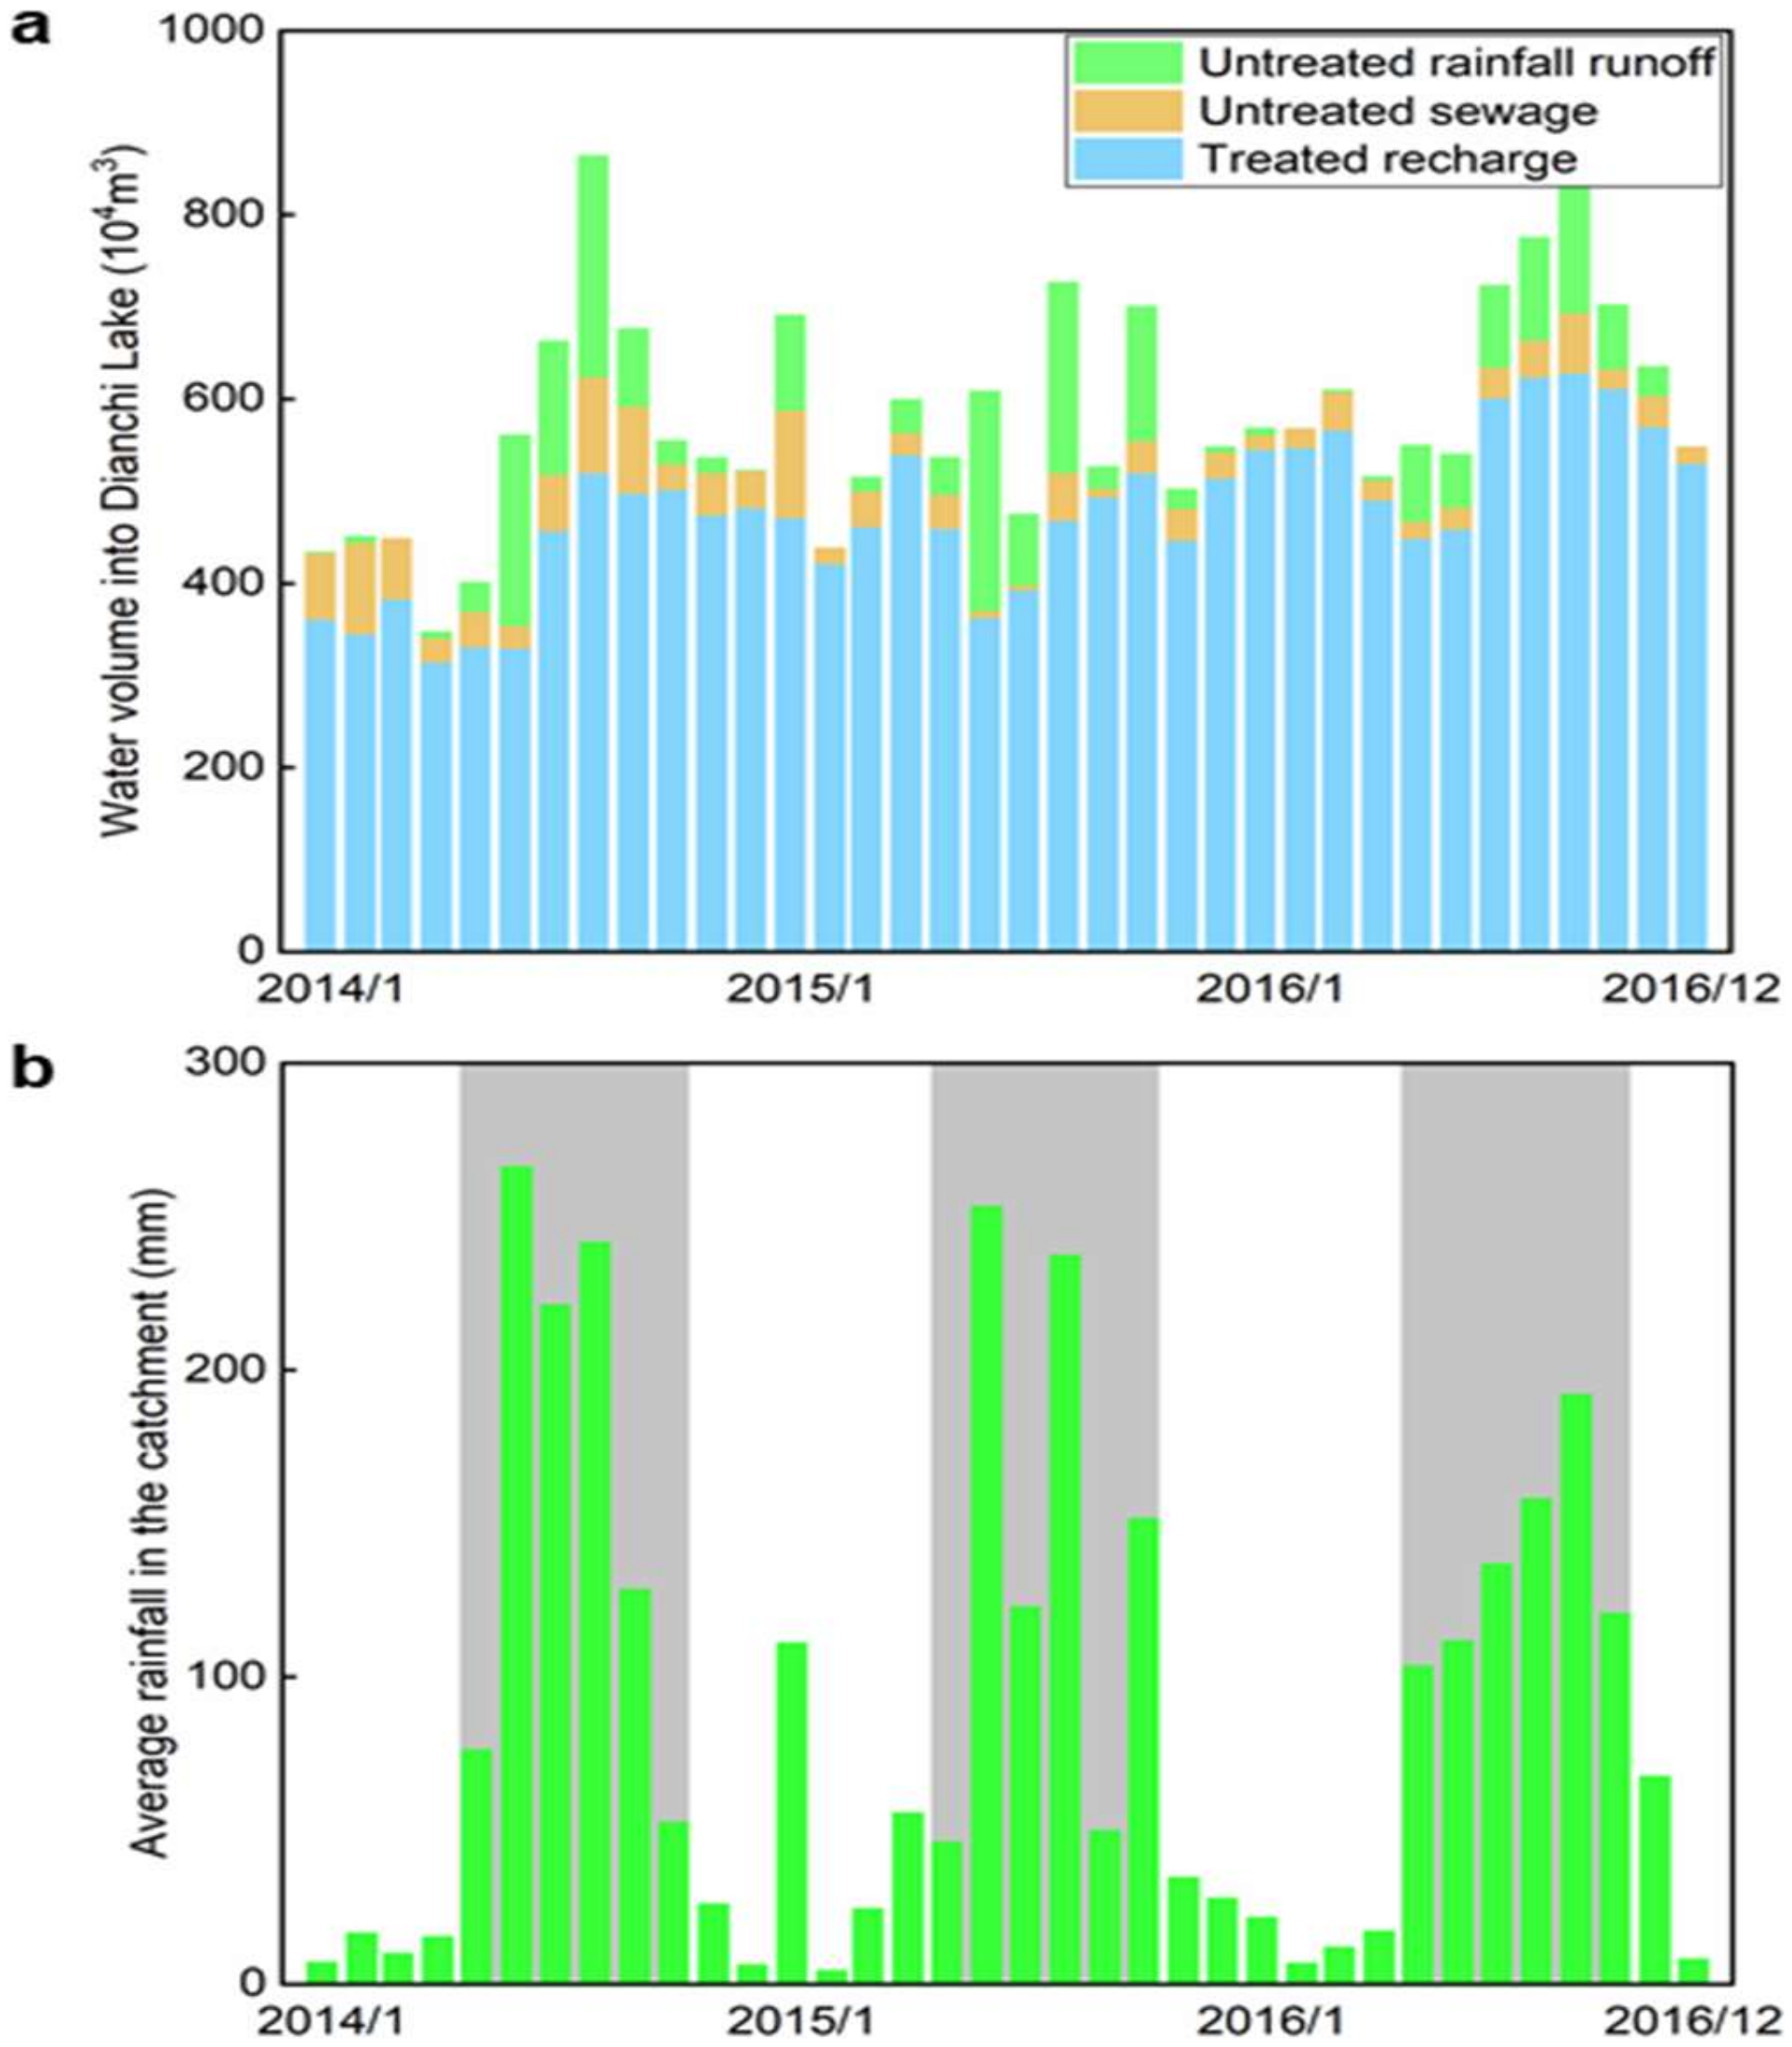
The monthly discharged water volume delineated by each nutrient source and the corresponding monthly rainfall in the catchment are presented in Figure 9. The annual average volume of discharge into the lake was 6.9 × 10⁷ m3. Peak monthly discharge volumes coincided with periods of heavy rainfall, while treated recharge was the primary contributor to water volume. The impact of treated recharge increased after 2014 because less treated effluent was recharged to other rivers following the completion of the Niulanjiang River-Dianchi Lake Water Replenishment Project [31]. The volume of untreated sewage was the smallest contributor among the three sources, and exhibited a 50% decline in its annual average during the three-year period.
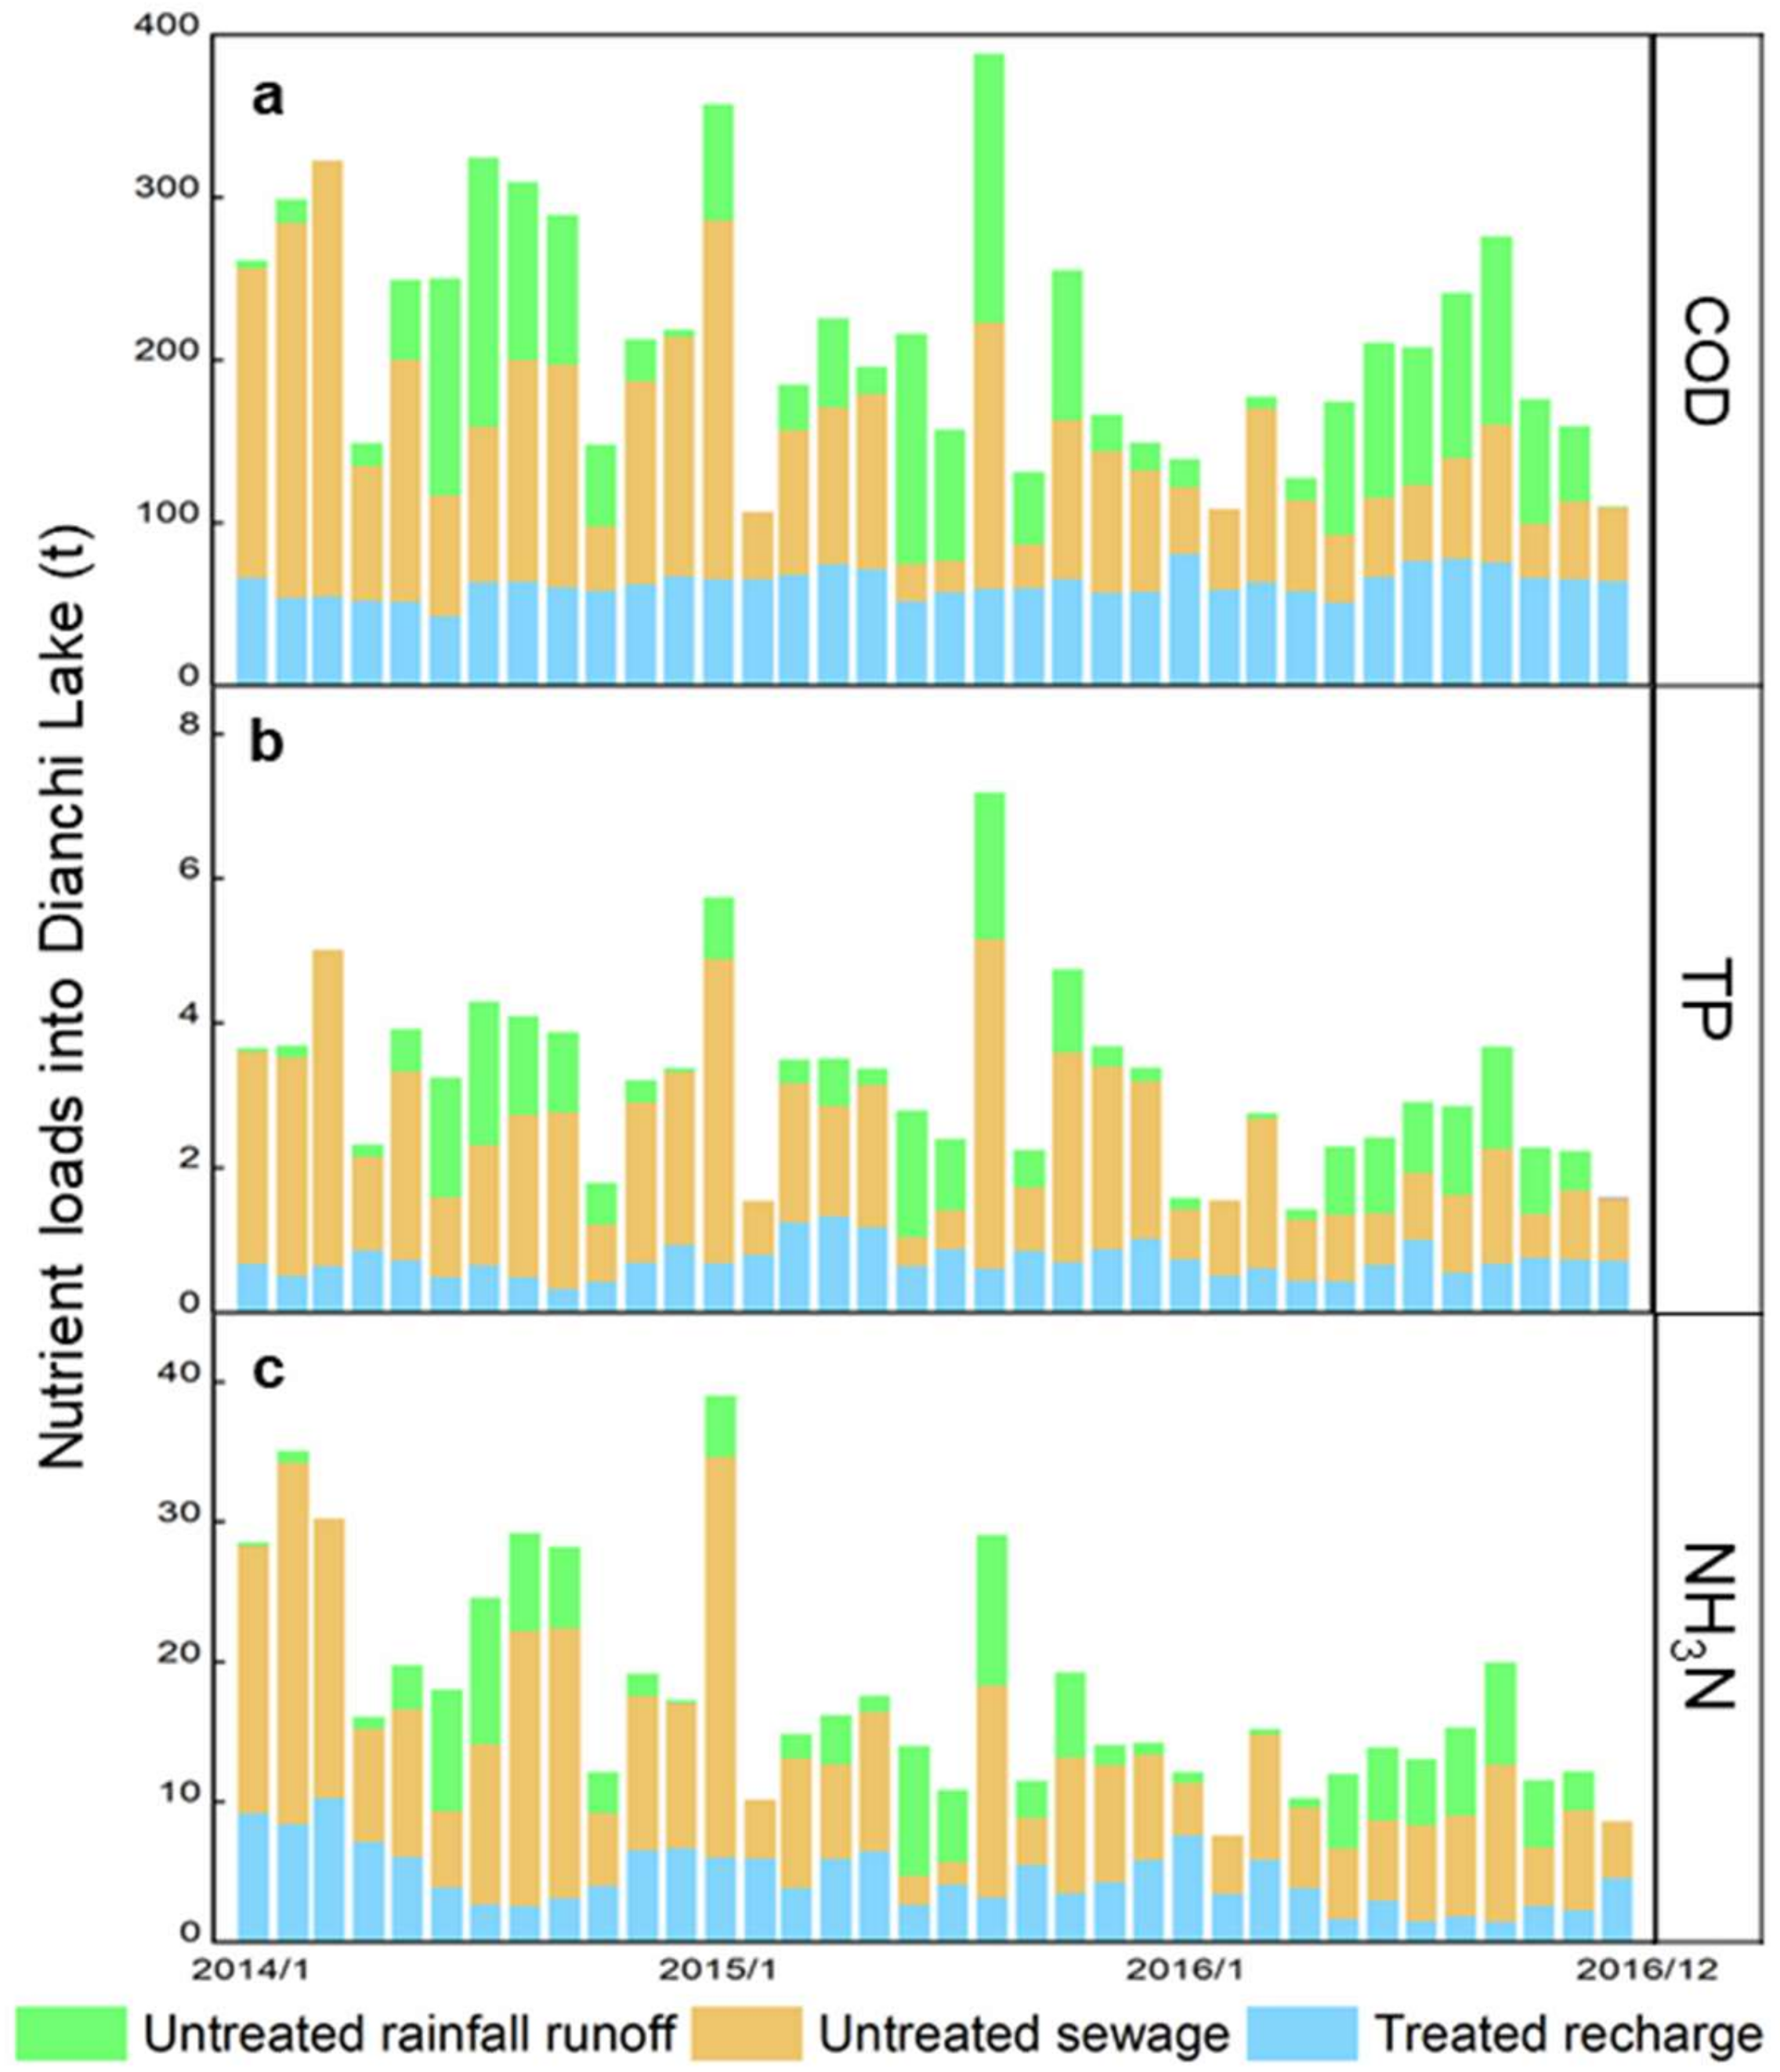
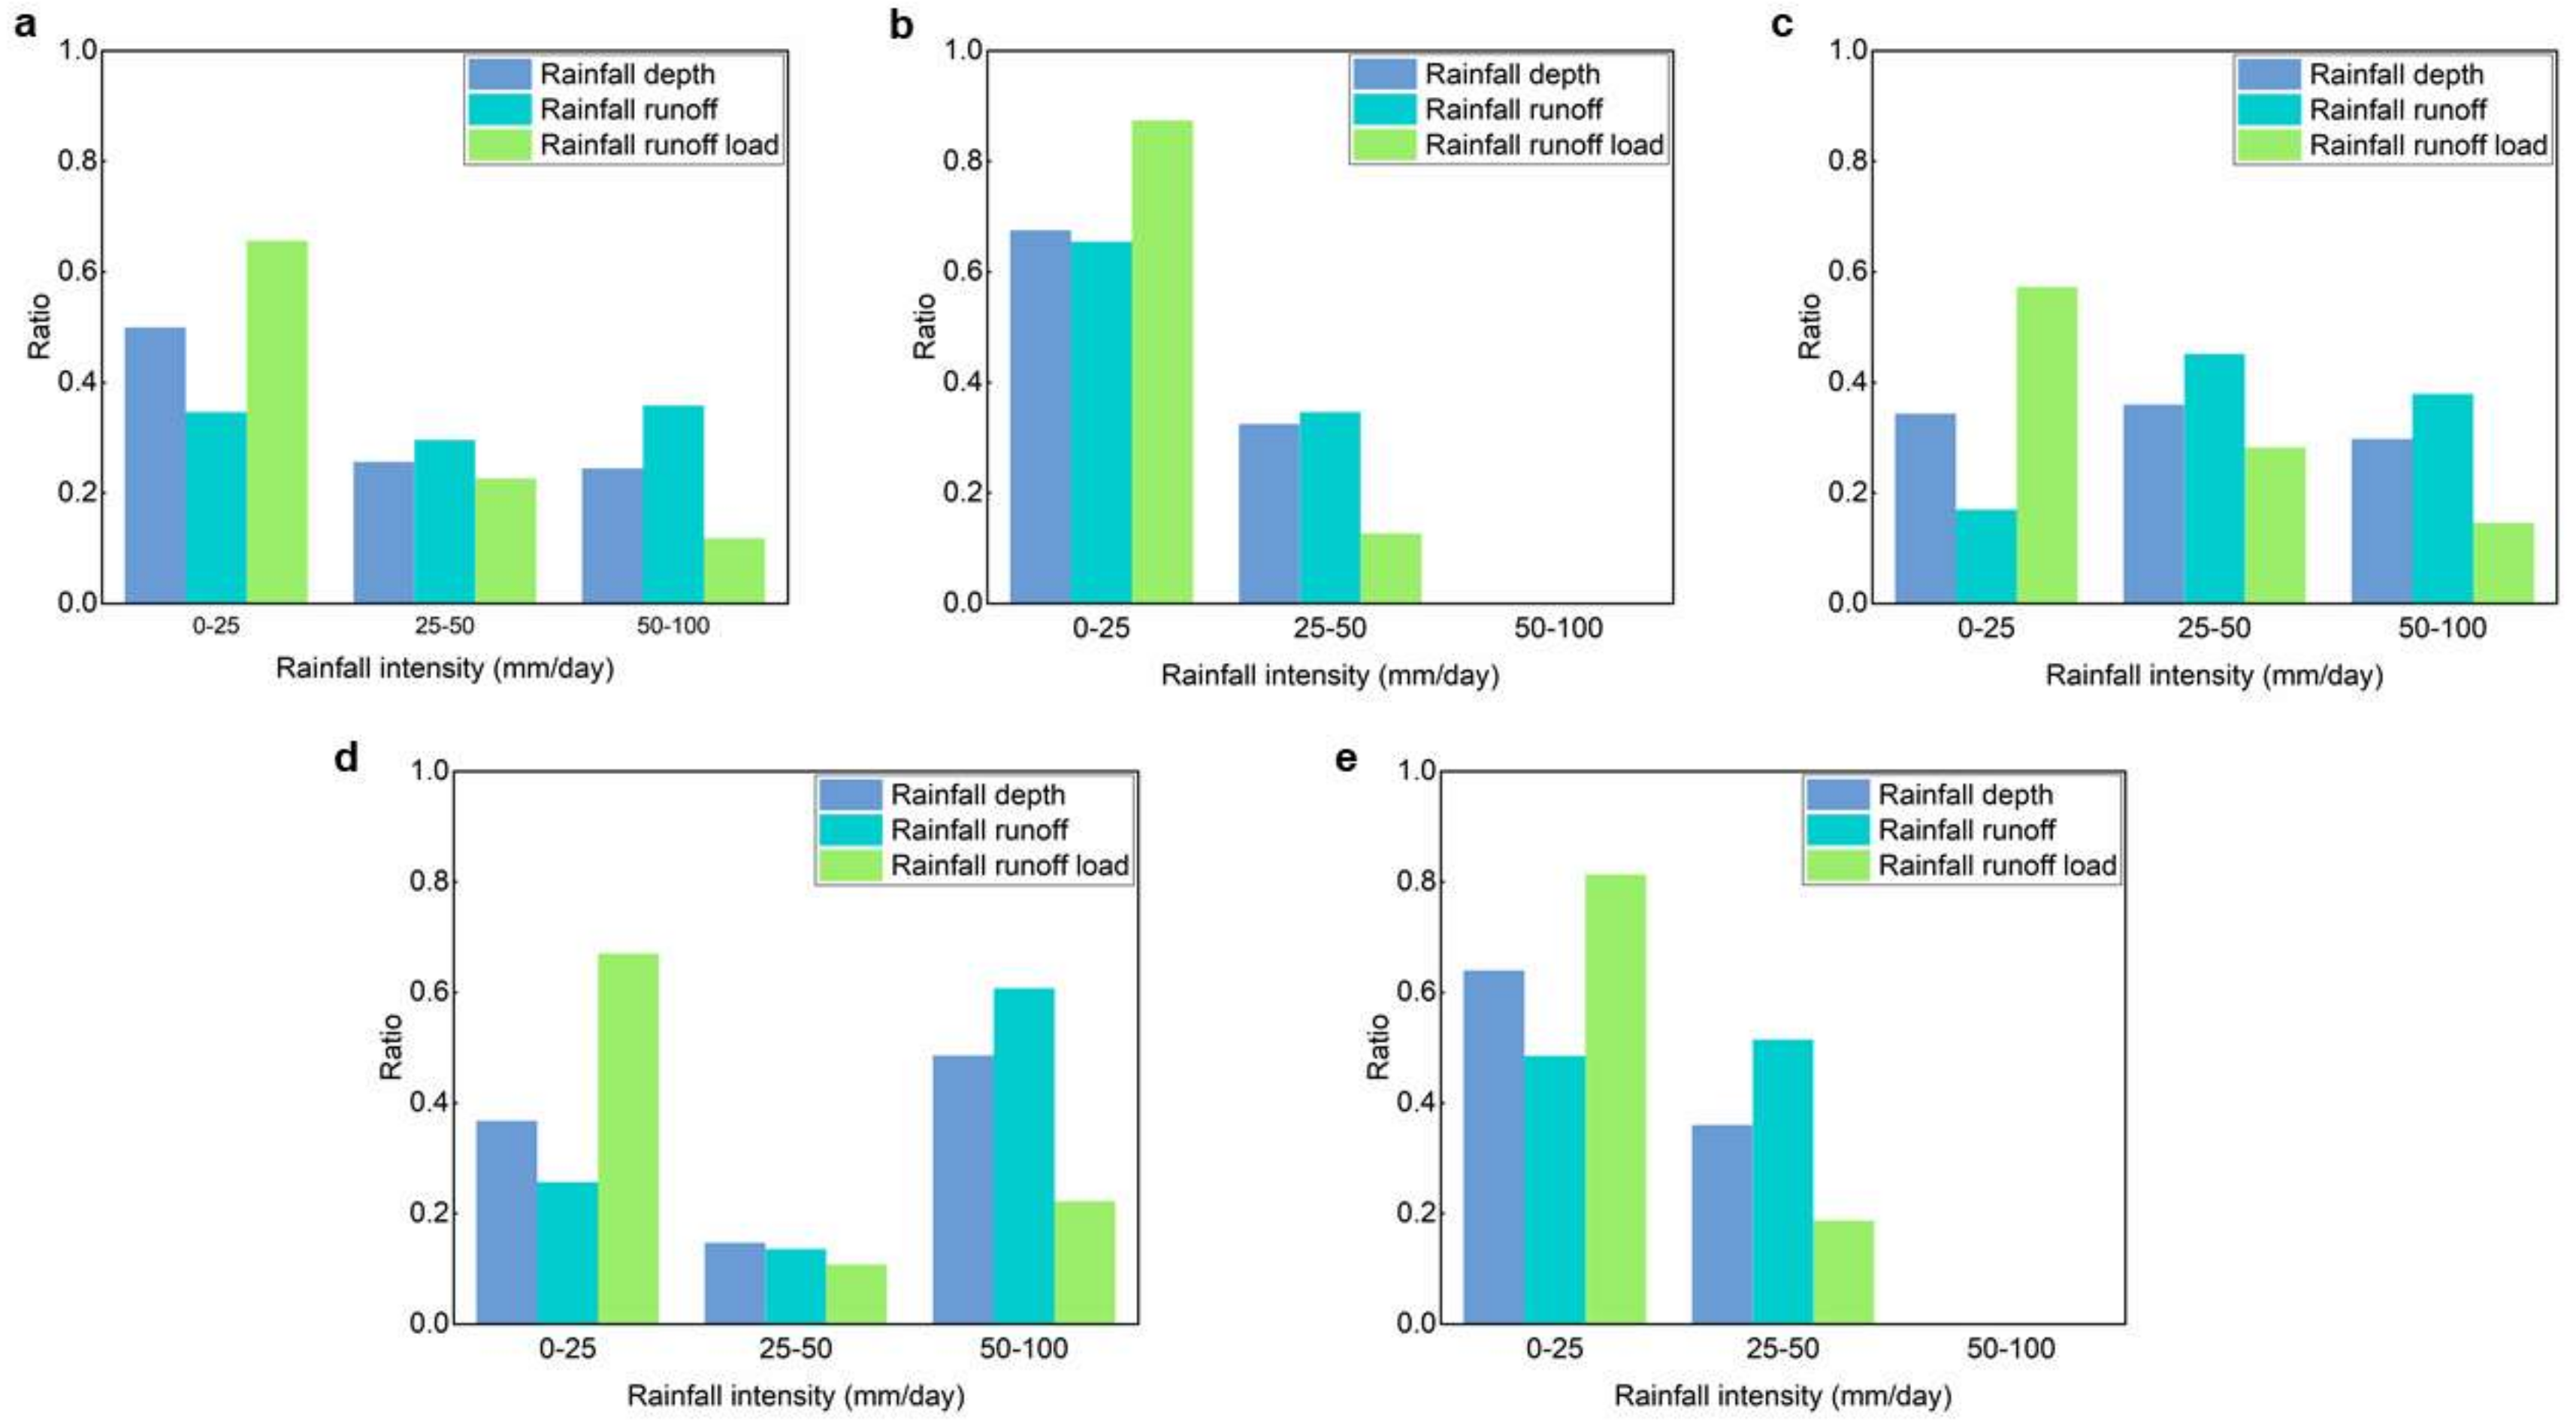
Monthly nutrient loads delineated by each nutrient source are presented in Figure 10. The annual average nutrient loads into the lake comprised 2559 tons of COD, 38 tons of TP, and 214 tons of NH3N. Total loads generally decreased except during heavy winter rainfall events in January 2015 and during a high-intensity pollution pattern associated with rainfall runoff in August 2015. Heavy rainfall events appeared to have long-duration effects in the winter, which influenced the accuracy of calculating untreated sewage discharge. For five summer months with peak rainfall depths greater than 200 mm, the majority of nutrient loads were generated under light-moderate rainfall intensities (Figure 11). These results indicated the lack of an obvious flushing effect with increasing rainfall runoff volume [39]. Of the three nutrient sources, treated recharge loads for TP and NH3N exhibited periodic variation and low points during the rainy season. Thus, the concentration of WWTP effluent during the rainy season was lower than during the dry season, despite the lower load reduction.
A summary of water volume and nutrient loads from the three sources are presented in Table 2 and expressed as average percentage contributions. Treated recharge was the largest source of river water into the lake, with a mean contribution of 82%. However, untreated sewage loads accounted for more than 40% of the COD, TP, and NH3N contents. Elevated untreated sewage loads were attributed to influent concentrations that were more than ten times that of the effluent, despite the relatively low volumes, consequently highlighting the importance of quantifying untreated sewage loads [40,41].
Inter-annual variation was evaluated using 2014 as the base year (Figure 12). The volume of untreated sewage sharply decreased during the three years thanks to the sewage infrastructure project. The treated sewage ratio was the fraction of dry-weather sewage that was treated by the WWTP and was calculated as the treated effluent divided by the sum of itself plus the untreated sewage. The treated sewage ratio was 0.96 in 2016, which represented 96% of the sewage that was collected and treated at the WWTP during dry weather periods. In addition, pronounced inter-annual changes were observed overall, with the exception of TP load in 2015. Treated recharge and untreated rainfall runoff loads increased slightly in 2015. This anomaly was attributed to the incidence of high-intensity pollution from rainfall runoff and the weak removal by WWTP that was affected by the heaviest rain events of all three years.
3.5. Nutrient Impacts on the Lake and Analysis of Scenarios.
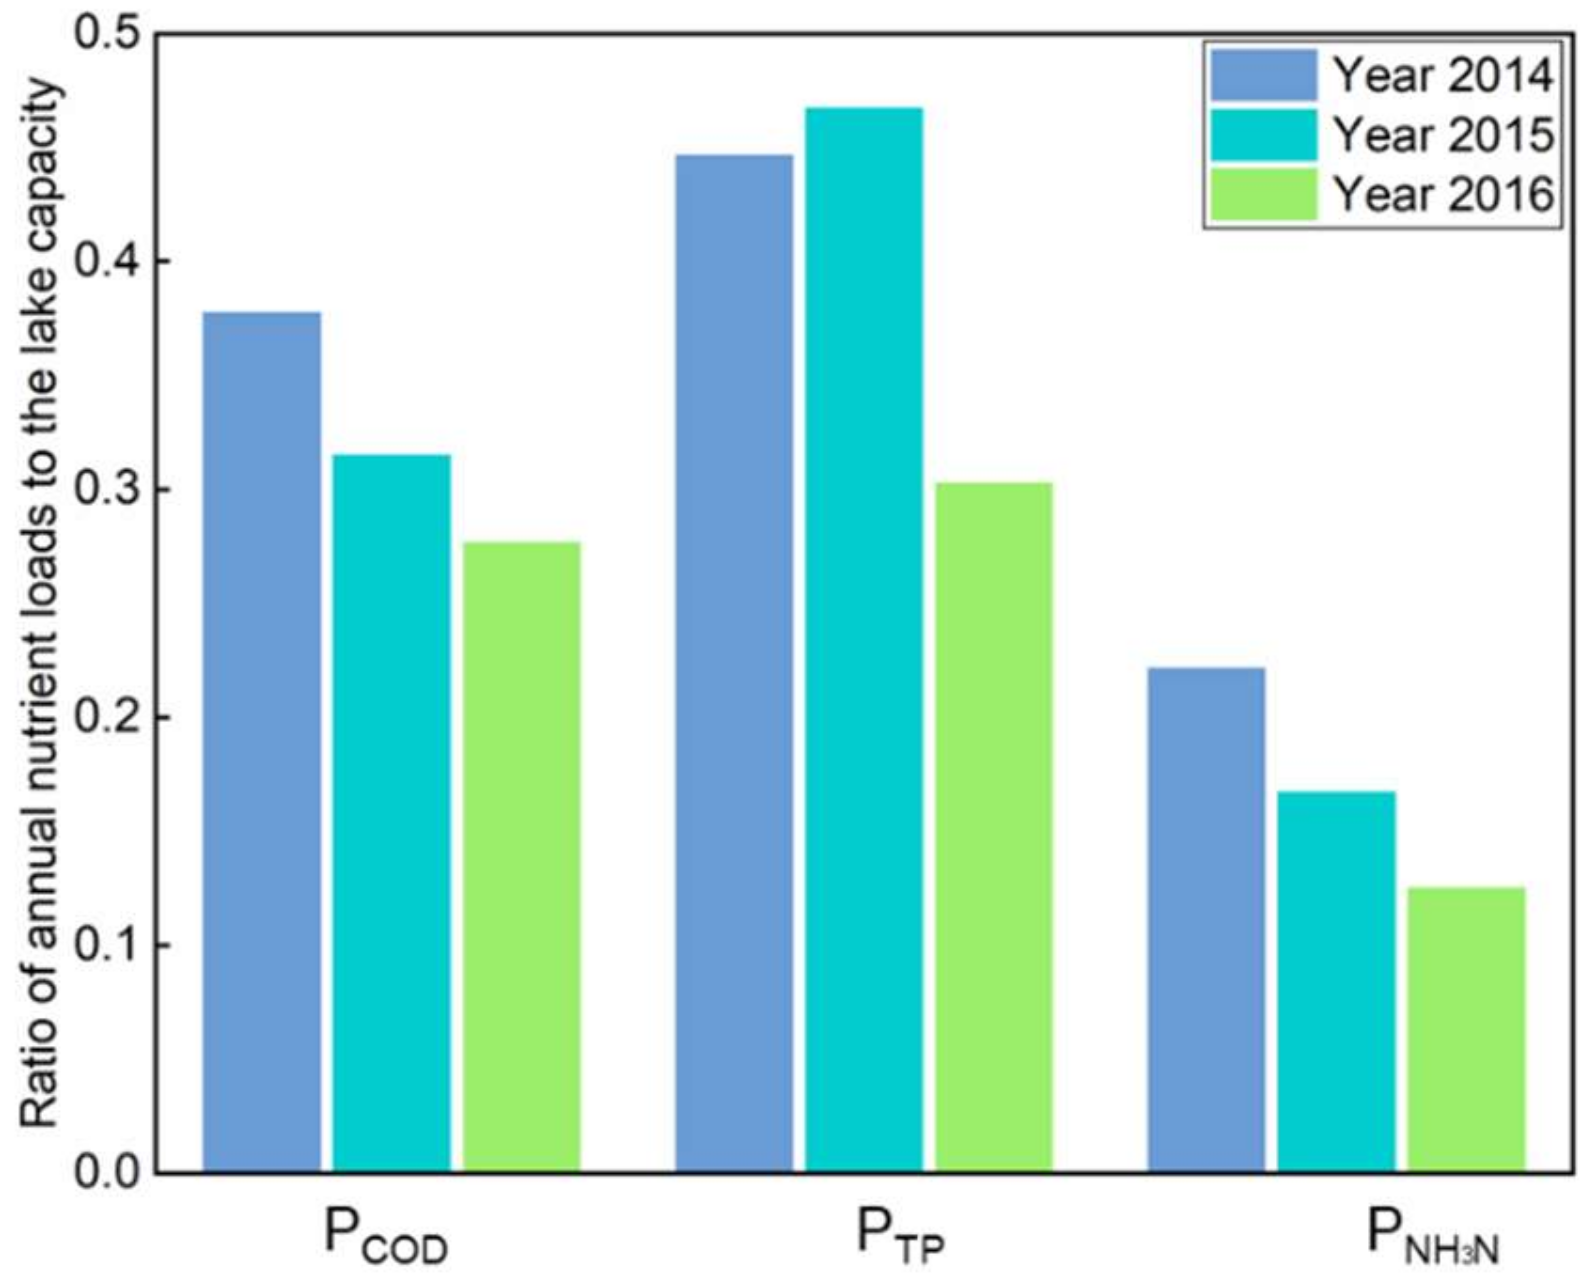
The principal nutrient was identified by the lake capacity. In addition, the impacts of nutrients on the lake were characterized based on the target capacity of Caohai Lake during the period of 2016–2020 (Figure 13). TP was the principal nutrient on the lake, which considered to be one of the main limiting factors in the Caohai Lake [42,43]. Considering three nutrients, the average ratio of nutrient loads to the lake capacity is 0.30. This number suggested an underestimation of nutrient impacts of urban rivers regarding the other six rivers into Caohai Lake (Figure 2) with a numerical relation of 0.30 versus 0.14 (1/7) and the large volume of recharge from the water replenishment project that were excluded from the calculation [31] with a numerical relation of 6.9 × 10⁷ m3 versus 3.0 × 10⁸ m3 (half of the 6.0 × 10⁸ m3).
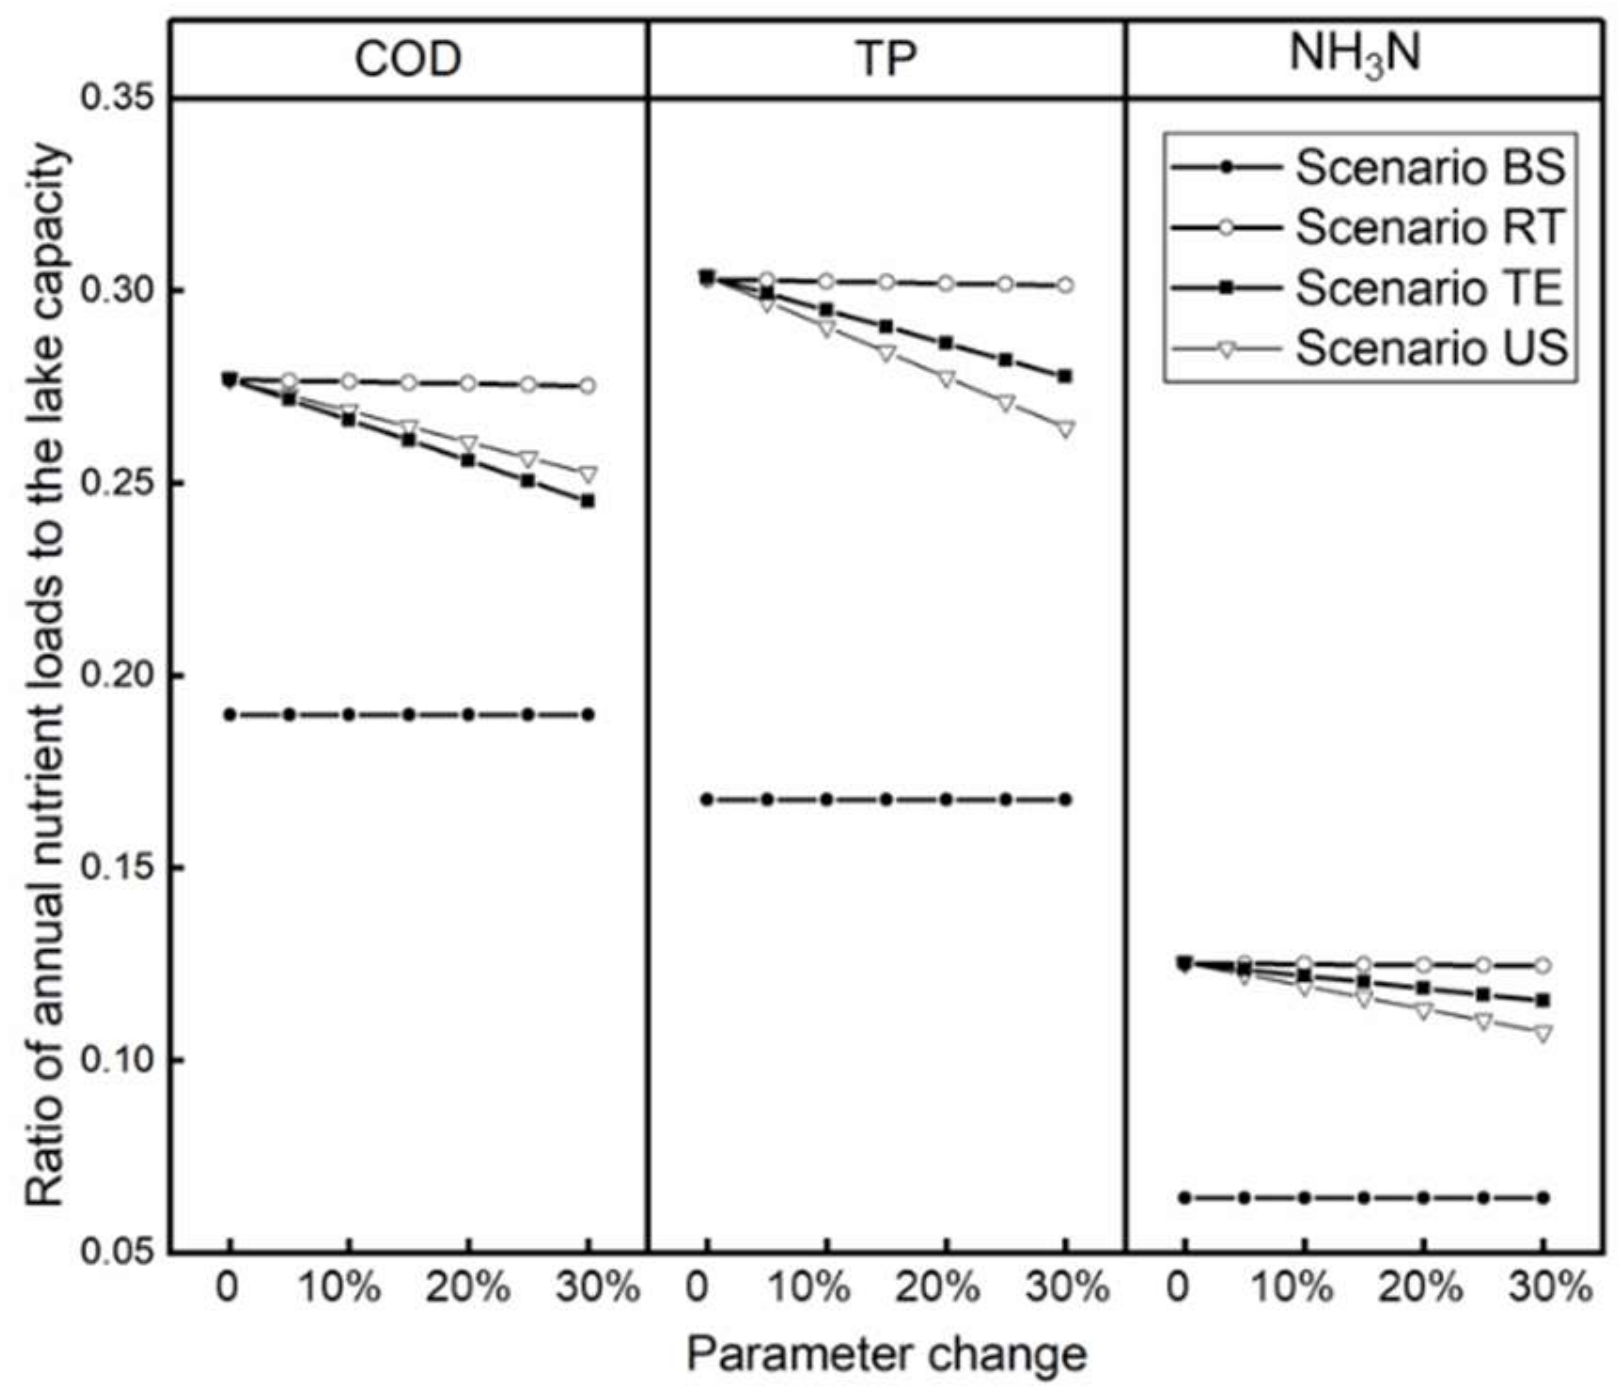
The analyses of load reduction scenarios indicated the presence of increased urban water management using 2016 as the base year (Figure 14). Three curves from the load reduction scenarios were above the basic scenario curve, highlighting the underestimation of the impact from the untreated sewage load. TP and NH3N load impacts decreased significantly with the variation of untreated sewage volume while COD load was more sensitive to the treated effluent concentration. Consequently, reducing the amount of untreated sewage in the incomplete sewage region should be a priority in order to improve the water quality of Dianchi Lake. Furthermore, we supposed that the reduced untreated sewage under scenario US was treated by the WWTP and therefore contributed to the increase of treated volume. Thus, efforts should be made to ensure the efficient operation of WWTPs during wet weather, and especially during heavy winter rain events.
3.6. Limitations
This study utilized a holistic perspective to evaluate the variation in nutrient loads from an urban catchment into the lake, while validating the approach with a case study. The contribution of three nutrient sources were separately analyzed by simplified representations of the drainage network, wet weather characterizations, reliable simulations of non-point source pollution modelling system, and the assumption of untreated sewage loads. Long-term nutrient loads were calculated using an integrated catchment model and three-year monitoring data available at various time scales (hourly, daily, and weekly). During wet weather conditions, the semi-distributed SWMM model is built to simulate the quantity and quality of rainfall runoff from the rooftops, paved roads, walk ways, and lawns in the fine-discretized sub-catchments with significant spatial differences. The temporal trends of load variation and source contributions were identified at the monthly scale without considering transient fluctuations. However, the acute short-term impacts of overflow pollution cannot be fully investigated using the current monitoring framework.
This study aimed to provide a holistic approach to evaluating nutrient impacts on the urban water environment for eutrophication control. An urban river catchment is a management unit for eutrophication control of the receiving water. Total nutrient loads into the lake consider WWTP recharge as one individual source, but do not consider the spatial difference of sewage generation in the catchment. Thus, all of the simplifications, assumptions, and results were case-based for the catchment. Different hydrological features, land use patterns, and other catchment characteristics may lead to different conclusions from those described here without careful validation.
4. Conclusions
A holistic approach was developed here that combined reliable simulations of urban drainage systems and a feasible long-term monitoring framework to assess the temporal nutrient source-impacts in an urban river catchment and also investigate the performance of WWTPs and CSDTs. This approach was based on drainage network analysis, wet weather characterizations, and the assumption of untreated sewage loads. The volume of untreated sewage was assumed to be the volume of wastewater that exceeded the transport capacity of the sewer system during dry weather and was considered static over one month, independent of rainfall amounts. Moreover, the concentration of untreated sewage was assumed to be equal to that of the WWTP influent during dry weather days over one month. Validation results showed good agreement between the assumed and ideal scenarios. Therefore, we established an integrated monitoring network for water quality, hydrology, and rainfall in the Laoyunlianghe River catchment and conducted long-term monitoring for the study period 2014–2016. An integrated catchment model was built and applied to calculate river nutrient loads from untreated rainfall runoff, untreated sewage, and treated recharge into the eutrophic Dianchi Lake. During wet weather conditions, the quantity and quality of rainfall runoff in the fine-discretized sub-catchments were simulated by the semi-distributed SWMM model. Nutrient impacts on the lake were evaluated using the target capacity for reference and a load reduction strategy was provided to enhance urban water management for eutrophication control.
New insights are described here for nutrient source-impacts in a highly urbanized catchment. The WWTP was more likely to operate at a short hydraulic retention time (HRT) with a low load reduction during wet weather. The ratio of intercepted rainfall runoff by four CSDTs in the catchment decreased with increasing rainfall intensity. Treated recharge was the largest source of river water into the lake with a mean contribution of 82%. Untreated sewage loads accounted for more than 40% of the COD, TP, and NH3N contents. Total loads generally decreased except for during heavy winter rainfall events in January 2015 and during a high-intensity pattern of pollution from rainfall runoff in August 2015. TP was identified as the principal nutrient in terms of nutrient impacts on the lake. The average contribution of annual nutrient loads to the lake capacity indicated the underestimation of nutrient impacts of urban rivers. Analysis of load reduction scenarios highlighted the idea that reducing the amount of untreated sewage in the incomplete sewage region was a priority in improving the water quality of Dianchi Lake. Future work should investigate the contributions of untreated sewage to the many other major rivers, and the acute short-term impacts of overflow pollution from urban rivers into the Dianchi Lake that will reduce the uncertainty in the estimation of nutrient loads.
Author Contributions
Conceptualization, C.Q.; Methodology, C.Q. and Z.L.; Software, X.P.; Validation, C.Q., Z.L., and X.P.; Formal analysis, C.Q.; Investigation, C.Q., Z.L., and X.P.; Resources, Q.H., X.T., and Y.W.; Data curation, C.Q., Q.H., X.T., and Y.W.; Writing—original draft preparation, C.Q.; Writing—review and editing, C.Q.; Visualization, C.Q.; Supervision, P.D.; Project administration, C.Q., Y.W.; Funding acquisition, P.D.
Funding
This study was funded by the Major Science and Technology Program for Water Pollution Control and Treatment China (Grant No. 2012ZX07302 and 2014ZX07323).
Acknowledgments
The authors thanks Kunming Dianchi Investment Co., Ltd. for local monitoring support.
Conflicts of Interest
The authors declare that they have no conflicts of interest.
References
- Zaharia, L.; Ioana Toroimac, G.; Cocoş, O.; Ghiţă, F.A.; Mailat, E. Urbanization effects on the river systems in the Bucharest City region (Romania). Ecosyst. Health Sustain. 2016, 2, 1–19. [Google Scholar] [CrossRef]
- Zhou, Q. A Review of Sustainable Urban Drainage Systems Considering the Climate Change and Urbanization Impacts. Water 2014, 6, 976–992. [Google Scholar] [CrossRef] [Green Version]
- Troutman, S.C.; Schambach, N.; Love, N.G.; Kerkez, B. An automated toolchain for the data-driven and dynamical modeling of combined sewer systems. Water Res. 2017, 126, 88–100. [Google Scholar] [CrossRef]
- Woodward, S.J.R.; Stenger, R.; Bidwell, V.J. Dynamic analysis of stream flow and water chemistry to infer subsurface water and nitrate fluxes in a lowland dairying catchment. J. Hydrol. 2013, 505, 299–311. [Google Scholar] [CrossRef]
- Boënne, W.; Desmet, N.; Van Looy, S.; Seuntjens, P. Use of online water quality monitoring for assessing the effects of WWTP overflows in rivers. Environ. Sci. Process. Impacts 2014, 16, 1510–1518. [Google Scholar] [CrossRef] [PubMed]
- Shen, Z.; Liao, Q.; Hong, Q.; Gong, Y. An overview of research on agricultural non-point source pollution modelling in China. Sep. Purif. Technol. 2012, 84, 104–111. [Google Scholar] [CrossRef]
- Wang, L.; Wei, J.; Huang, Y.; Wang, G.; Maqsood, I. Urban nonpoint source pollution buildup and washoff models for simulating storm runoff quality in the Los Angeles County. Environ. Pollut. 2011, 159, 1932–1940. [Google Scholar] [CrossRef]
- Mailhot, A.; Talbot, G.; Lavallée, B. Relationships between rainfall and Combined Sewer Overflow (CSO) occurrences. J. Hydrol. 2015, 523, 602–609. [Google Scholar] [CrossRef]
- Even, S.; Mouchel, J.; Servais, P.; Flipo, N.; Poulin, M.; Blanc, S.; Chabanel, M.; Paffoni, C. Modelling the impacts of Combined Sewer Overflows on the river Seine water quality. Sci. Total Environ. 2007, 375, 140–151. [Google Scholar] [CrossRef]
- Al Aukidy, M.; Verlicchi, P. Contributions of combined sewer overflows and treated effluents to the bacterial load released into a coastal area. Sci. Total Environ. 2017, 607–608, 483–496. [Google Scholar] [CrossRef]
- Divers, M.T.; Elliott, E.M.; Bain, D.J. Quantification of Nitrate Sources to an Urban Stream Using Dual Nitrate Isotopes. Environ. Sci. Technol. 2014, 48, 10580–10587. [Google Scholar] [CrossRef]
- Viviano, G.; Valsecchi, S.; Polesello, S.; Capodaglio, A.; Tartari, G.; Salerno, F. Combined Use of Caffeine and Turbidity to Evaluate the Impact of CSOs on River Water Quality. Water Air Soil Pollut. 2017, 228, 330. [Google Scholar] [CrossRef]
- Rollwagen-Bollens, G.; Lee, T.; Rose, V.; Bollens, S. Beyond Eutrophication: Vancouver Lake, WA, USA as a Model System for Assessing Multiple, Interacting Biotic and Abiotic Drivers of Harmful Cyanobacterial Blooms. Water 2018, 10, 757. [Google Scholar] [CrossRef]
- Xia, R.; Zhang, Y.; Critto, A.; Wu, J.; Fan, J.; Zheng, Z.; Zhang, Y. The Potential Impacts of Climate Change Factors on Freshwater Eutrophication: Implications for Research and Countermeasures of Water Management in China. Sustainability 2016, 8, 229. [Google Scholar] [CrossRef]
- Wu, Z.; Liu, Y.; Liang, Z.; Wu, S.; Guo, H. Internal cycling, not external loading, decides the nutrient limitation in eutrophic lake: A dynamic model with temporal Bayesian hierarchical inference. Water Res. 2017, 116, 231–240. [Google Scholar] [CrossRef] [PubMed]
- Chen, J.; Zhang, T.; Du, P. Assessment of water pollution control strategies: A case study for the Dianchi Lake. J. Environ. Sci.-China 2002, 14, 76–78. [Google Scholar] [PubMed]
- Wang, D.; Guo, F.; Wu, Y.; Li, Z.; Wu, G. Technical, economic and environmental assessment of coagulation/filtration tertiary treatment processes in full-scale wastewater treatment plants. J. Clean. Prod. 2018, 170, 1185–1194. [Google Scholar] [CrossRef]
- Dai, C.; Guo, H.C.; Tan, Q.; Ren, W. Development of a constructed wetland network for mitigating nonpoint source pollution through a GIS-based watershed-scale inexact optimization approach. Ecol. Eng. 2016, 96, 94–108. [Google Scholar] [CrossRef]
- Zhang, R.; Zhou, Q.; Shi, Y.; Li, X. Study on Storm Runoff Characteristics in Agricultural Area in the Dianchi Valleys. China Water Wastewater 2003, 19, 13–16. [Google Scholar]
- Gao, W.; Zhou, F.; Guo, H.; Zheng, Y.; Yang, C.; Zhu, X.; Li, N.; Liu, W.; Sheng, H.; Chen, Q.; et al. High-resolution nitrogen and phosphorus emission inventories of Lake Dianchi Watershed. Acta Sci. Circumst. 2013, 33, 240–250. [Google Scholar]
- Huang, D.; Bader, H.; Scheidegger, R.; Schertenleib, R.; Gujer, W. Confronting limitations: New solutions required for urban water management in Kunming City. J. Environ. Manag. 2007, 84, 49–61. [Google Scholar] [CrossRef] [PubMed]
- Xu, X.; Wu, X.; He, J.; Wang, L.; Zhang, Y.; Yang, Y.; Chen, Y.; Ye, H. Research on the pollution characteristics of Dianchi watershed (1988–2014) and identification of countermeasures. J. Lake Sci. 2016, 28, 476–484. [Google Scholar]
- Dai, C.; Qin, X.S.; Tan, Q.; Guo, H.C. Optimizing best management practices for nutrient pollution control in a lake watershed under uncertainty. Ecol. Indic. 2018, 92, 288–300. [Google Scholar] [CrossRef]
- Li, Z.; Xie, P.; Du, P. Simulation of pollution control in Laoyunliang River, Kunming. Acta Sci. Circumst. 2017, 37, 1657–1667. [Google Scholar]
- Shi, F.; Du, P.; Zhang, D.; Song, K.; Chen, J. Nonpoint source pollution simulation in greenhouse region of Dianchi Basin. J. Tsinghua Univ. (Sci. Technol.) 2005, 45, 363–366. [Google Scholar]
- Huang, C.; Wang, X.; Yang, H.; Li, Y.; Wang, Y.; Chen, X.; Xu, L. Satellite data regarding the eutrophication response to human activities in the plateau lake Dianchi in China from 1974 to 2009. Sci. Total Environ. 2014, 485–486, 1–11. [Google Scholar] [CrossRef]
- Liu, X. The identification of nutrient limitations on eutrophication in Dianchi Lake, China. Water Environ. J. 2017, 31, 592–597. [Google Scholar] [CrossRef]
- Rossman, L.A. Storm Water Management Model User's Manual, Version 5.0. National Risk Management Research Laboratory, Office of Research and Development, USA Environmental Protection Agency: Washington, DC, USA, 2010. [Google Scholar]
- Wang, S.; Zhang, M.; Li, B.; Xing, D.; Wang, X.; Wei, C.; Jia, Y. Comparison of mercury speciation and distribution in the water column and sediments between the algal type zone and the macrophytic type zone in a hypereutrophic lake (Dianchi Lake) in Southwestern China. Sci. Total Environ. 2012, 417–418, 204–213. [Google Scholar] [CrossRef]
- Zhang, T.; Zeng, W.H.; Wang, S.R.; Ni, Z.K. Temporal and spatial changes of water quality and management strategies of Dianchi Lake in southwest China. Hydrol. Earth Syst. Sci. 2014, 18, 1493–1502. [Google Scholar] [CrossRef] [Green Version]
- Chen, G.; Sang, X.; Shixiang, G.U.; Yang, X.; Zhou, Z.; Youyang, L.I. Joint disposals of multi-source water resources for rehabilitating healthy water cycle in Lake Dianchi Basin. J. Lake Sci. 2018, 30, 57–69. [Google Scholar]
- Yang, K.; Yu, Z.; Luo, Y.; Yang, Y.; Zhao, L.; Zhou, X. Spatial and temporal variations in the relationship between lake water surface temperatures and water quality-A case study of Dianchi Lake. Sci. Total Environ. 2018, 624, 859–871. [Google Scholar] [CrossRef] [PubMed]
- Ward, R.C.; Robinson, M. Principles of Hydrology; McGraw-Hill: New York, NY, USA, 1967. [Google Scholar]
- Kunming Municipal Government, China. Water Pollution Control Planning in Dianchi Lake Watershed during Thirteenth Five-Year Plan; Kunming Municipal Government: Kunming, China, 2016. [Google Scholar]
- Archer, D.R.; Fowler, H.J. Characterising flash flood response to intense rainfall and impacts using historical information and gauged data in Britain. J. Flood Risk Manag. 2018, 11, S121–S133. [Google Scholar] [CrossRef]
- Nardi, F.; Annis, A.; Biscarini, C. On the impact of urbanization on flood hydrology of small ungauged basins: The case study of the Tiber river tributary network within the city of Rome. J. Flood Risk Manag. 2018, 11, S594–S603. [Google Scholar] [CrossRef]
- Todeschini, S.; Papiri, S. Performance of stormwater detention tanks in an experimental catchment of northern Italy. WIT Trans. Built Environ. 2012, 122, 273–284. [Google Scholar]
- Xu, X.; Li, W.; He, J.; Zhang, L.; Wang, L.; Li, S.; Zheng, L. Simulation Study on the Interception Efficiency of Rainwater Storage Tanks in Kunming. Res. Environ. Sci. 2012, 25, 1180–1186. [Google Scholar]
- Broder, T.; Biester, H. Hydrologic controls on DOC, As and Pb export from a polluted peatland–the importance of heavy rain events, antecedent moisture conditions and hydrological connectivity. Biogeosciences 2015, 12, 4651–4664. [Google Scholar] [CrossRef]
- Quijano, J.C.; Zhu, Z.; Morales, V.; Landry, B.J.; Garcia, M.H. Three-dimensional model to capture the fate and transport of combined sewer overflow discharges: A case study in the Chicago Area Waterway System. Sci. Total Environ. 2017, 576, 362–373. [Google Scholar] [CrossRef]
- USA Environmental Protection Agency. Report to Congress: Impacts and Control of CSOs and SSOs; Office of Water: Washington, DC, USA, 2004. [Google Scholar]
- Chen, Y.C.; Zhang, D.; Tang, L. The spatial and temporal variations of phosphate concentrations and their relationships with algal growth in Lake Dianchi, China. Ecol. Environ. Sci. 2010, 19, 1363–1368. [Google Scholar]
- Yu, Q.; Chen, Y.; Liu, Z.; de Giesen, N.V.; Zhu, D. The influence of a eutrophic lake to the river downstream: Spatiotemporal algal composition changes and the driving factors. Water 2015, 7, 2184–2201. [Google Scholar] [CrossRef]
Figure 1.
Methodology for evaluating nutrient source-impacts.

Figure 2.
The Laoyunlianghe River catchment situated in the north of Dianchi Lake. The Laoyunlianghe River is one of the seven rivers into Caohai Lake, the northern part of Dianchi Lake.
Figure 2.
The Laoyunlianghe River catchment situated in the north of Dianchi Lake. The Laoyunlianghe River is one of the seven rivers into Caohai Lake, the northern part of Dianchi Lake.

Figure 3.
The urban-dominated land use patterns and complex river network of the Laoyunlianghe River catchment (right) with a focus on the drainage network of the lower catchment (left). The three major nutrient sources identified in this study are denoted by blue rectangles.
Figure 3.
The urban-dominated land use patterns and complex river network of the Laoyunlianghe River catchment (right) with a focus on the drainage network of the lower catchment (left). The three major nutrient sources identified in this study are denoted by blue rectangles.

Figure 4.
Calendar heat map of average daily rainfall depth in the Laoyunlianghe River catchment, as well as days of river water quality monitoring (blue circles). Darker colors in the calendar refer to more intense rainfall events.
Figure 4.
Calendar heat map of average daily rainfall depth in the Laoyunlianghe River catchment, as well as days of river water quality monitoring (blue circles). Darker colors in the calendar refer to more intense rainfall events.

Figure 5.
(a) The three-year average and (b) monthly data coverage of untreated sewage under six antecedent dry weather period (ADWP) scenarios. The green shaded area in scenario ADWP 1 represents monthly data coverage in the three-year period. Red shaded areas mean the presence of data gaps.
Figure 5.
(a) The three-year average and (b) monthly data coverage of untreated sewage under six antecedent dry weather period (ADWP) scenarios. The green shaded area in scenario ADWP 1 represents monthly data coverage in the three-year period. Red shaded areas mean the presence of data gaps.

Figure 6.
Wastewater treatment plants (WWTP) performance during dry and wet weather: (a) Histogram of treated volume and influent concentrations with standard deviations; (b) chemical oxygen demand (COD), (c) total phosphorus (TP), and (d) ammonia nitrogen (NH3N) load reduction versus hydraulic retention time (HRT). Scatter plots with marginal distribution curves are created by three-year operational data for dry (red) and wet (blue) periods.

Figure 7.
Hourly influent COD of the WWTP during two wet (a-b) and two dry (c-d) weather conditions. The plotted rainfall measurement is the hourly average of seven gauges in the catchment. Shaded areas represent estimated rainfall runoff durations. Yellow and red circles refer to observed peak concentrations.

Figure 8.
Combined sewer detention tank (CSDT) performances under different rainfall intensities and the ratio of intercepted rainfall runoff in the area served by the CSDTs (solid circles) in 2016.
Figure 8.
Combined sewer detention tank (CSDT) performances under different rainfall intensities and the ratio of intercepted rainfall runoff in the area served by the CSDTs (solid circles) in 2016.

Figure 9.
(a) Monthly discharged water volume delineated by each nutrient source; (b) monthly average rainfall depth measured by seven rain gauges in the catchment. Shaded areas indicate rainy season periods (May−October).
Figure 9.
(a) Monthly discharged water volume delineated by each nutrient source; (b) monthly average rainfall depth measured by seven rain gauges in the catchment. Shaded areas indicate rainy season periods (May−October).

Figure 10.
Monthly nutrient loads delineated by each nutrient source: (a) COD; (b) TP; and (c) NH3N.
Figure 10.
Monthly nutrient loads delineated by each nutrient source: (a) COD; (b) TP; and (c) NH3N.

Figure 11.
Ratio of rainfall runoff volume and nutrient load (example of COD) under three rainfall intensities during five summer months with peak rainfall depths greater than 200 mm: (a) June 2014 (246.5 mm/mon); (b) July 2014 (220.9 mm/mon); (c) August 2014 (238.5 mm/mon); (d) June 2015 (248.3 mm/mon); (e) August 2015 (238.5 mm/mon). There are high-intensity pollution patterns of rainfall runoff in July 2014 and August 2015.

Figure 12.
Ratio of discharged water volume and nutrient loads using 2014 as the base year. Treated recharge ratios (open circles) and treated sewage ratios (solid circles) are overlaid along the corresponding water volumes.
Figure 12.
Ratio of discharged water volume and nutrient loads using 2014 as the base year. Treated recharge ratios (open circles) and treated sewage ratios (solid circles) are overlaid along the corresponding water volumes.

Figure 13.
Ratio of annual nutrient load contributions to the lake capacity by year.

Figure 14.
Impact of parameter change on the lake capacity under four load reduction scenarios using 2016 as the base year. Circles on each curve indicate the ratio of annual river loads to the lake capacity with the corresponding parameter change.
Figure 14.
Impact of parameter change on the lake capacity under four load reduction scenarios using 2016 as the base year. Circles on each curve indicate the ratio of annual river loads to the lake capacity with the corresponding parameter change.


Table 1.
Load reduction scenario definitions.
| Scenario | Main Characteristics |
|---|---|
| BS | Loads into the lake without untreated sewage 1 |
| RT | Increase of rainfall retention volume |
| TE | Improvement of treated effluent concentration |
| US | Reduction of untreated sewage volume |
1 Basic scenario.
Table 2.
Contribution of nutrient sources to water volumes and nutrient loads into the river.
| Source Parameter | Treated Recharge | Untreated Sewage | Untreated Rainfall Runoff |
|---|---|---|---|
| Water volume | 82% | 7% | 11% |
| COD load | 29% | 44% | 27% |
| TP load | 23% | 56% | 21% |
| NH3N load | 26% | 54% | 20% |
© 2019 by the authors. Licensee MDPI, Basel, Switzerland. This article is an open access article distributed under the terms and conditions of the Creative Commons Attribution (CC BY) license (http://creativecommons.org/licenses/by/4.0/).
Share and Cite
MDPI and ACS Style
Qin, C.; Li, Z.; Xie, P.; Hao, Q.; Tang, X.; Wu, Y.; Du, P. Temporal Variation and Reduction Strategy of Nutrient Loads from an Urban River Catchment into a Eutrophic Lake, China. Water 2019, 11, 166. https://doi.org/10.3390/w11010166
AMA Style
Qin C, Li Z, Xie P, Hao Q, Tang X, Wu Y, Du P. Temporal Variation and Reduction Strategy of Nutrient Loads from an Urban River Catchment into a Eutrophic Lake, China. Water. 2019; 11(1):166. https://doi.org/10.3390/w11010166
Chicago/Turabian StyleQin, Chengxin, Zhiyi Li, Pengcheng Xie, Qianting Hao, Xuejun Tang, Yihui Wu, and Pengfei Du. 2019. "Temporal Variation and Reduction Strategy of Nutrient Loads from an Urban River Catchment into a Eutrophic Lake, China" Water 11, no. 1: 166. https://doi.org/10.3390/w11010166
Note that from the first issue of 2016, this journal uses article numbers instead of page numbers. See further details here.