Case Report

Contribution of Excessive Supply of Solid Material to a Runoff-Generated Debris Flow during Its Routing Along a Gully and Its Impact on the Downstream Village with Blockage Effects

1
State Key Laboratory of Hydraulics and Mountain River Engineering, Sichuan University, Chengdu 610065, China
2
College of Water Resource and Hydropower, Sichuan University, Chengdu 610065, China
*
Author to whom correspondence should be addressed.
Water 2019, 11(1), 169; https://doi.org/10.3390/w11010169
Submission received: 3 January 2019 / Revised: 14 January 2019 / Accepted: 15 January 2019 / Published: 18 January 2019
(This article belongs to the Special Issue Water Related Disaster and Water Environment Management)

Abstract

:
On 8 August 2017, a runoff-generated debris flow occurred in the Puge County, Sichuan Province of southwestern China and caused huge property damage and casualties (25 people died and 5 people were injured). Emergency field investigations found that paddy fields, dry land, residential buildings and roads suffered different degrees of impact from the debris flow. This paper reveals the formation process of the debris flow by analyzing the characteristics of rainfall precipitation and sediment supply conditions in the study area and it approaches the practical application of hazard prevention and mitigation constructions. Doppler weather radar analysis indicates that a very high intensity rainfall occurred in the middle and upper zones of the basin, illustrating the importance of enhancing rainfall monitoring in high-altitude areas. The abundant supply of deposits in gully channels is among the significant causes of a transformation from mountain floods to large-scale debris flows. It was also found that the two culverts played an important role in the movement affecting the processes of debris flows which has substantially aggravated the destructive outcome. The excessive supply of solid material and local blockage with outburst along a gully must receive significant attention for the prediction of future debris flows, hazard prevention and mitigation measures.

1. Introduction

Debris flows have been posed a great threat to human beings, infrastructure (e.g., roads, tunnels, bridges) and residences in mountainous areas. In recent years, the number of debris flow events increased because of the combination of high intensity rainfalls and the availability of solid material due to the seismic load in Southwest China after the 2008 Wenchuan Earthquake [1,2,3]. Debris flow essentially is a solid-liquid mixture routing on very high slopes. More refined descriptions of debris flows are provided by Iverson [4,5]. A debris flow can be initiated from the shallow failure induced by high pore water pressure within shearing slip zones or from sediment entrainment into runoff by erosion. Runoff-generated debris flow is characterized by the rapid movement and the sufficient runoff to disperse solid grains throughout the whole depth of flow [6,7,8]. The movement process of runoff-generated debris flow is usually accompanied with the entrainment of a large quantity of debris material. Therefore, they occur in the mountainous areas of Southwest China when they are hit by heavy rainfall that can cause abundant runoff that is able to entrain large quantities of debris material. Such a triggering mechanism, initially revealed by laboratory experiments on flumes [9] and slopes [10,11,12], has also been shown by field investigations in all different environments around the world [13,14,15,16,17,18,19,20], including China [20,21]. These debris flows, once being triggered, can dramatically grow in volume [22,23,24,25,26,27,28,29] due to the entrainment of debris deposits on the propagation direction. The runout area and deposition depth depend on the debris flow volume [30,31,32,33,34]. Such events increased over the past years due to the increase of (1) extreme rainfall [35], (2) the melting of glaciers [36] induced by climate change and (3) in particular cases, great earthquakes, such as the Wenchuan earthquakes [37,38,39,40,41,42,43].
Around human settlements, prevention construction and measures for geological risks are designed and established to ensure the safety of personnel and property and to reduce the impact from geological hazards to the greatest extent possible. Protection and stabilization structures, sediment retention works (e.g., check dams, sediment trapping dams) and siltation and discharge control works (drainage channels, grilled dams, sedimentation basins, step-pool systems and others) are the constructions that are commonly used to regulate the formation and movement of debris flows [44]. However, in the mountainous areas of southwestern China, some previous hazard prevention and reduction construction measures did not effectively work and increased the risk to human beings [45,46,47]. One of the main reasons for this is that the magnitude of the design event was underestimated because the excess supply of solid materials was not considered.
In this work, a debris flow that occurred in the Puge County will be used as a case study (Figure 1). Aimed at understanding the mechanism of sediment supply conditions that influence the evolution of debris flows and artificial structures that influence movement process, the event will be analyzed in detail in the paper. Emergency field investigations identified three regions in the study area: the formation area, the transition area and the inundated or runout area, which reflect, respectively, the corresponding different activity characteristics of debris flows. After comprehensive analyses of the results of the field investigation and three essential factors (generation of surface runoff; supply condition and channel steepness), the contributions from the excessive supply of solid materials and local blockage with outburst along the gully channel will be discussed systematically in this paper.

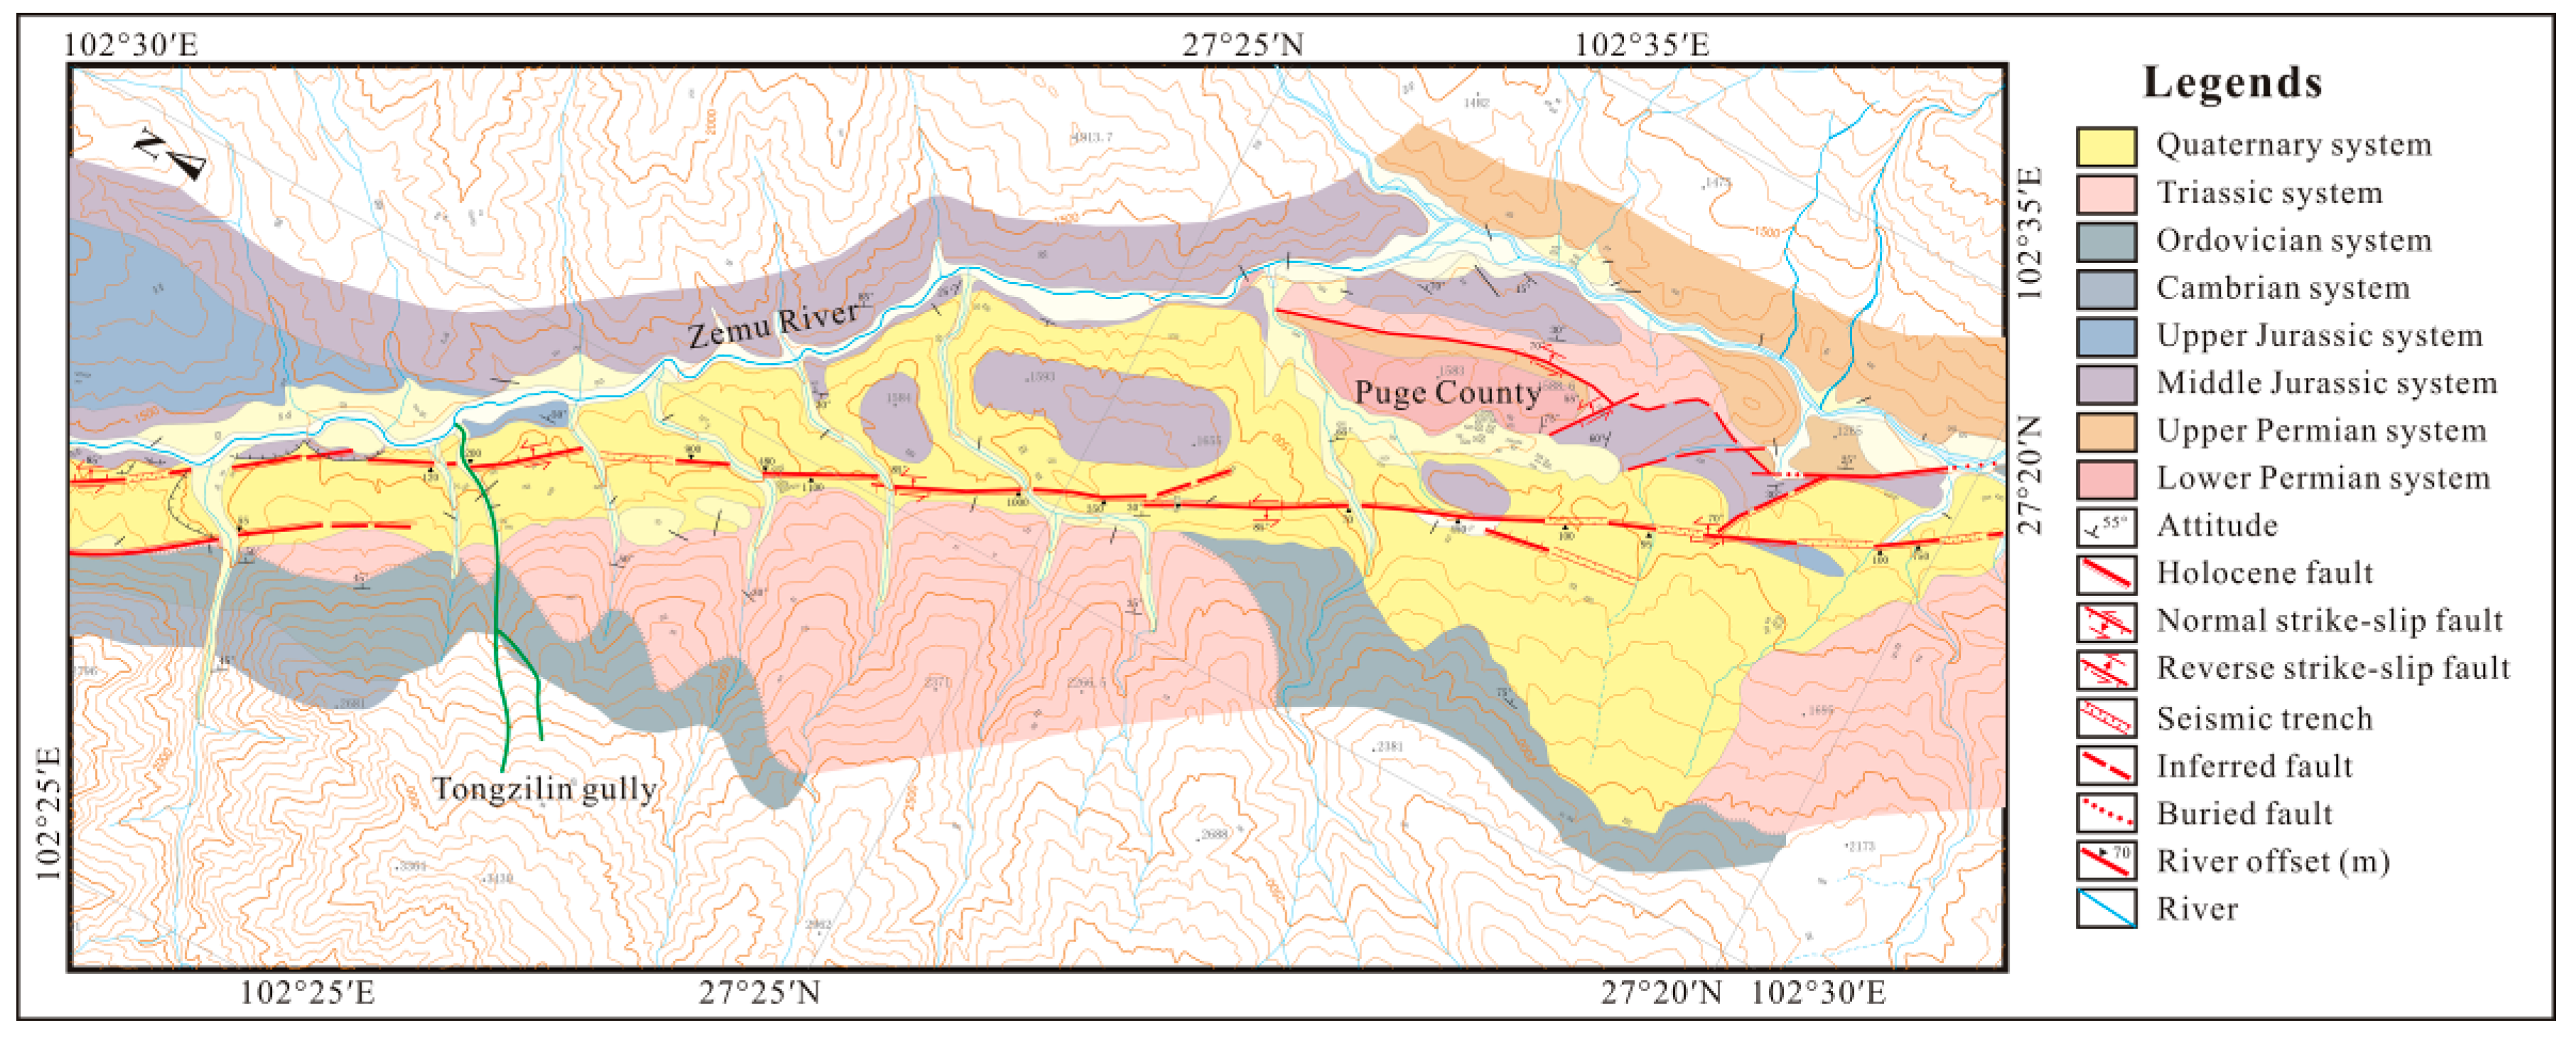
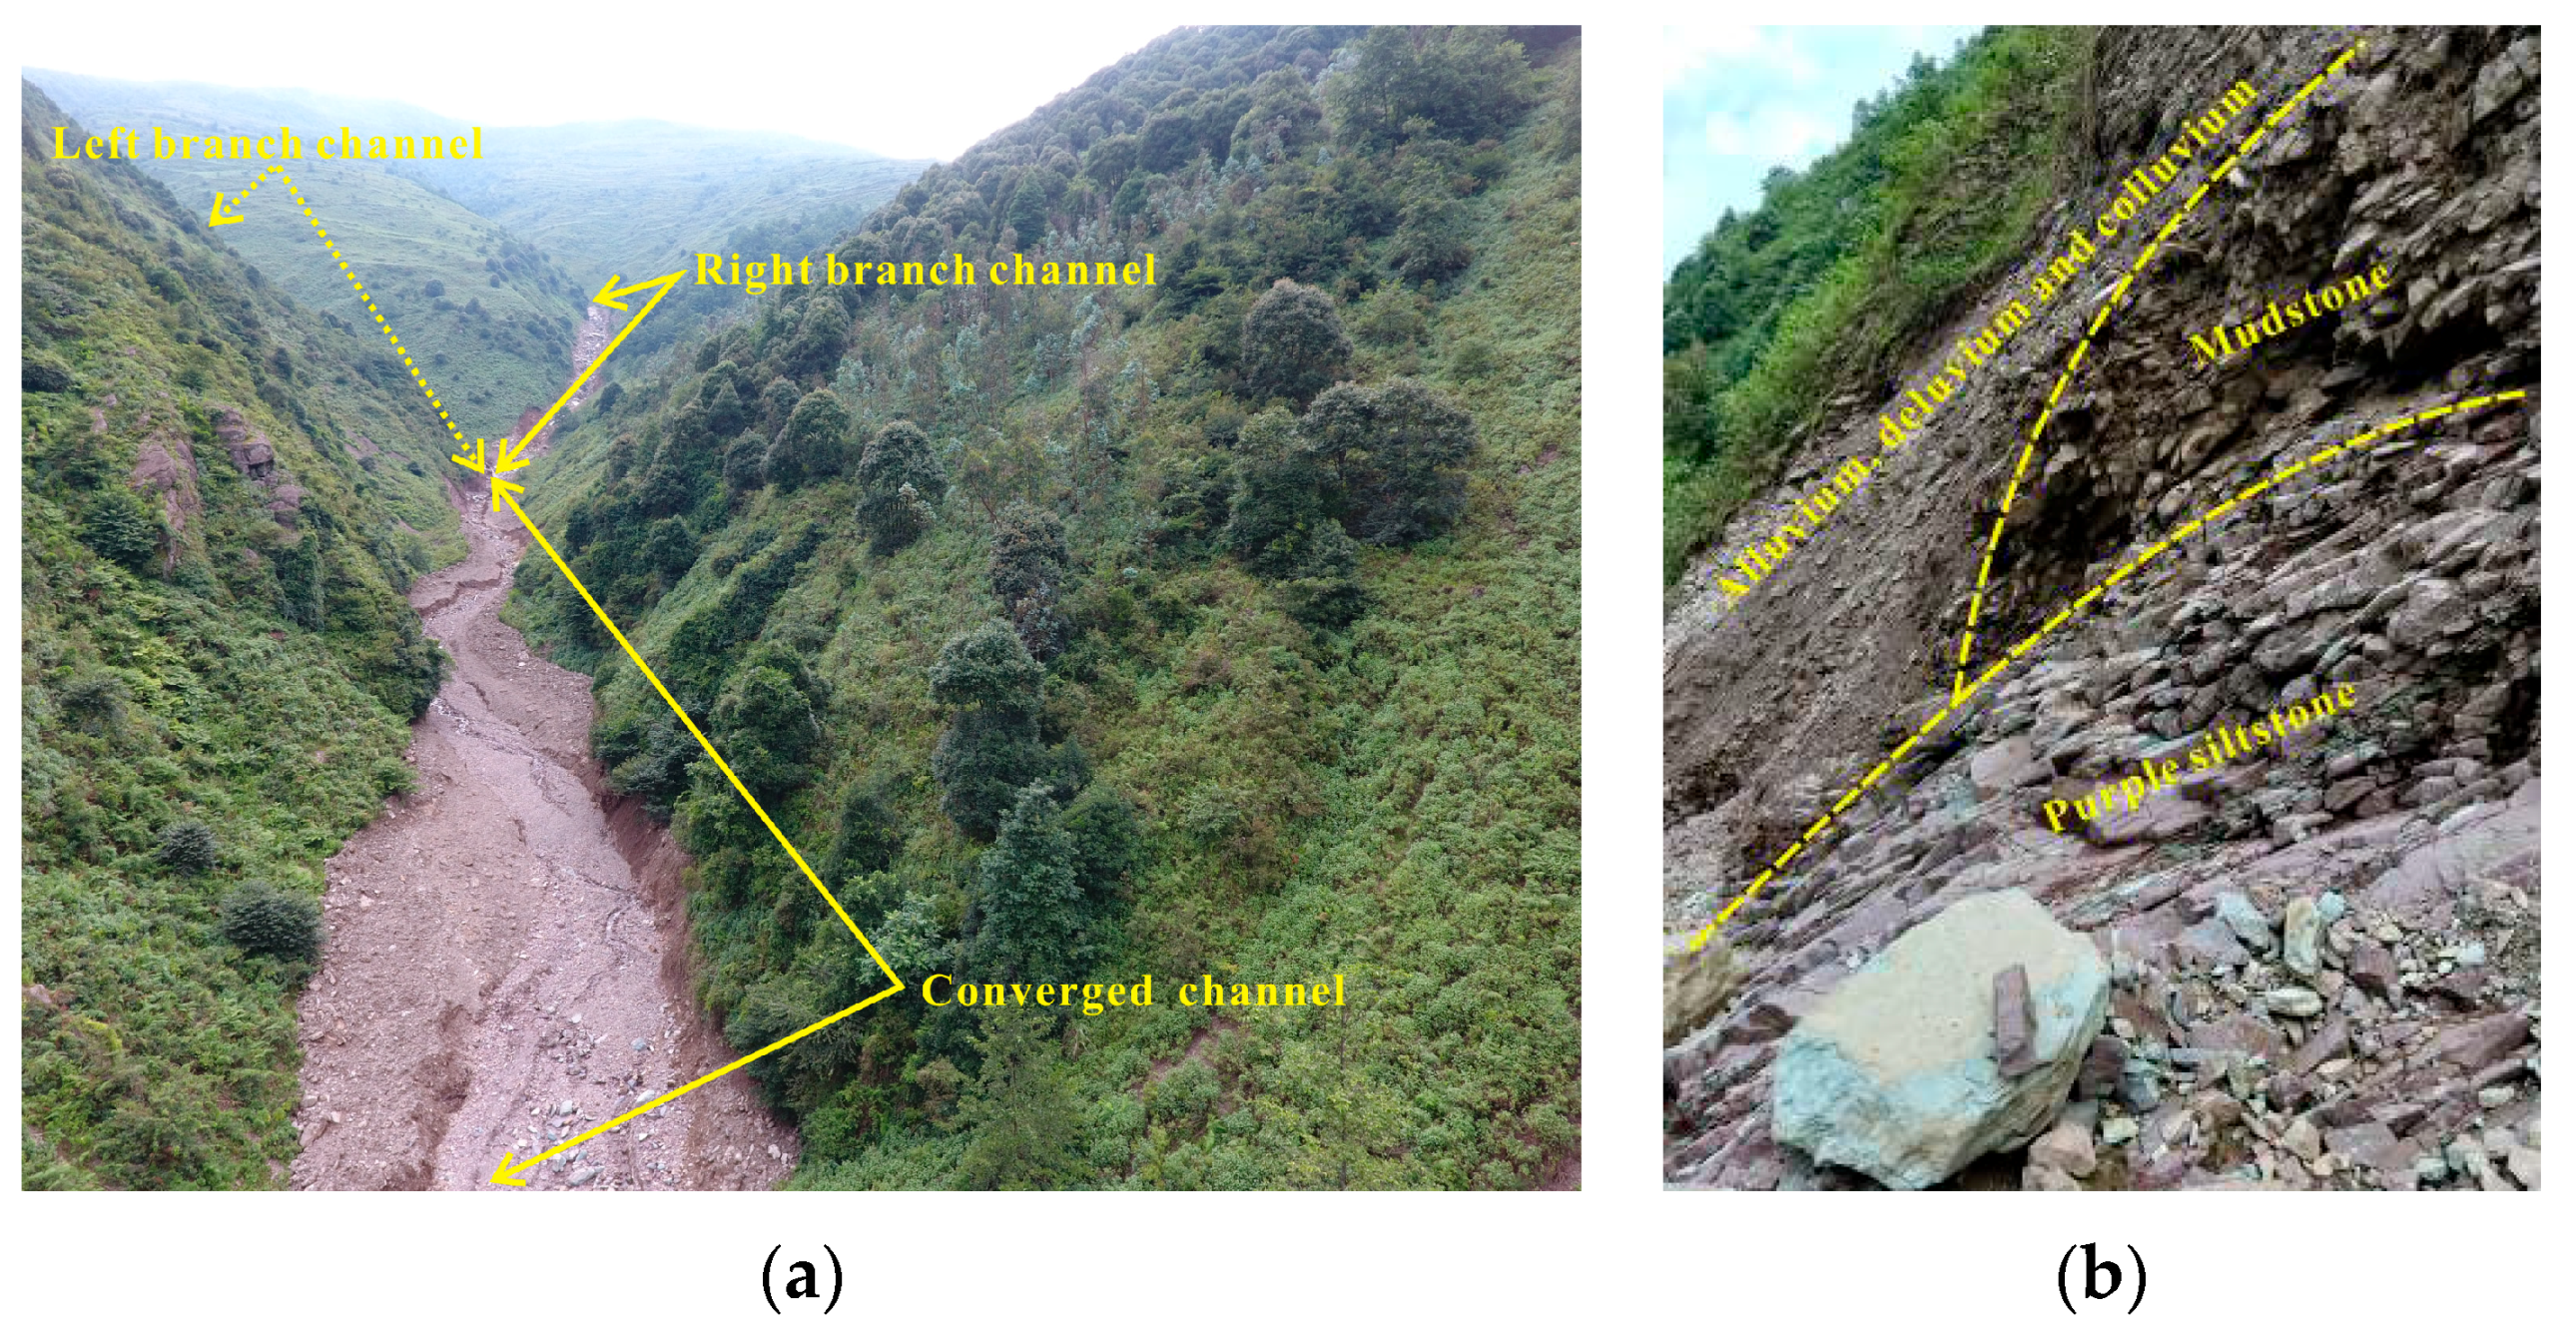
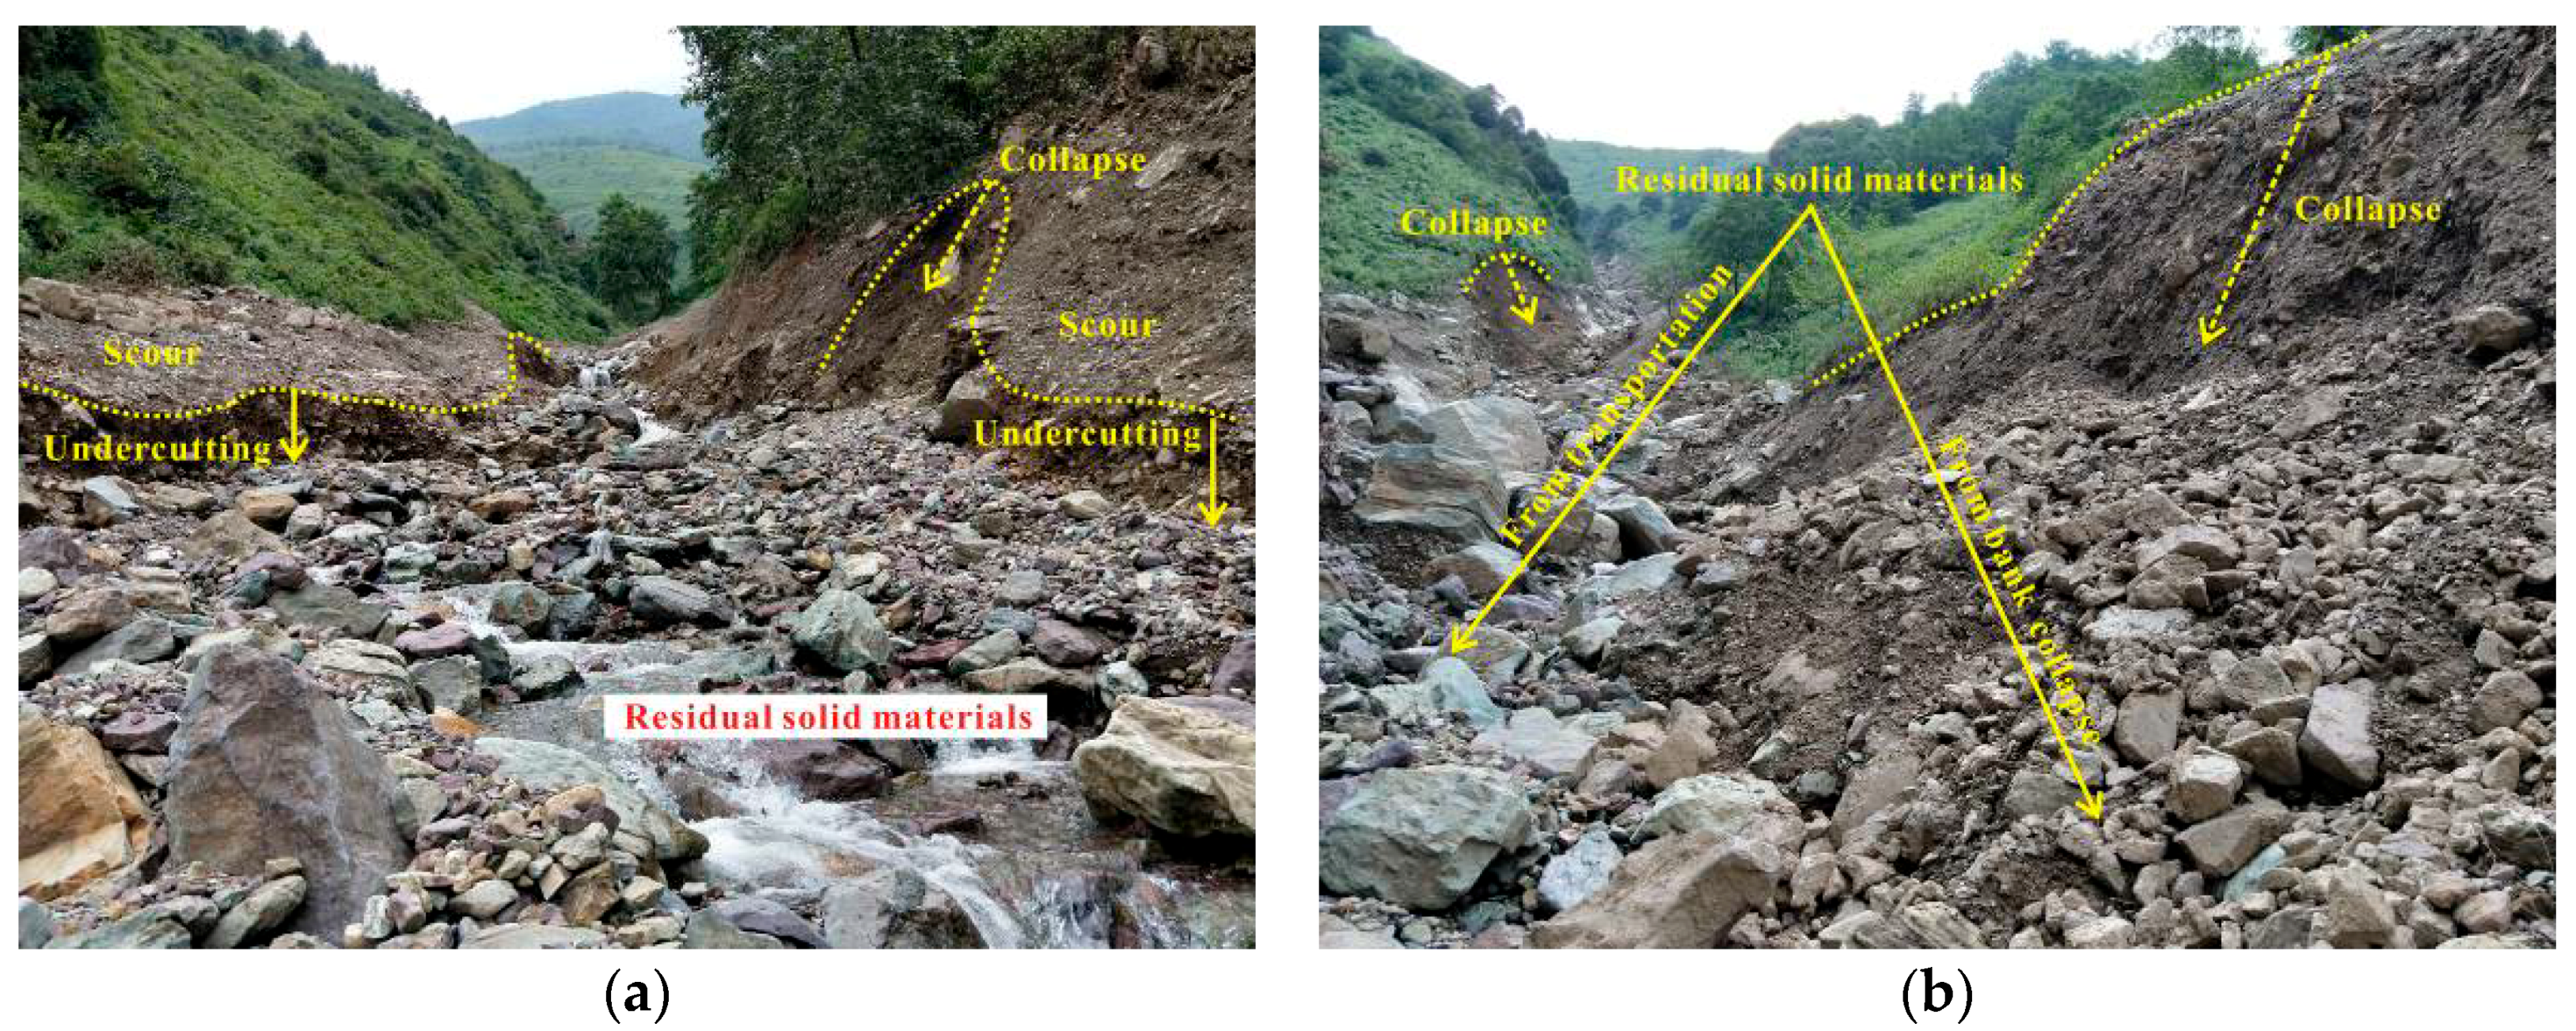
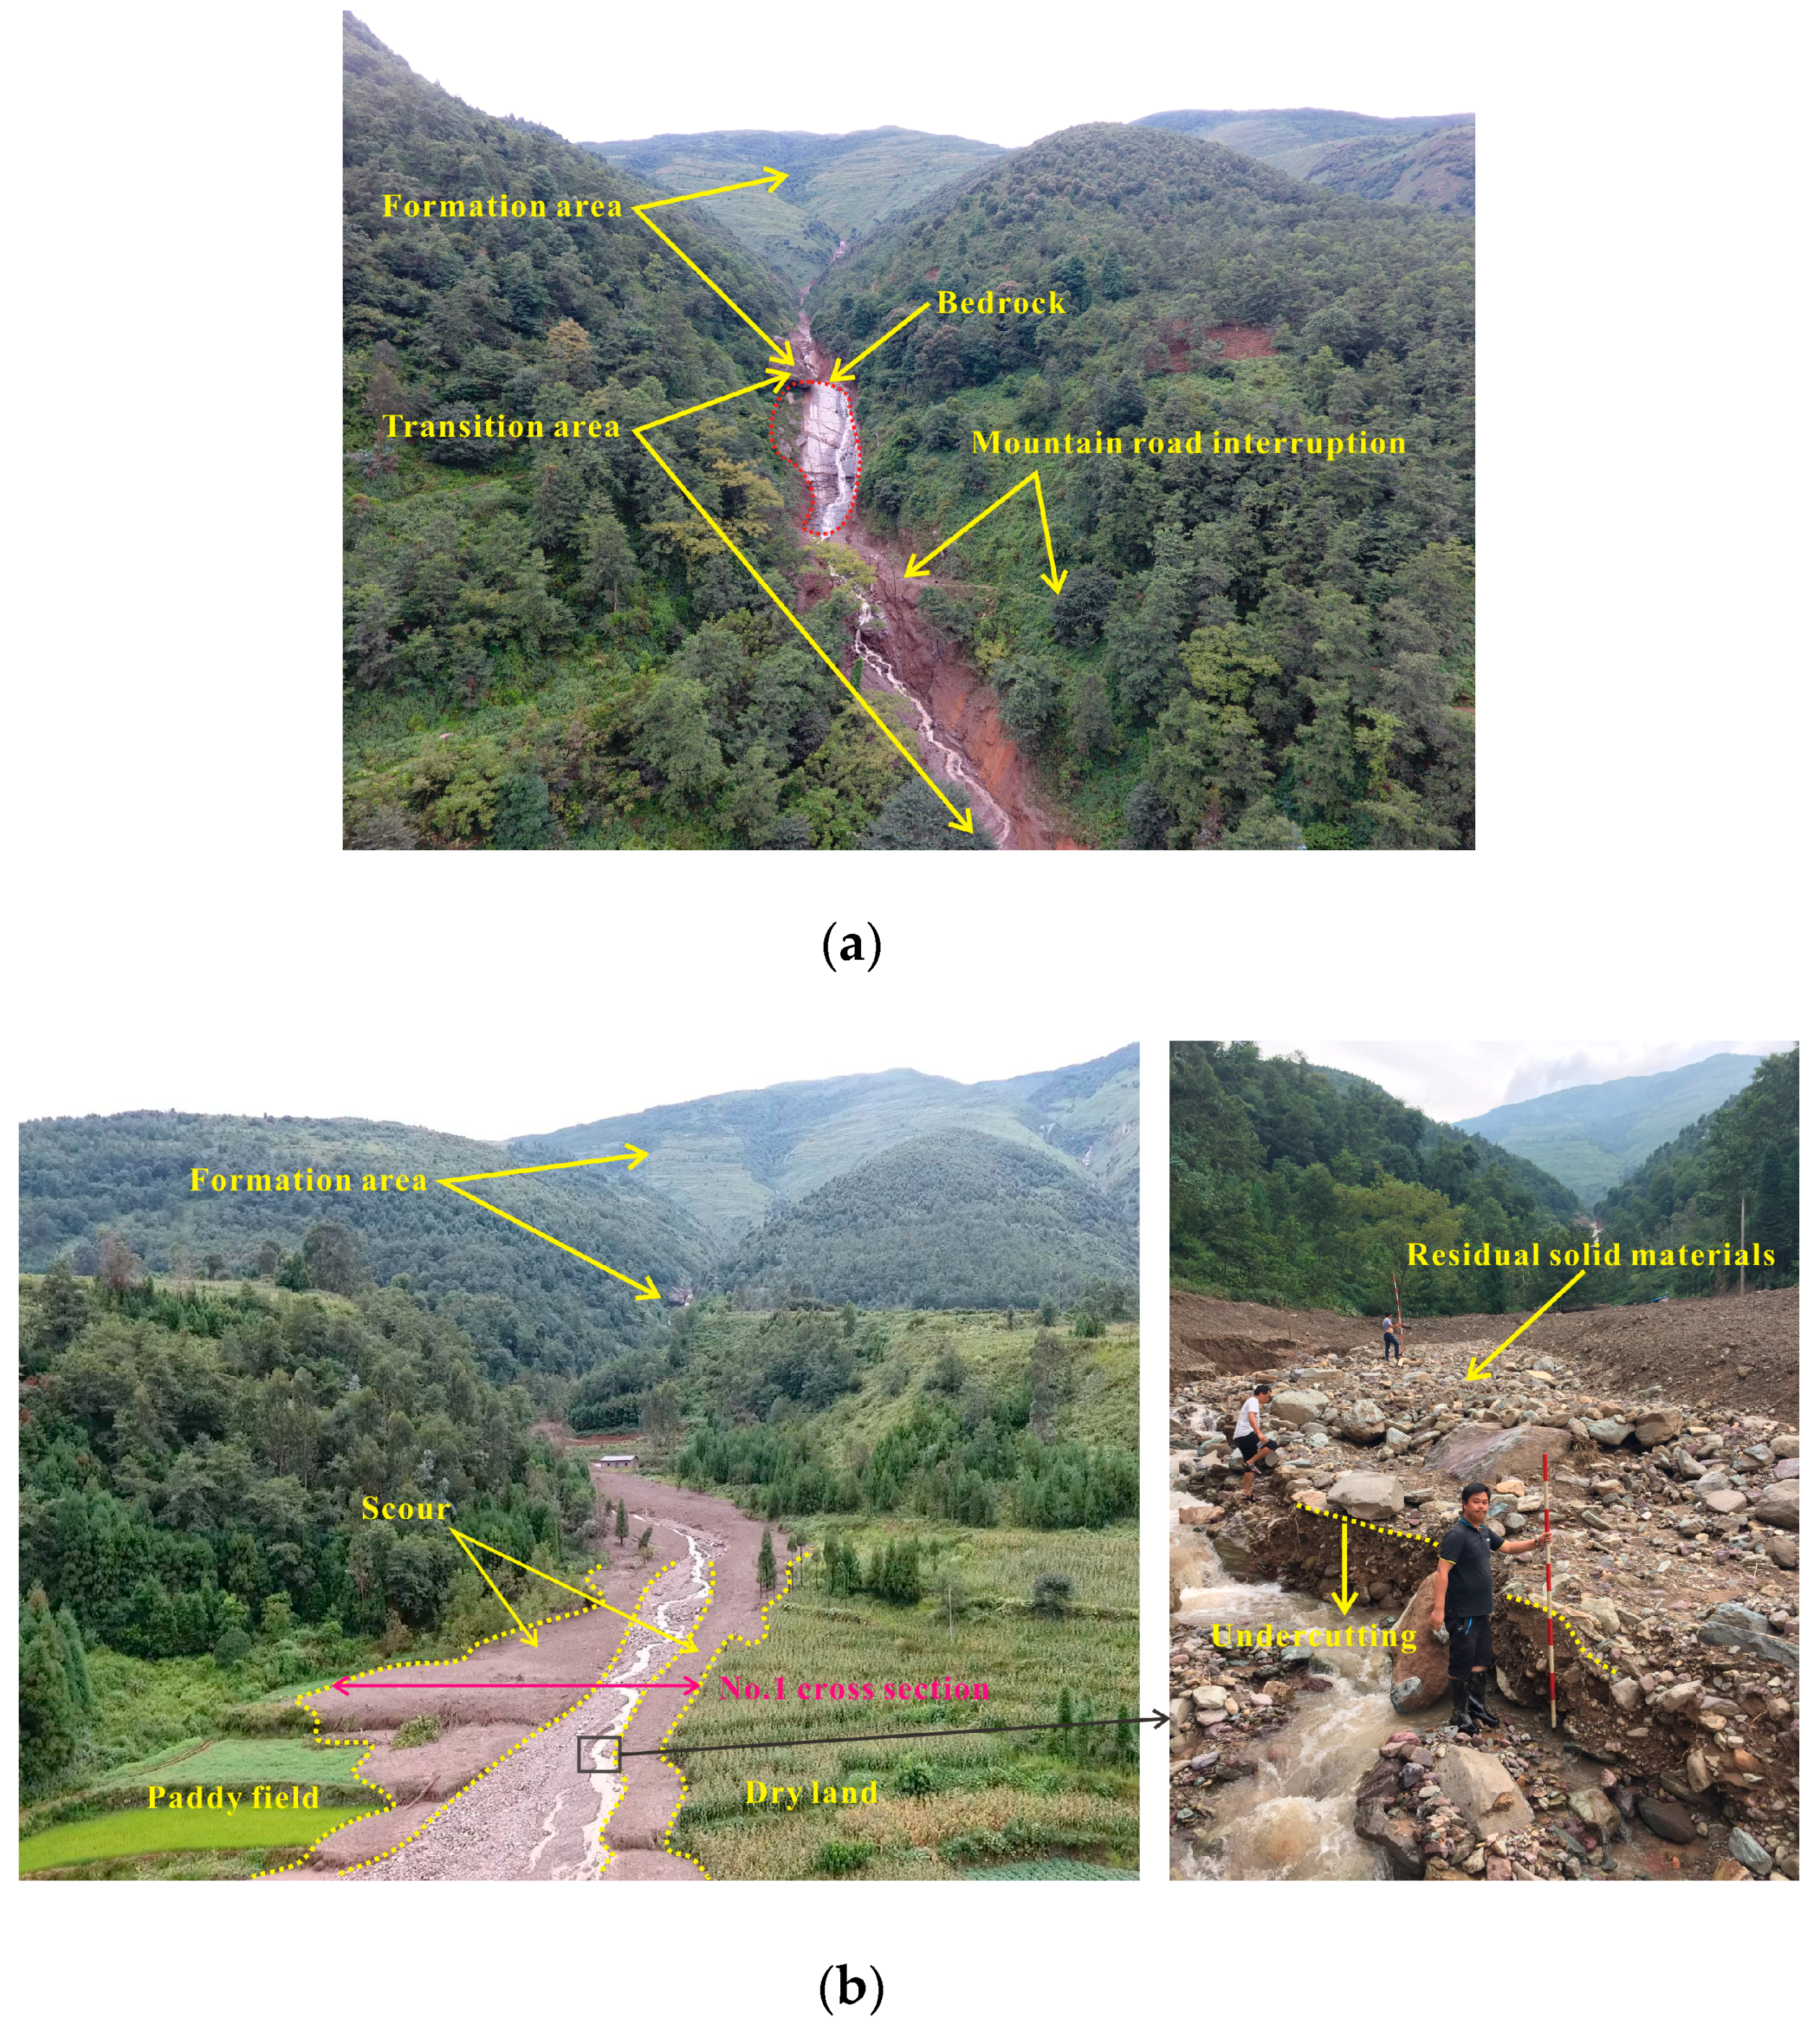
2. Description of the Debris Flow Erosion Process Observed in the Tongzilin Gully

The study area belongs to the Hengduan Mountain range that runs east-west in the Yunnan-Guizhou Platea and is located on the east side of Luoji Mountain, approximately 17 km from Puge County (Figure 2). According to the data of the last three years (2014–2017) from meteorological stations around the study area, the annual average precipitation is 1716.9 mm with the majority being distributed over the period from May to September. In August, the mean monthly precipitation of the study area is 235 mm and the maximum daily precipitation is 85.1 mm.
Emergency field investigations can help to understand the dynamic process and movement mechanism. Immediately after the debris flow, an investigation team visited the site and collected geological information. As shown in Table 1, the Tongzilin Gully has a channel length of approximately 5.5 km and a catchment area of approximately 3.7 km2 with significant topographical variation. The study area elevation over 1650 m is characterized by erosional landforms with a maximum elevation of 3430 m, an elevation difference of 1780 m, a longitudinal gradient of 476‰ and a slope gradient of 40°–60°. The section below (from the elevation of 1650 m to the gully bottom) is characterized by erosion and denudation landforms with an elevation difference of 258 m, a longitudinal gradient of 147‰ and a slope gradient of 15°–20°. To better describe the characteristics of the debris flow, the study area is divided into three regions from top to bottom: (1) the formation area (the elevation over the steep cliff); (2) the transition area (from the steep cliff to the township road with arch culvert); and (3) the inundated or runout area (from the township road to the Zemu River).
Two branch catchment channels occur in the formation area before convergence, of which the flow directions of the catchment channels are N21°E and N73°E, respectively. After the convergence, the flow direction of the catchment channel turns out to be N61°E. Little attention was paid to the catchment channel with a flow direction of N21°E in the formation area and the part with a distance over 400 m from the convergence in the catchment channel with a flow direction of N73°E due to the difficulties raised by the steepness. The right channel in the formation area is characterized by an irregular topography transforming from a V-shape to a U-shape with a bed width ranging between 5 and 12 m. As shown in Figure 3, the slope gradient of channel banks of the Tongzilin gully is approximately 25°–35°. The slope is mainly covered by Quaternary alluvium, deluvium and colluvium, with several bedrocks exposed locally in steep slopes and cliffs. The bedrock is characterized by purple siltstone and mudstone with a dip angle of approximately 40°. Because of the influence of fault activities, the rock mass is broken with abundant joints and fractures. As shown in Figure 4, the slope surfaces of both the channel banks have a sharply scoured topography, with the loss of vegetation cover. The toes of the banks have been incised and eroded with an undercutting depth of 1–6 m. A number of outcrops are characterized by rocks wrapped in sediment and a few plant roots on the undercutting surface. A significant amount of residual materials were retained in the gully channel, most of which are washed rocks characterized by siltstone (purple, grayish green and grayish yellow). These rocks were transported by the debris flow from places with higher elevations.
The local side edges are covered by several rocks in the gully bed that are wrapped in sediments and originated from the collapse of the bank slope. The residual crushed rocks in the gully channel vary in size, mainly from 0.05 m to 0.15 m, and a few large stones vary from 1.0–2.5 m.
The transition area flows on a steep cliff and a gentler slope. As shown in Figure 5a, a large bulk of bedrock was exposed at the top region of the steep cliff. The altitude difference of the steep cliff is approximately 200 m. In the steep cliff, the scale amplification of the debris flow occurred due to the erosion of the accumulated deposits in the gully channel and its movement also accelerated substantially because of the large altitude difference which led to a change of morphological characteristics similar to that in the formation area. During the flows, the debris interrupted the mountain road below the exposed bedrock and destructed the roadbed at the junction of the steep cliff and gentle slope. Because of the hydraulic erosion on the sediment bed, the surface runoff took away loose solid material and the shallow surface of accumulated deposits and gradually turned into a debris flow [9,48,49]. Field surveys on the surface geomorphology after the debris flow event show that a layer of mud sediment was left and accumulated on the scoured surface on both sides. Three cross-sections are selected from downstream to upstream for the measurement of morphological characteristics (Table 2). Because of the great erosive energy caused by a large slope gradient, both channel banks were eroded and incised with an undercutting depth of approximately 1 m. This is particularly evident at the location near the corner where the sediment deposits have a larger covering width. In the channel and its neighboring area, broken stones of different sizes are left on the earthen surface by transportation from higher places.
Two roads cross the channel in the inundated or runout area at elevations of 1505 m and 1420 m, respectively. The township road was constructed in 2015 at an elevation of 1505 m. In addition, a flat section of channel with a width of 8–10 m was formed because of excavation and an arch culvert was built up to discharge the surface runoff around the subgrade. The arch culvert has a width of 3.0 m, a sidewall height of 1.5 m and an arch height of 0.8 m (Figure 6). As shown in Figure 6, a large stone, with an approximate length of 4.7 m, a width of 2.0 m and a height of 1.7 m, was found when cleaning the culvert after the events. The giant stone that was transported by debris flow blocked the culvert with the expansion of the inundated or runout area by accumulating solid material at the entrance of the arch culvert, further causing discharge diversion because of the burst after blockage.
After rapidly changing the flow direction, the debris flow spread and inundated the #2 and #3 residential quarters, causing 18 deaths and the destruction of houses. The sediment deposits silted up in front of the buildings had a covering height of approximately 3–4 m. A small portion of the debris flow ran through the culvert or over the road surface and continued to run along the original channel. The village road was constructed in 2014 at an elevation of 1420 m. A rectangular culvert had a height of 1.5 m and a width of 2.6 m where the original channel has a bend with a turning angle of approximately 60°. As shown in Figure 7, when running through this area, the debris flow carried large block stones, occluding the rectangular culvert and further causing the second discharge diversion. A flow ran along the original channel into the Zemu River and the other flow rushed straight down to the residential quarters along the village road killing seven people and covering the buildings with sediments. Eventually, the two flows entered the Zemu River and turned into two piles of sediments and blocked the river channel with a shape of a circular sector in a view of a vertical angle.

3. Formation and Evolution Mechanisms

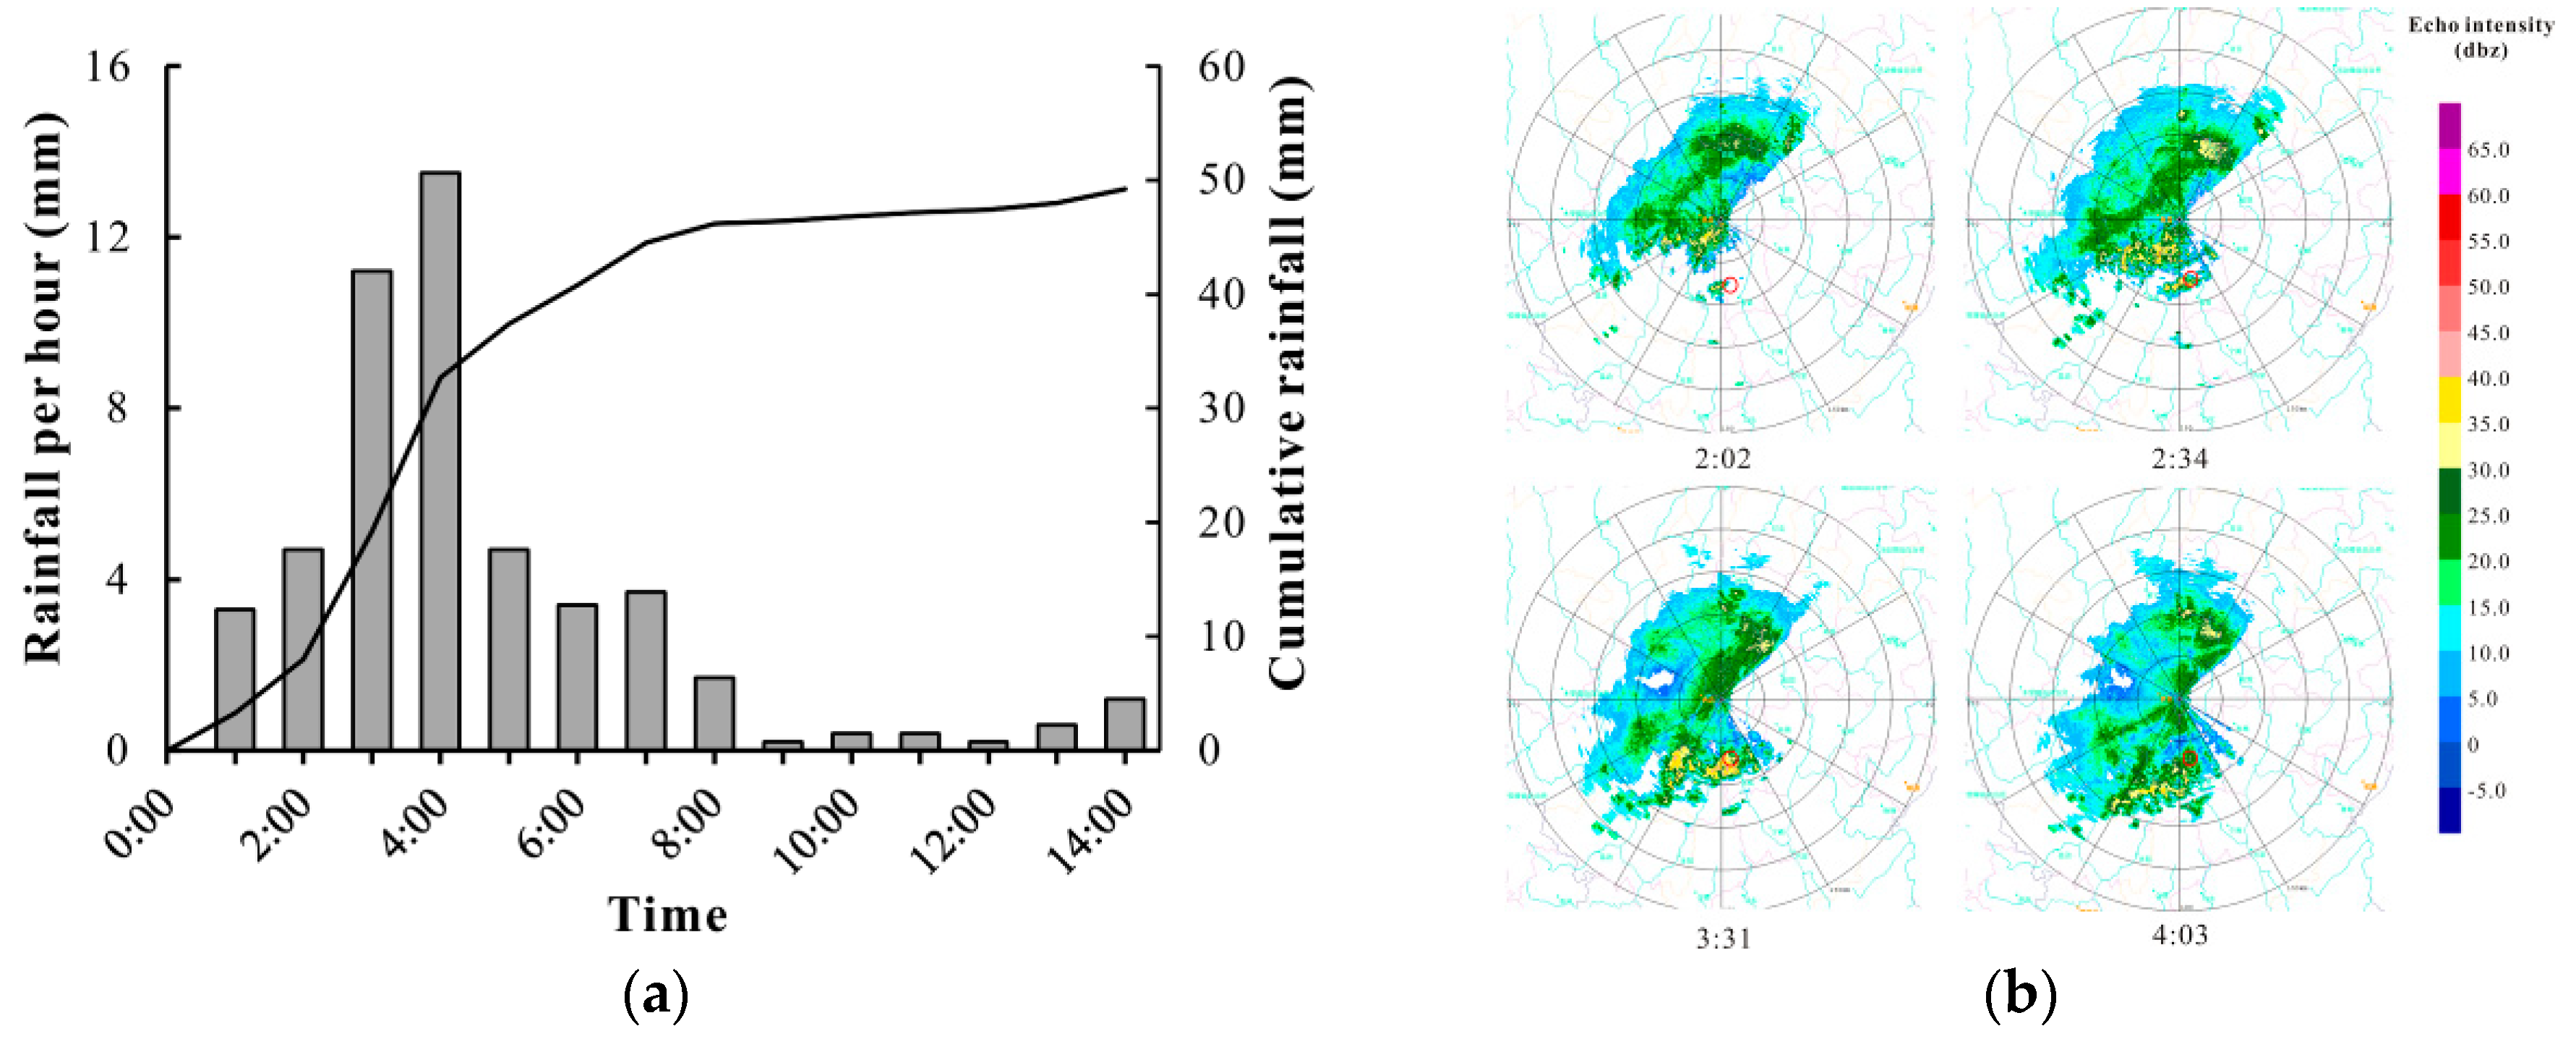
3.1. Meteorological Analyses

The closest meteorological station is located at the northwest of the study area and the distance is about 1.2 km from the study area. Rainfall data are shown at hourly intervals in Figure 8a, together with the cumulative rainfall. Rainfall intensity progressively increased and reached a maximum value of 13.5 mm/h between 3:00 and 4:00 a.m. and decreased thereafter.
The study area was completely covered by a Doppler weather radar which is located at Xichang city and can cover an area with a radius of 150 km. The radar location is approximately 47 km away from the study area and the scan elevation of the reflectivity factor is 2.4°. As shown in Figure 8b, at approximately 2:02 a.m., a small part of local convection with a peak echo intensity of 30 dBz (unit of radar reflection factor) was observed in the northwest of the study area. Then, at approximately 2:34 a.m., the peak of the echo intensity was observed in correspondence with regions located southwards and the peak echo intensity was increased. At approximately 3:31 a.m., the main echo was observed in the immediate vicinity of the study area; combined with local convection, it caused the initiation of sustained precipitation. In this moment, the peak echo intensity (reaching 40 dBz) was located in the study area. After 4:03 a.m., the echo intensity in the study area decreased, however the peak intensity of the main echo was still 30 dBz. After that, the peak echo intensity in the study area weakened.
According to the dynamic analysis of the Doppler weather radar, the occurrence time of the debris flow was estimated to fall between 3:30 a.m. and 4:00 a.m. In the previous hazards, such as the Zhouqu, Wenjiagou and Yingxiu events, the cumulative precipitation before the hazard occurrences was not smaller than 100 mm [37,38,39]. As shown in Figure 8, the recorded cumulative precipitation in this event was only 49.2 mm, which is a relatively small value. The elevation difference of the basin in the Tongzinlin gully is approximately 2038 m and the basin areas above 2000 m are the regional high intensity rainfall zone without a meteorological station. The current meteorological station is located at an elevation of approximately 1400 m. Therefore, the measured value of precipitation is likely less than the real value in the middle and upper reaches of the basin area.

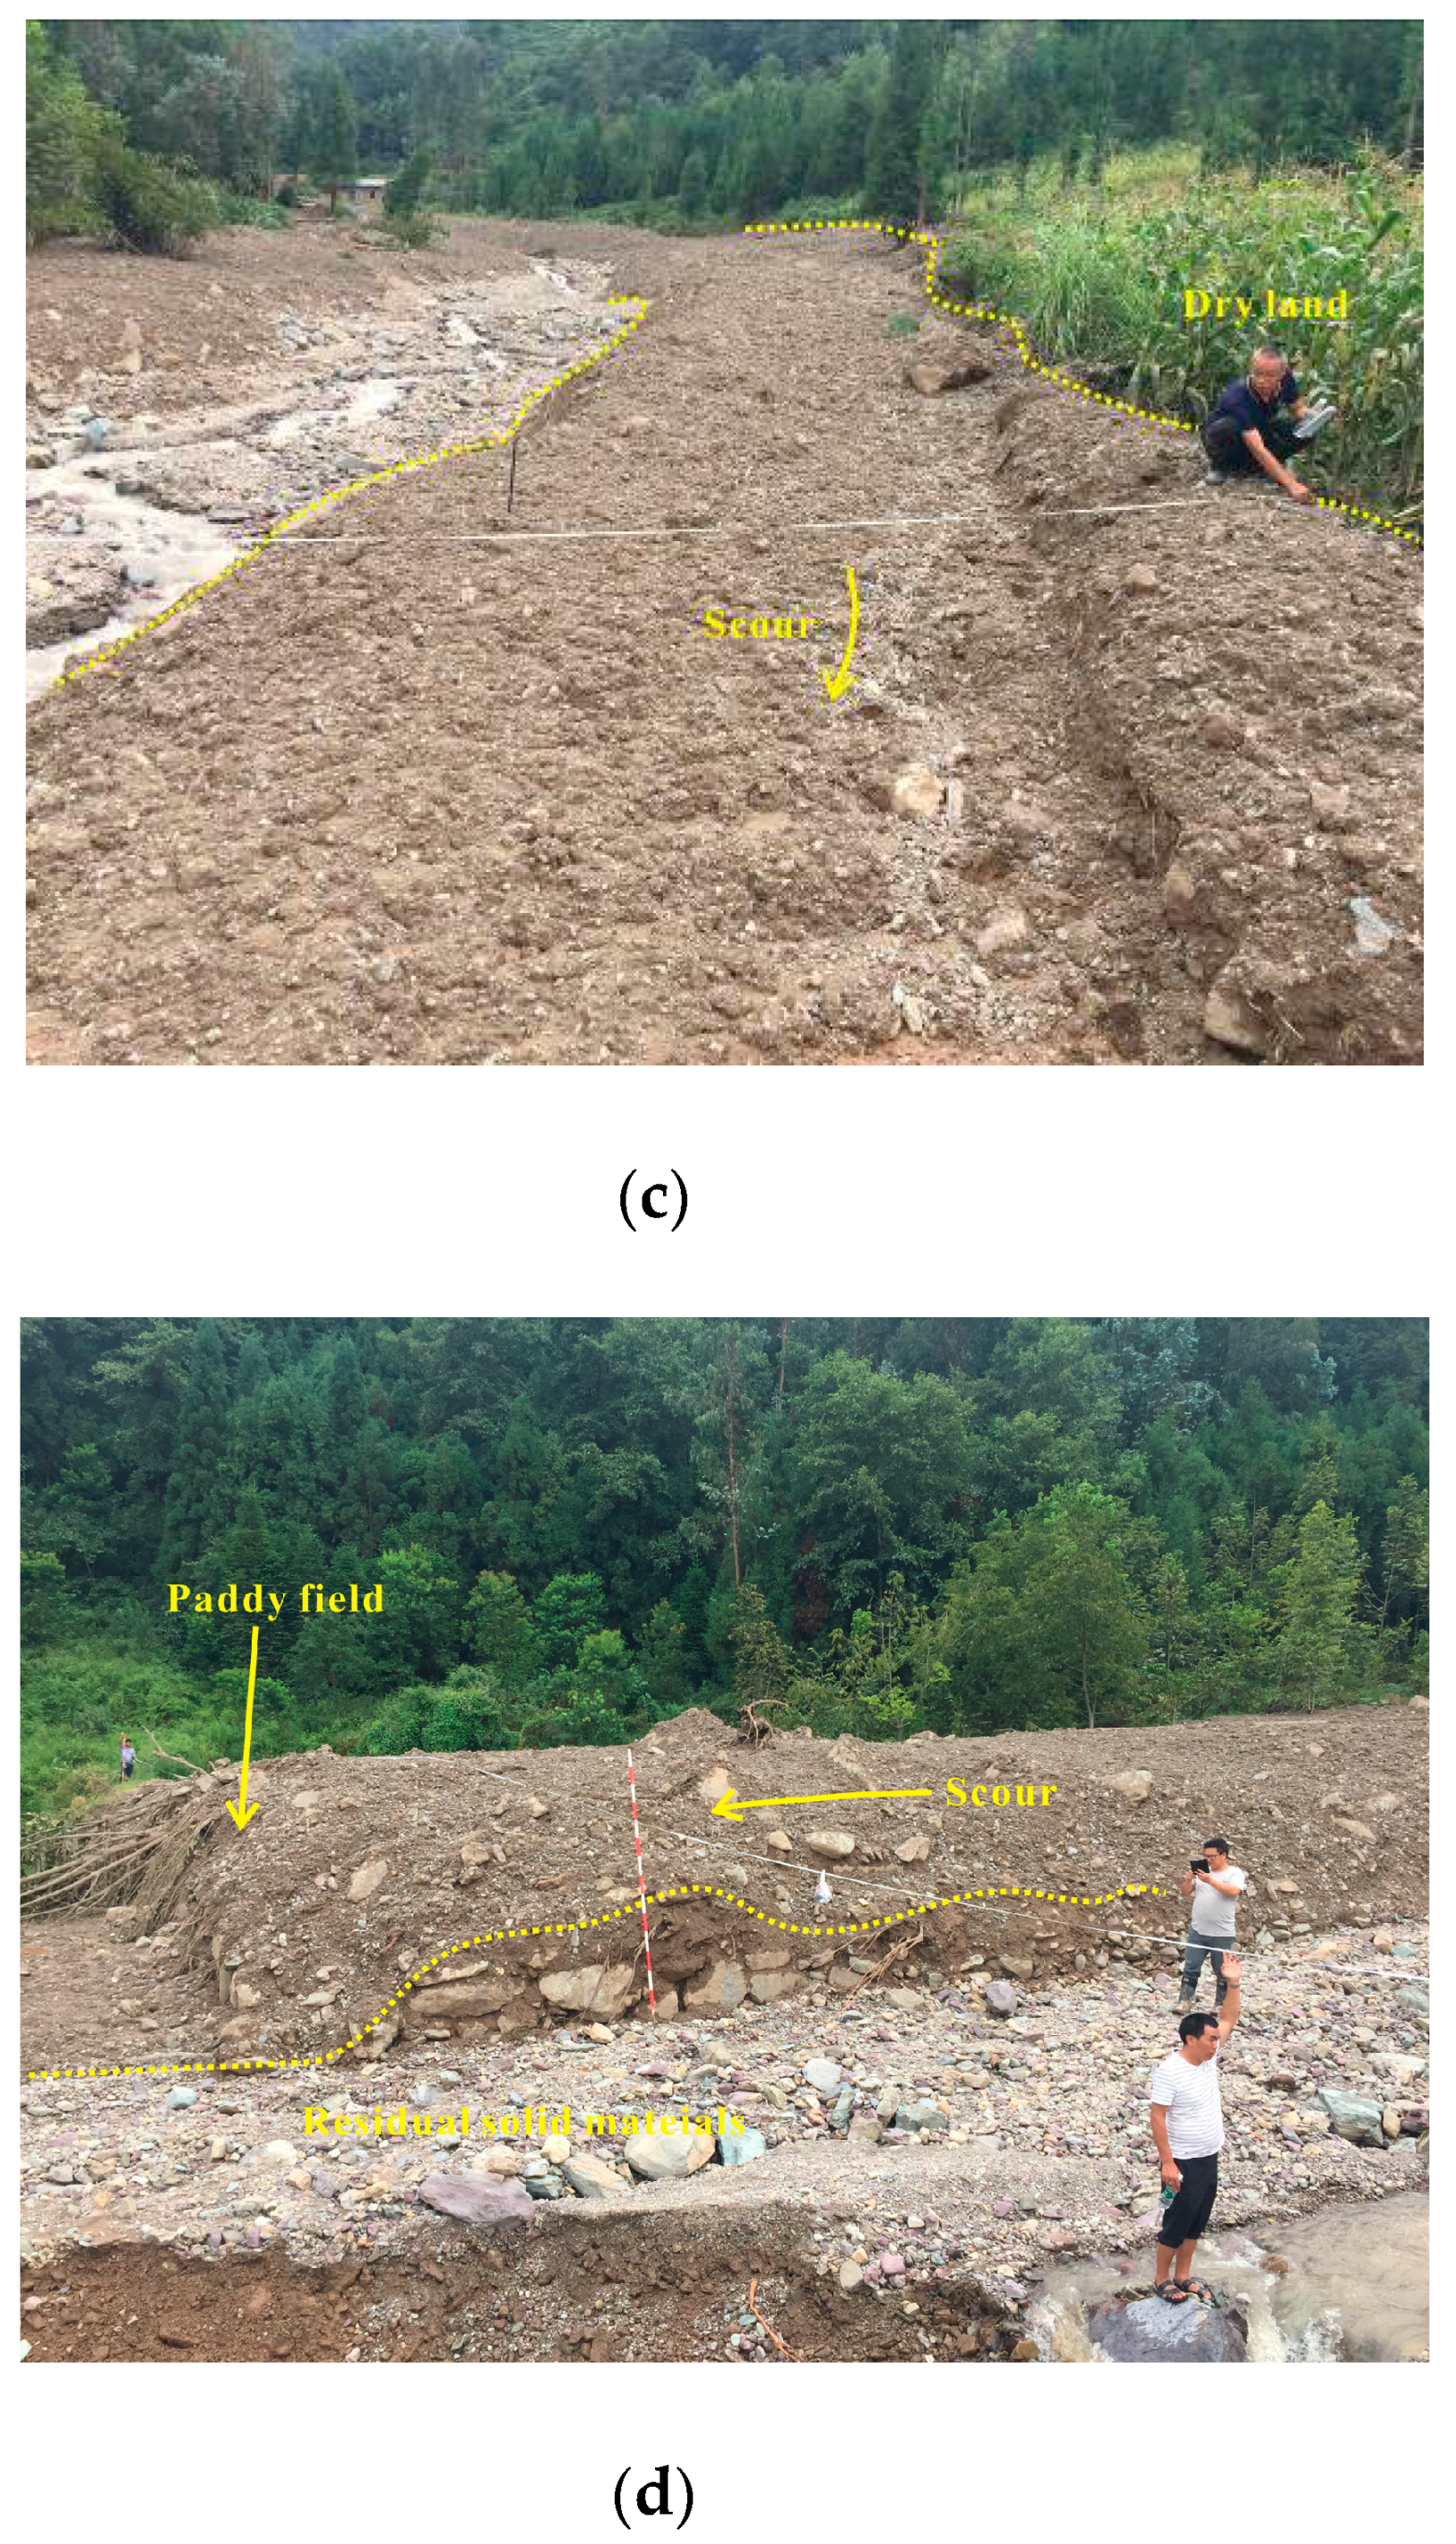
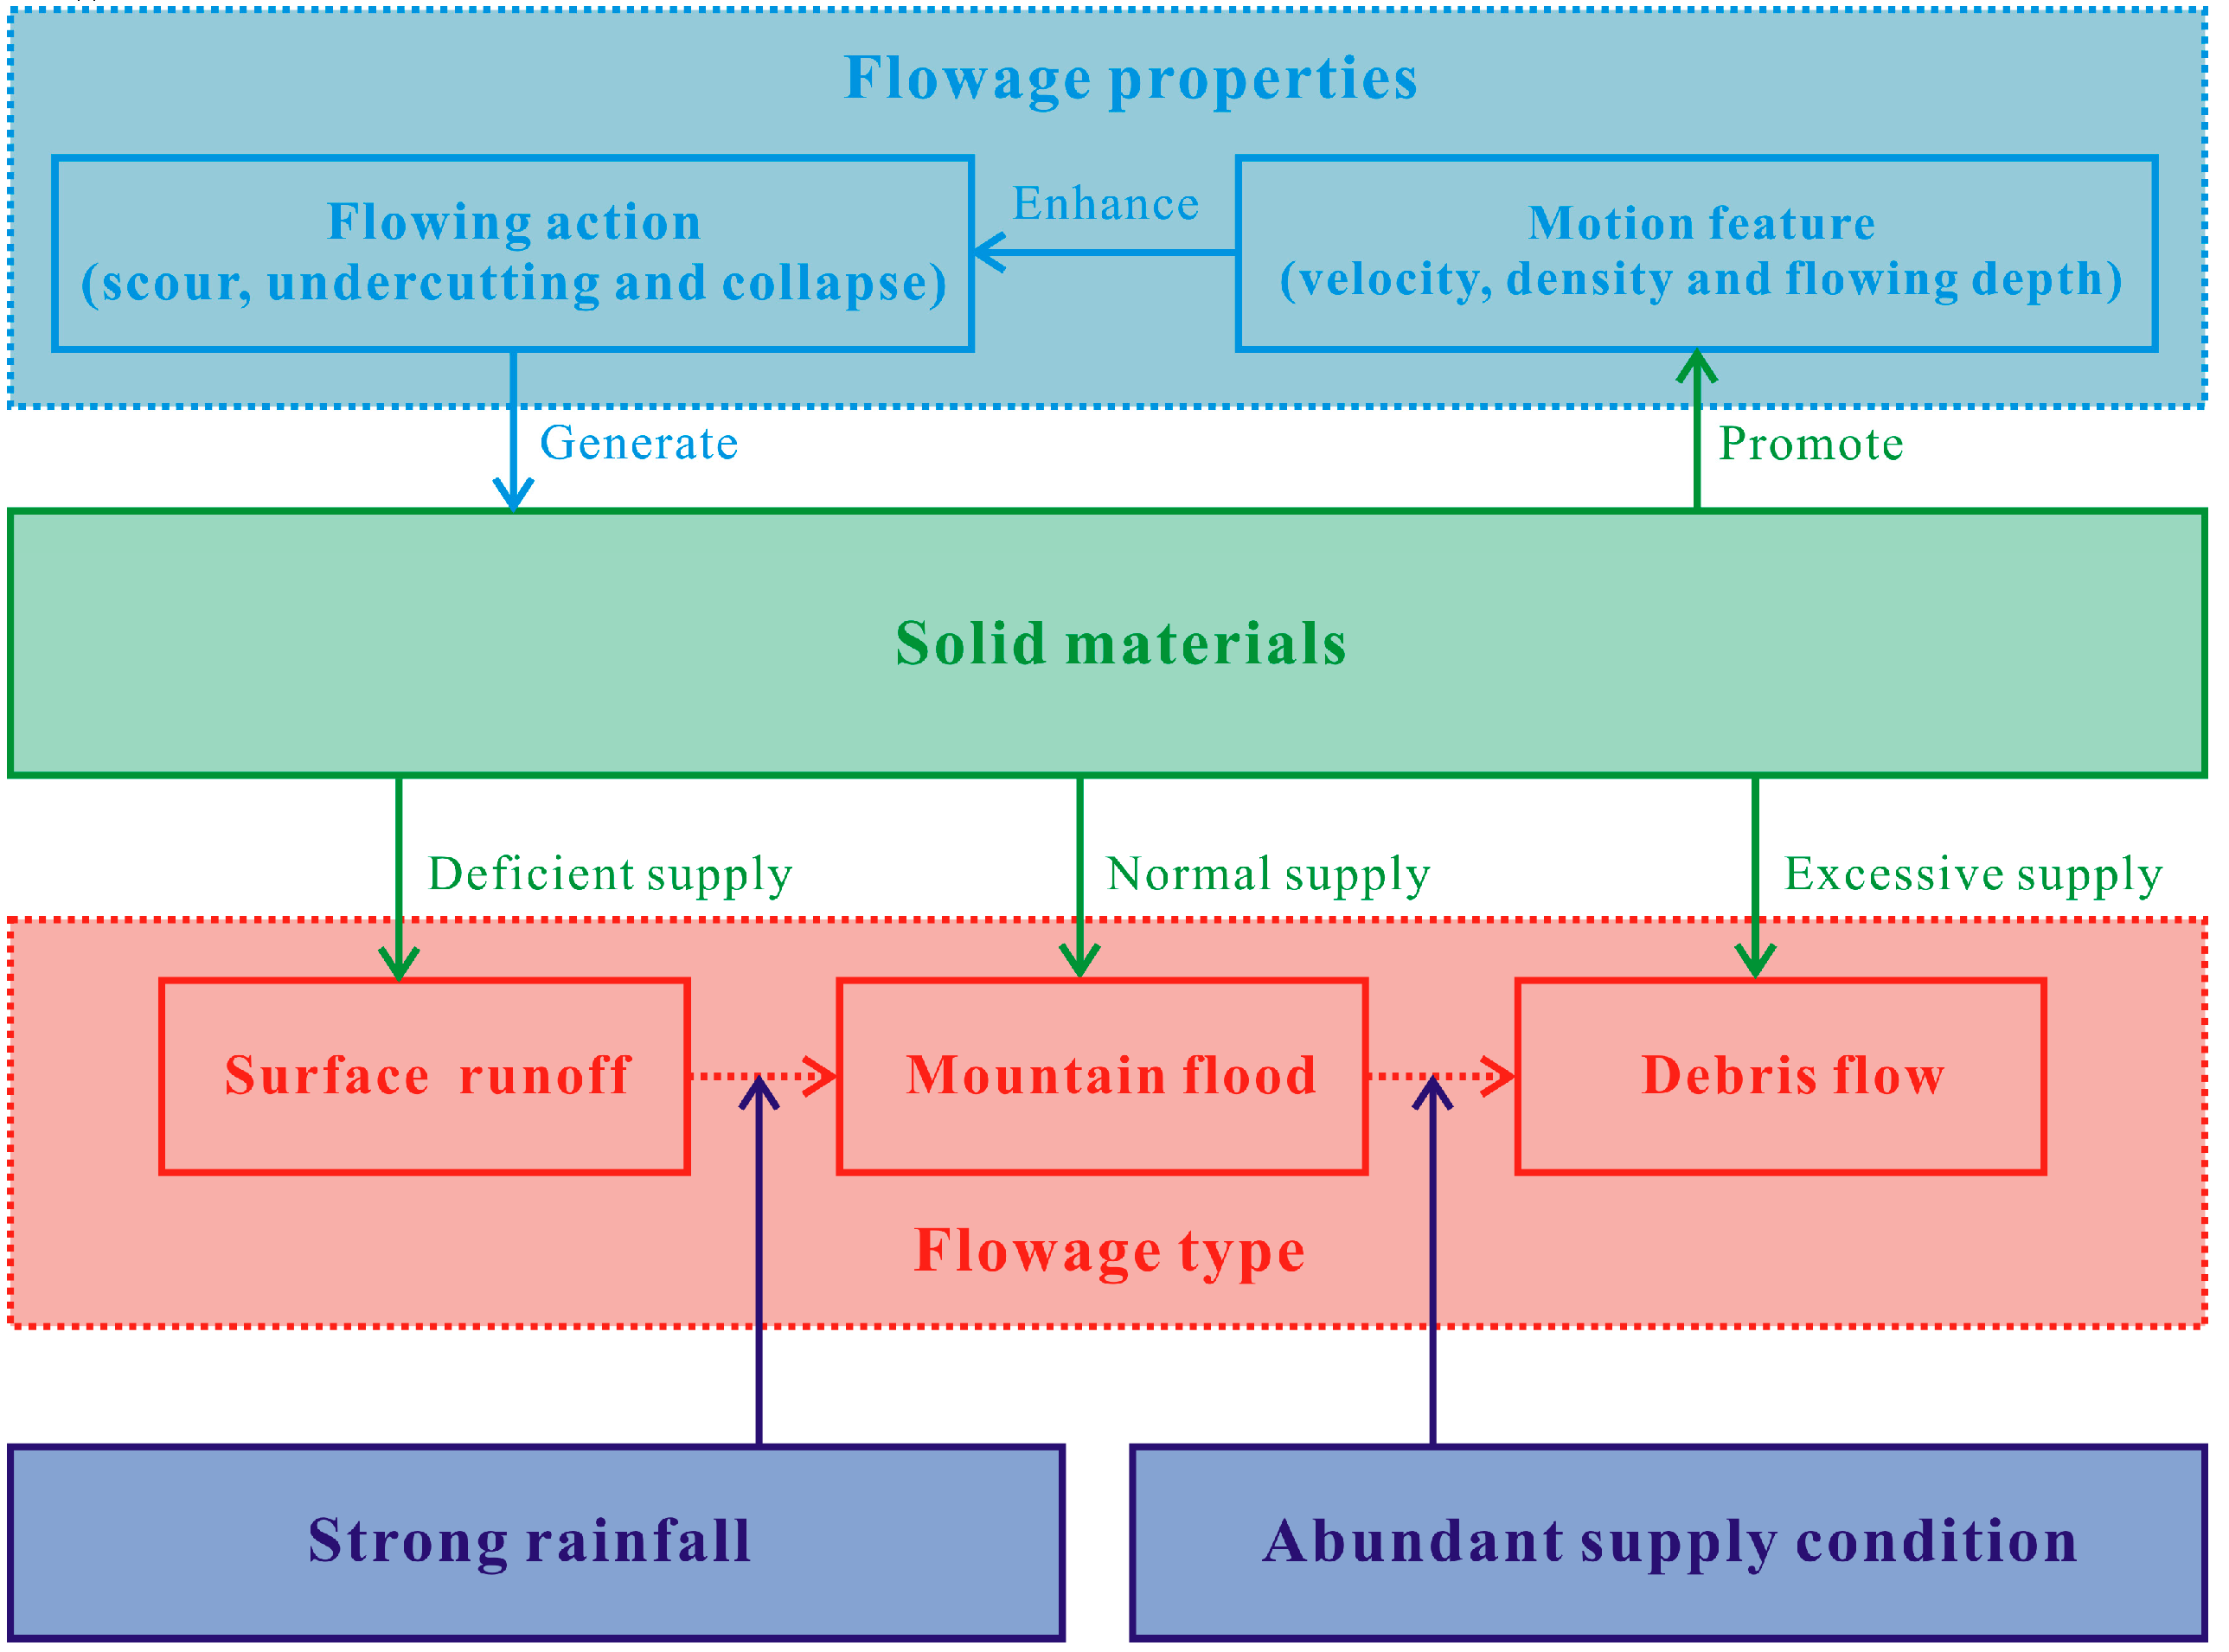
3.2. Formation Process and Excessive Supply of Solid Materials

The supply of solid material is a very important factor for the dynamic evolution of mountain hazards [20,25,27,28,41,48]. According to debris flow trace characteristics, the excessive supply, coming from accumulated deposits, granular solid materials and falling rocks in the Tongzilin gully, is found to be a significant factor for the continuous scale amplification of a runoff-generated debris flow during the formation and routing processes. Scouring, undercutting and causing collapse are major methods of obtaining supply from solid materials for runoff-generated debris flows. The formation area is characterized by the narrow breach width of the channel, the high steepness of two side channel banks and the large gradients of the slopes. These characteristics are supposed to be favorable to the generation and development of debris flow [15]. The sudden occurrence of strong surface runoff caused by high intensity rainfall have a great erosive power of runoff. Accumulated deposits in the toe region of the slope bank were distributed along the flow direction in the gully channel. Because of the great erosive energy, the toe region was scraped and eroded for the supplement to debris flow. Meanwhile, it has caused local slope failures and collapses in two sides of channel bank. These collapses produced many loose deposits, most of which were carried off by flow action; the rest were retained in the side edge of the gully bed. As shown in Figure 4 and Figure 5, the cascading scale amplification, caused by the excessive supply of solid materials in the formation and transition areas, increases the influencing range of the debris flow and eventually generates serious destruction in the inundated or runout area [31,32,34]. On the bed of the gully, some debris deposited during the debris flow routing is present. In conclusion, the excessive supply of solid material for debris flow played an important role in changing the morphological appearance, lithologic proportion of accumulated formation and discharge capacity of the Tongzilin gully.

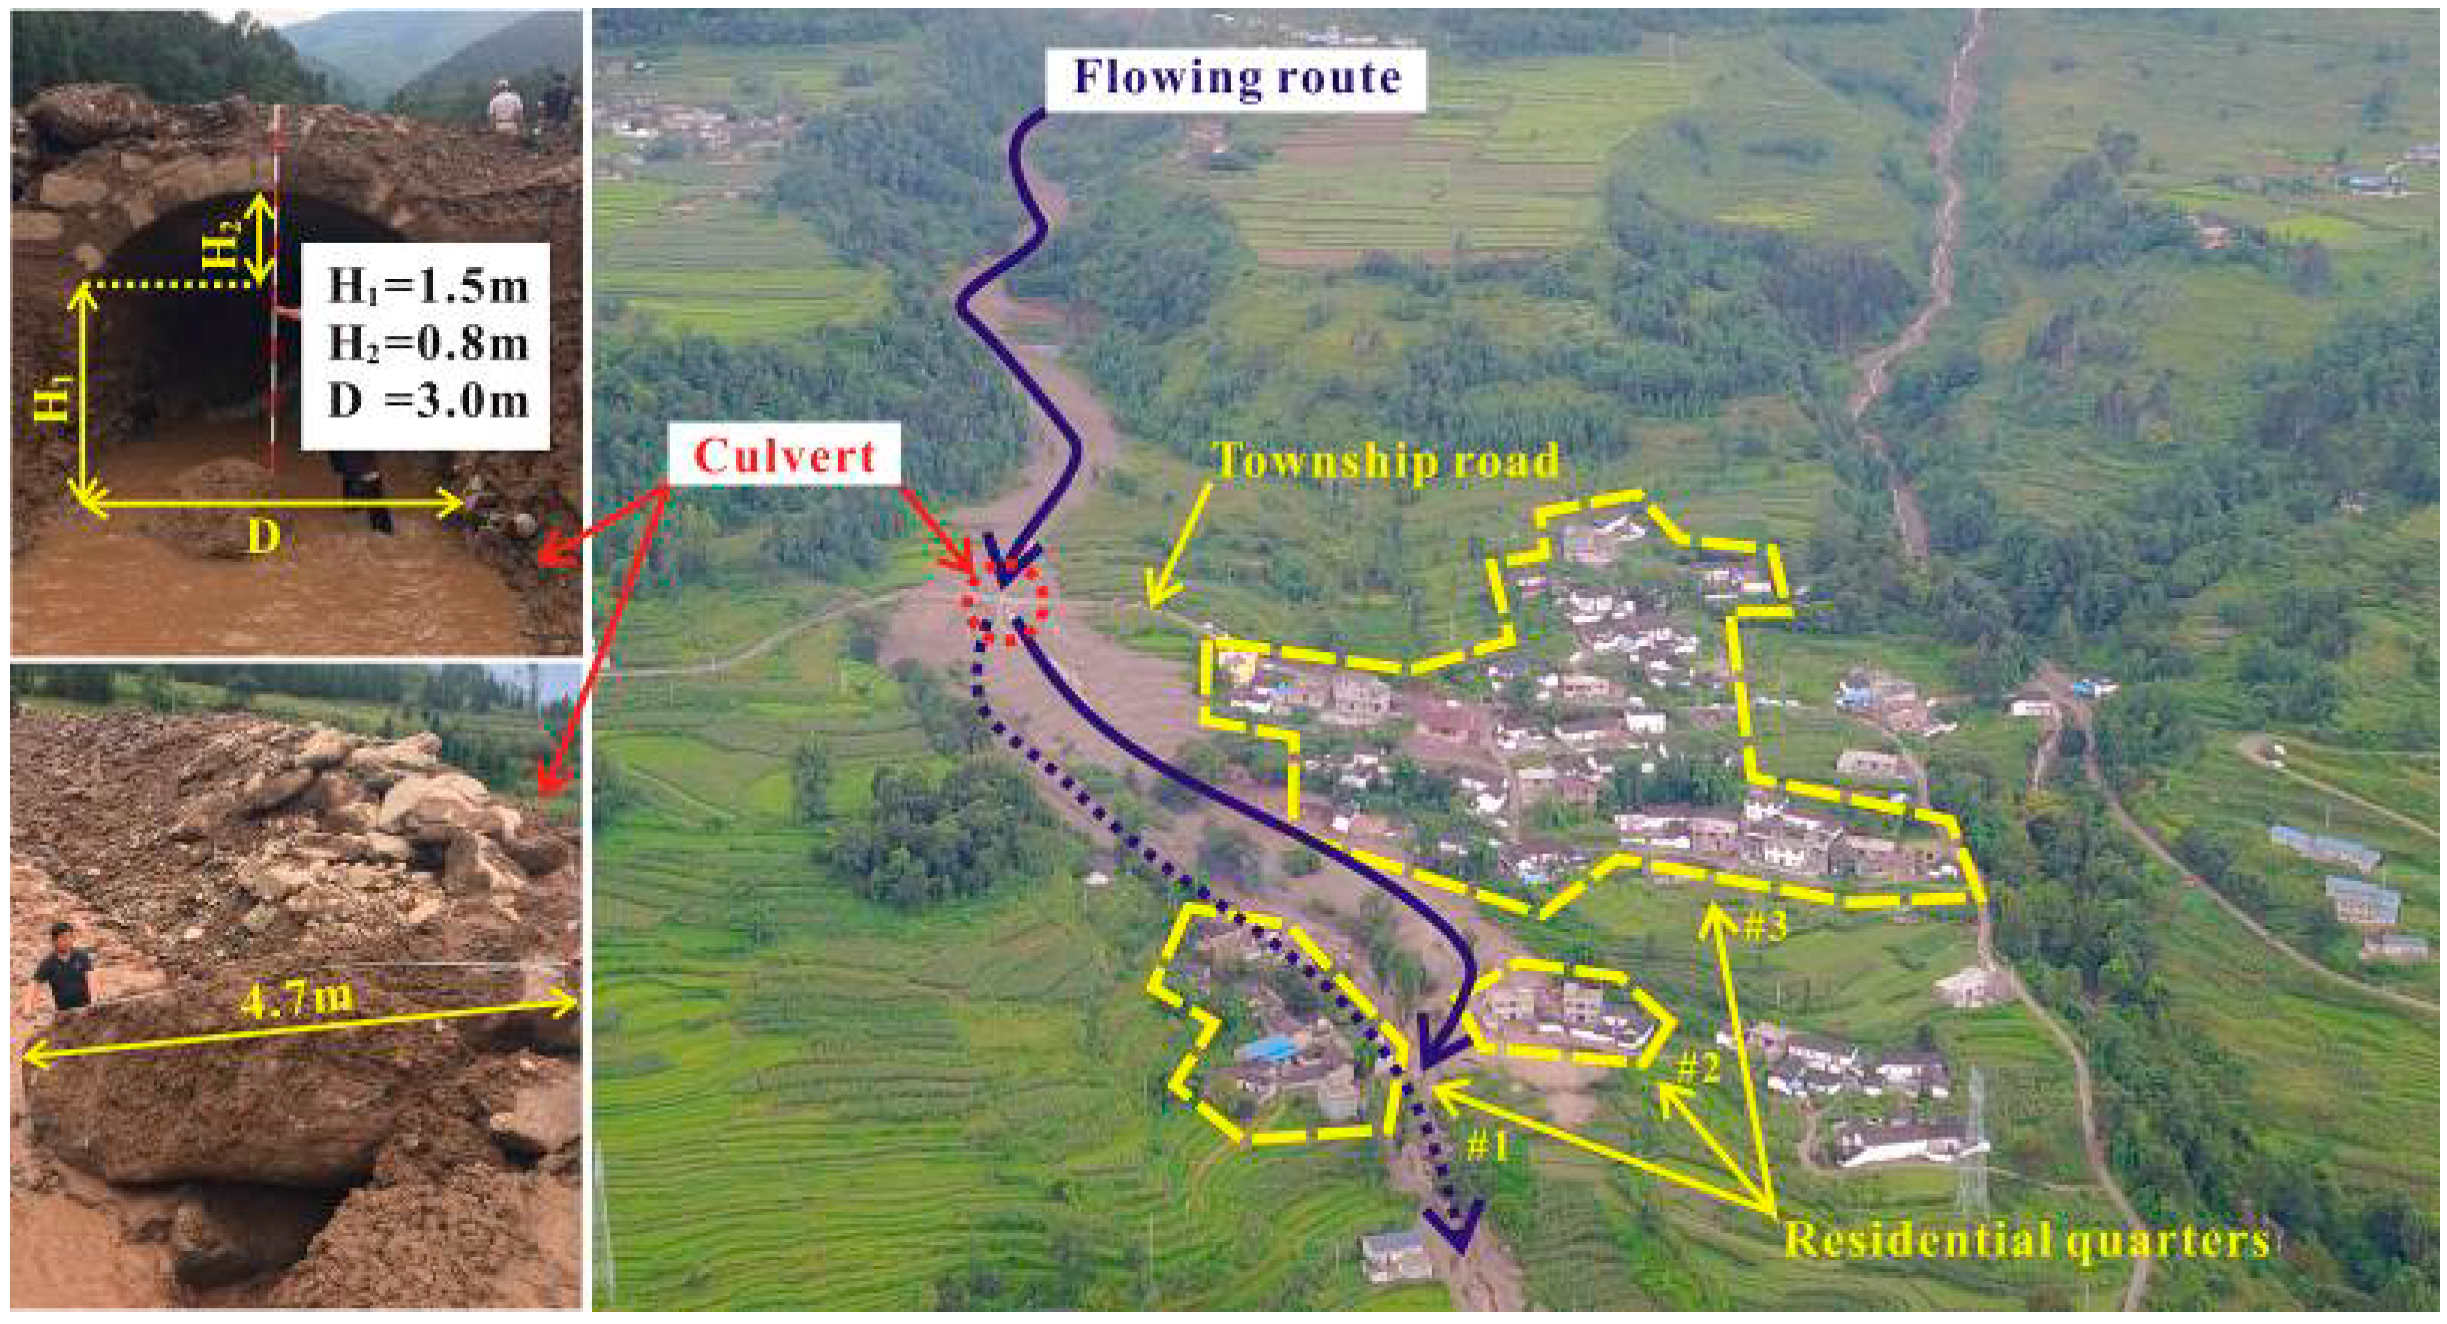
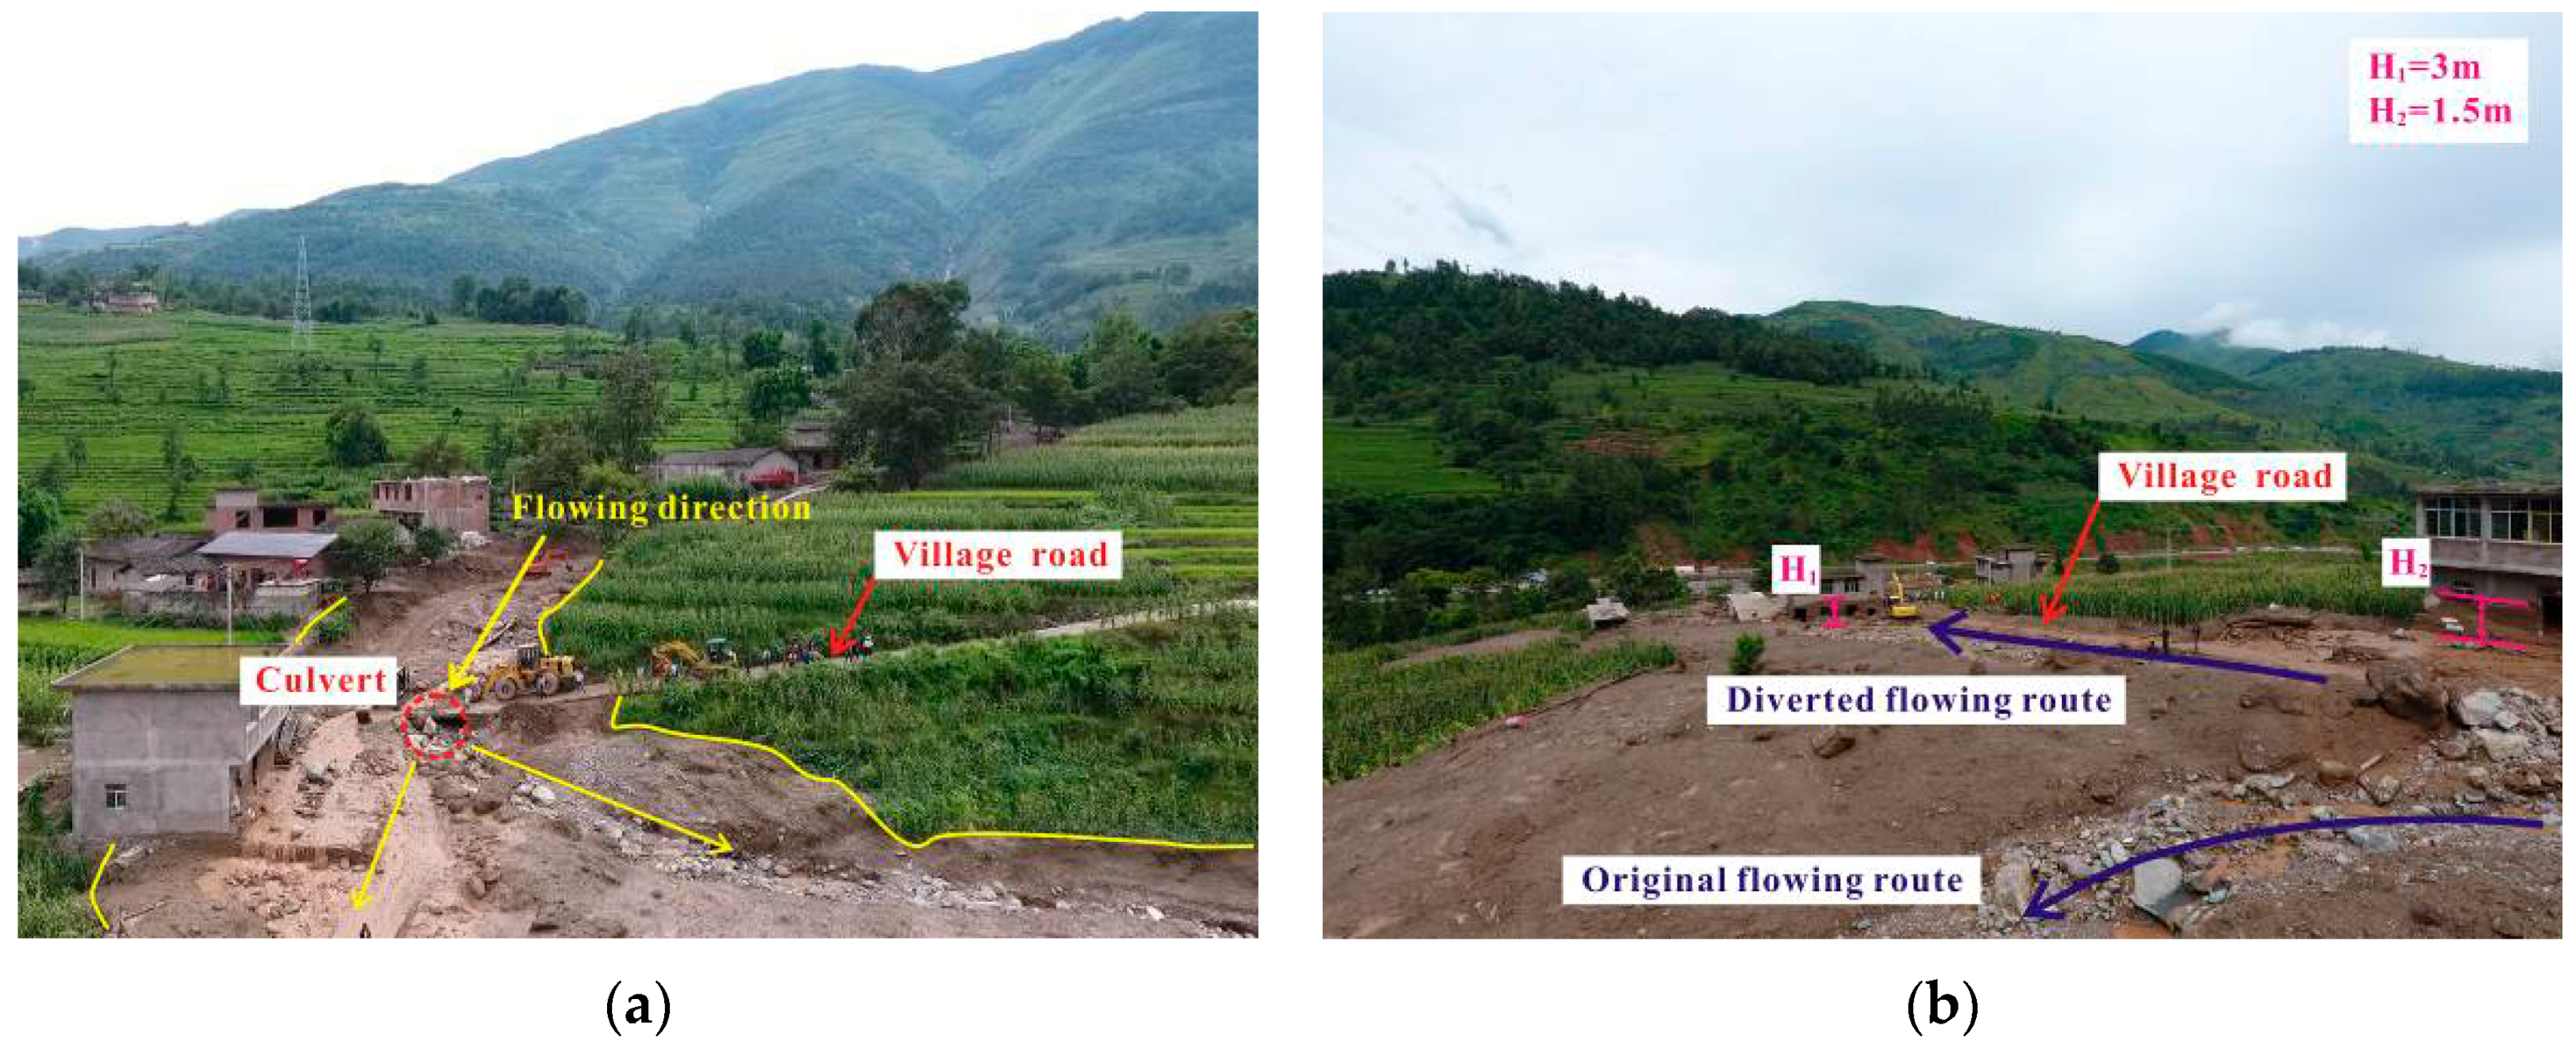
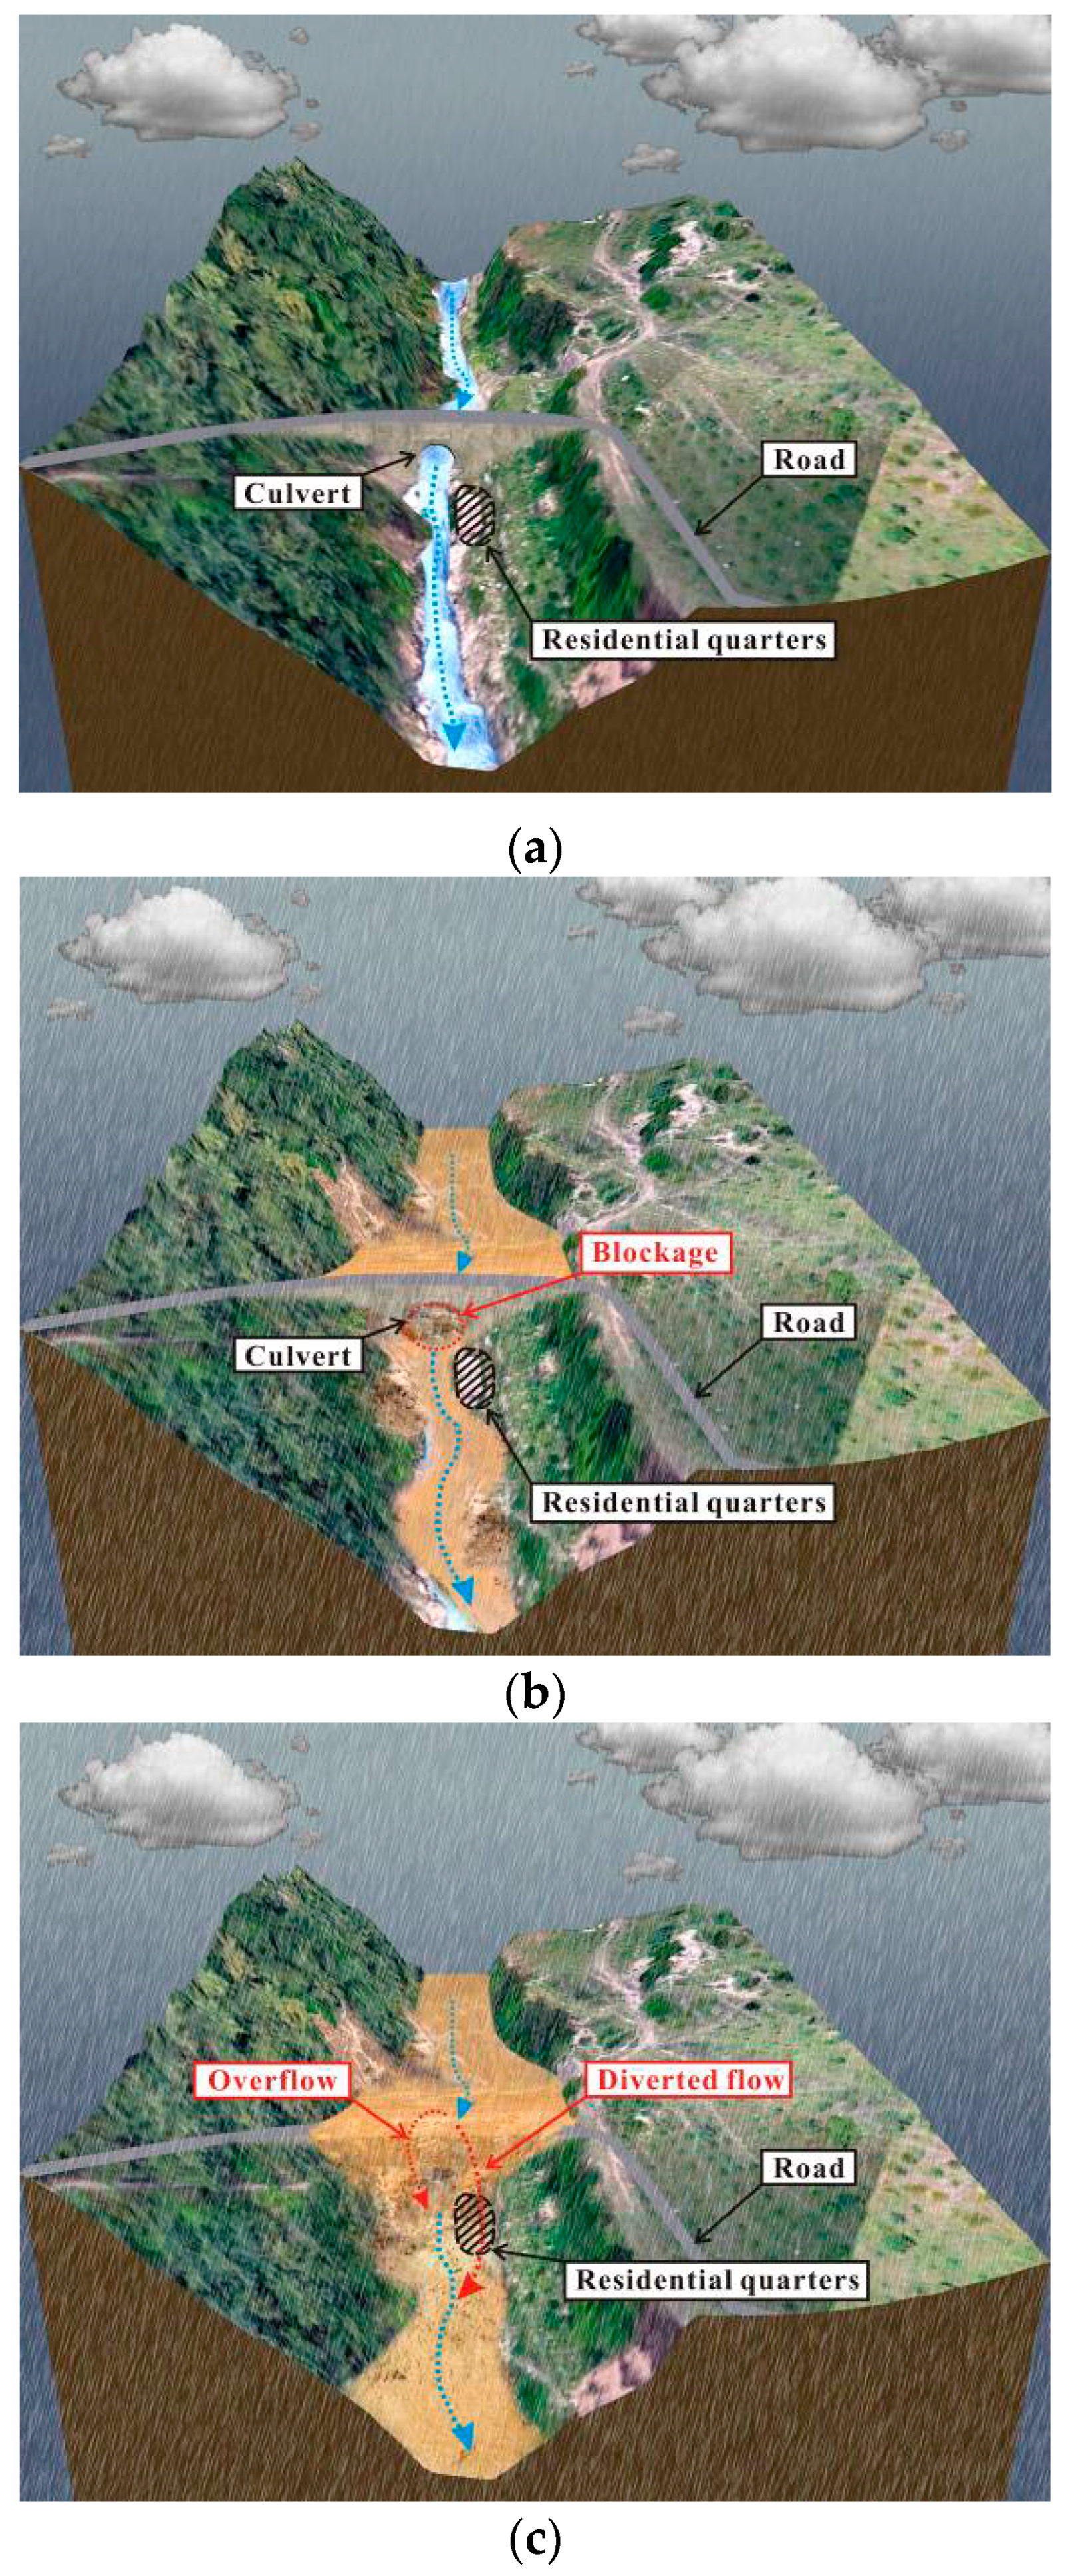
3.3. Affecting Process and Local Blockage with Outburst

In the content of geomorphology, the outburst refers to the sudden release of surface runoff or debris flow when the barrier collapses or is eroded. The local blockage and outburst along the gully channel caused by culverts of the road project is another reason for the painful outcome. That is because the blockage and outburst changes the route of the debris flow which may aggravate the property damage and casualties. However, the original plan of facilitating the siltation and discharge control eventually enhanced the geologic hazard due to the fact that the culvert designs underestimated the discharge of the debris flow. The blockage of the culvert is a significant phenomenon in debris flow [27]. When the debris flow moved to the arch culvert (as shown in Figure 6), the flow movement was obstructed because of improper design. At that moment, the arch culvert and the solid materials inside played the role of a temporary dam and the part of surface runoff flow along the original channel by overflow. With the continuous supplement from the debris flow, the solid materials were collected behind the temporary dam as well as on the road surface nearby. During the accumulation process of solid materials, the accumulation of solid materials above the road surface had a shocking impact until they were destroyed. When the part of the blockage above the road surface was destroyed, the accumulated solid materials generated an outburst. After the destruction, the debris flow changed its direction with a tendency of running to the lower elevation since the road surface is characterized by a dip angle from the horizontal level. Eventually, the debris flow changed flow direction and inundated at the #2 and #3 residential quarters with tremendous velocity. If no blockage effect occurred within the arch culvert, only the #1 residential quarter may have been inundated and the damage may have been substantially reduced. However, in this event, 18 deaths were caused in the #2 and #3 residential quarters.
The blockage secondly occurred in the rectangle culvert, however with several differences from the first one because of topographic differences: (i) the original channel has a turn of 60° in the rectangle culvert; (ii) the road surface is parallel to the horizontal level. Known from the post-disaster situation, the debris flow was divided into two parts when passing through the second culvert. The original channel has a change of direction after the culvert. One part ran along the original channel by overflow and the other part continued the preceding flow direction by outburst.

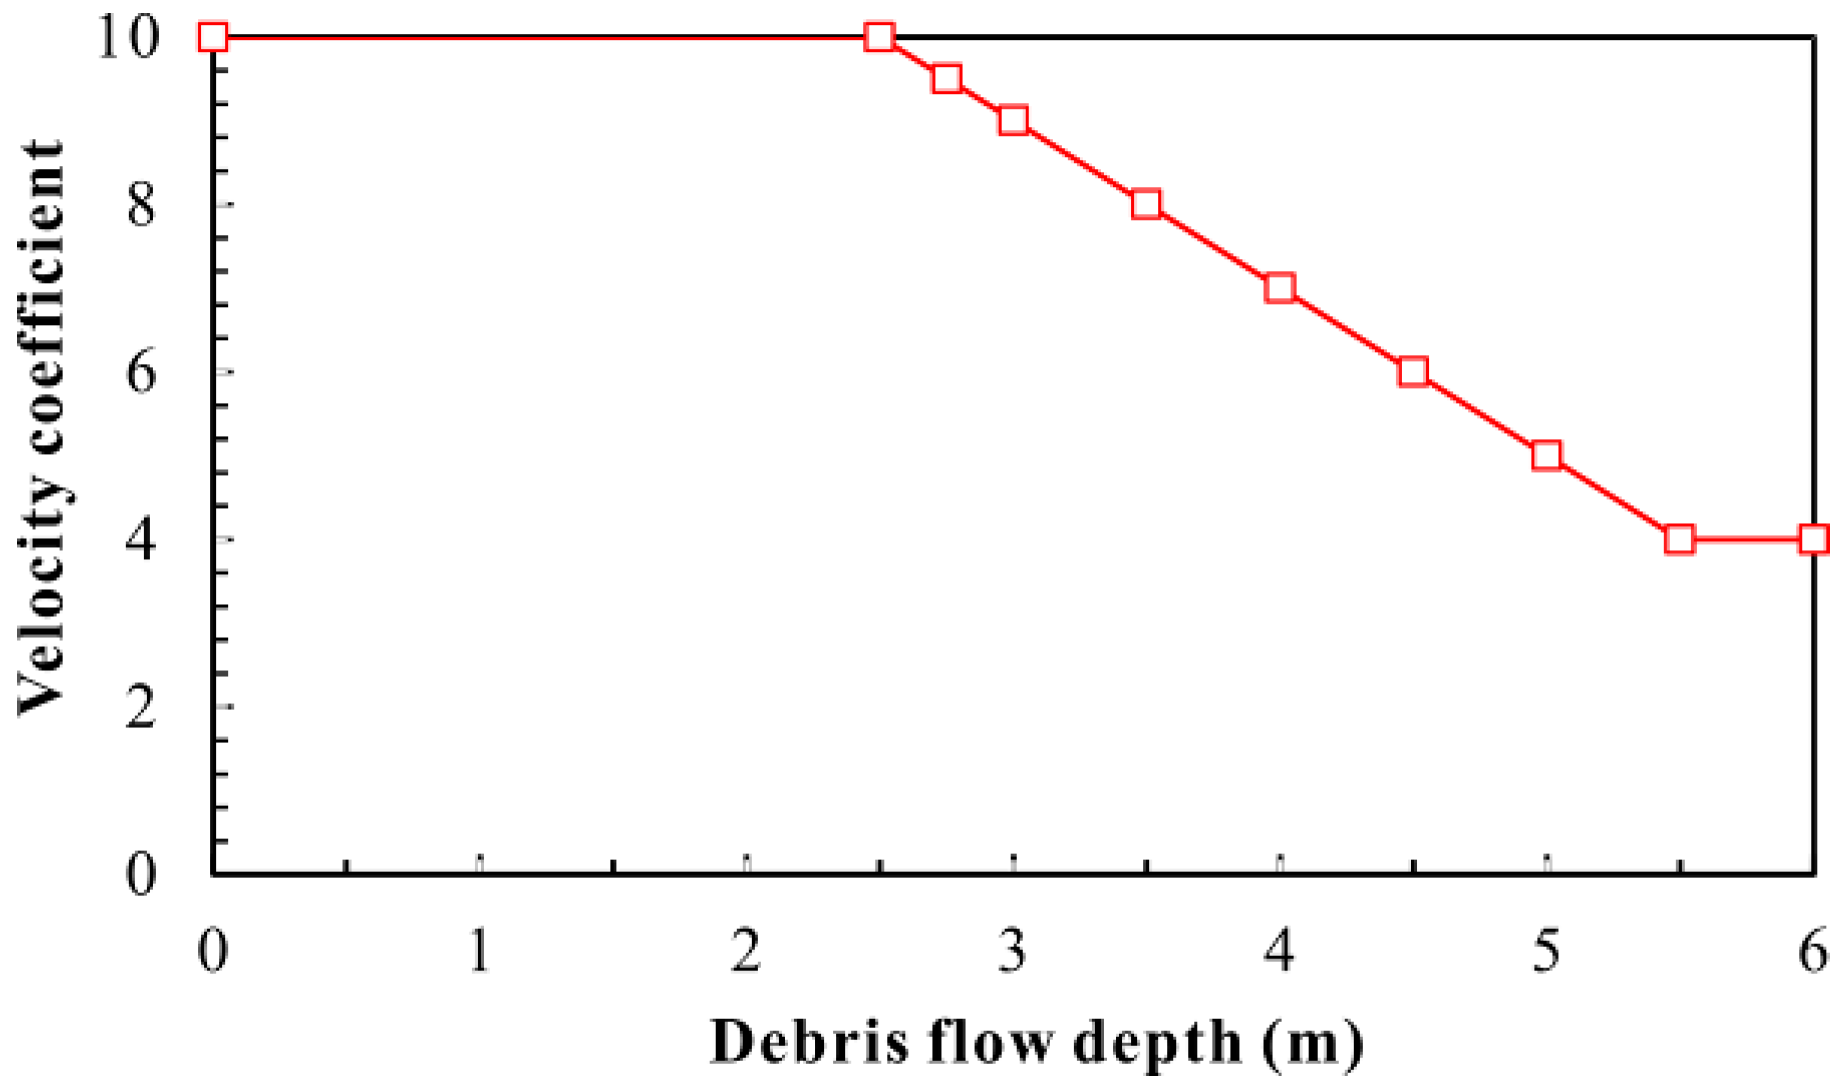
3.4. Motion Characteristics

According to the specification of geological investigation of debris flow stabilization (DZ/T0220-2006), published by the China Ministry of Lands and Resources, velocity and discharge of debris flow can be calculated by the following equations:
V c = K c H c 2 3 I 1 5
Q c = W c V c
where:
  • Vc is the peak velocity of the debris flow (m/s);
  • Kc is a factor that is related to debris flow depth of which the value can be obtained by Figure 9;
  • Hc is the debris-flow depth determined by the measurement of mud trace at the cross sections (m);
  • I is the longitudinal slope gradient of the channel (‰);
  • Qc is the peak discharge of the debris flow (m3/s);
  • Wc is the cross-sectional area (m2).
The validity of above equations has been verified [38,50,51] According to geological survey, dimensions of three chosen sections can be obtained by Table 2, where the longitudinal slope gradient of the channel in these places is 229‰. The estimated results are shown in Table 3.
As shown in Table 4, although the Tongzilin Gully in the Puge event has a smaller basin with a drainage area of 3.7 km2, the estimated values of peak velocity and peak discharge are considered as having a high level when the accumulated precipitation is 49.2 mm. Although the dimension of the basin area limited the scale of debris flow, the flow in the Puge event is considered as having a surprisingly large velocity when accessing residential quarters. For the prevention and mitigation of the geologic hazards, the most important thing is to accurately estimate the motion characteristic parameters of the potential debris flow. The Puge event has provided a lesson that erroneous estimations cannot reduce, however they can instead increase the catastrophic impact of the debris flow. In this situation, the calculation results are shown in Table 4, which provides a design reference for the reconstruction of flood discharge structures.

4. Discussion

The formation of a debris flow requires a large volume of surface runoff for the triggering of such a large-scale event [5,11,27,28,29]. In this case, the recorded cumulative rainfall did not provide a runoff volume that was large enough for triggering such a large-scale event. It is well-recognized in meteorology that when the air current suffers obstruction by high mountains, large amounts of local rainfall are very likely to occur in places of high elevation. Therefore, it can be inferred that the local heavy rainfall was generated in the upstream region of the Tongzilin gully. The event provides a warning of the need for a complete and responsive rainfall monitoring system in the mountainous areas of Southwest China.
According to local residents, a large-scale mountain flood has not occurred in the past 100 years. When a rainfall with intermediate intensity occurs, a small-scale surface runoff is formed with low scraped depth. In terms of the impact of the small-scale surface runoff on the supply conditions, abundant accumulated deposits exist in the gully channel that originated from mass movement processes (shallow landslides, collapses, rockfall and others) and tectonic activities. Due to the rare occurrence of severe mountain floods in the past, plenty of solid material has remained in the gully channel in the past 100 years. Different discharges generate different scale of debris flow as matter of the availability of loose sediment at the channel bed [27,28,29]. In this event, the abundant surface runoff carried out more supplies of solid materials from the actions of scour, undercutting and collapse. The abundant surface runoff is able to mobilize large quantities of sediments with the flow velocity depending on runoff discharge, while flow depth and sediment concentration is dependent on the grain size [52,53]. The constant supplies persistently improve the motion features (velocity, density and depth) of flow and further persistently enhance the erosion action. As shown in Figure 10, this interaction generates the scale amplification and energy escalation to develop flows in a cascading way. Eventually, the excessive supply of solid material allows the development of a large scale and catastrophic debris flow.
The dynamics of the propagating surge is a function of different parameters, including the sediment content, channel slope angle and run off [54]. As shown in Figure 11, the common types of natural topography that are favorable for the blockage of debris flows included (i) the constricted section of gully channel, (ii) arc gully channels and (iii) the intersections between the gully channels of different longitudinal gradients. The causes of the blockage were the reduction of flow area, the change of flow type and the decrease of flow velocity. The occurrence of the debris outburst, however, requires some necessary conditions, i.e., certain slope gradients on both sides and sufficient supply of solid materials. The slope in this area is sufficiently steep for the generation of large scale surface runoff, implying a significant amount of gravitational energy. As such, the gravitational energy of abundant solid materials in the debris flow has been converted to kinematic energy, which can eventually destroy the blockage. The potential energy is not enough without water, and solid material would stop. There is also the contribution of the inertia of the arriving solid-liquid mixtures at the obstructed site. In some circumstances, the responses of surface and underground water were also involved in the outburst phenomenon, including the seepage forces within the blockage, the osmotic force of underground water and the erosion by surface water. However, in general, the blockage and outburst that are caused by natural topography have little influence on human activities.
When a debris flow spreads into human settlements, the blockage followed by outburst that is caused by civil works (such as the culvert or other types of buildings) turns out to be a serious threat to the safety of human life and property. It usually occurs as a result of the combination of multiple factors, especially when excessive solid materials are available [55,56,57]. If it is a normal surface runoff or a small-scale debris flow, as shown in Figure 12a, it would pass through the culvert without the blockage because of the lack of sufficient solid material. As shown in Figure 12b, debris flow of a large scale cannot be discharged through the culvert and a blockage that acts as a dam temporarily occurs. During the process, as shown in Figure 12c, some of the debris flow runs across the road surface by overflow. The blockage above the road surface will eventually be destroyed by the continuous coming of the debris flow behind. One example of the outburst is depicted in Figure 12c. Following the outburst, the release of aggregated potential energy instantaneously made the debris flow at a high velocity. In this event, the two discharge diversions that were caused by the blockage and outburst are similar, however they have several differences. The discharge diversion occurring at the rectangle culvert of the village road is because the original channel makes a turn right there. The discharge diversion occurring at the arch culvert of the township road, however, is a special case that is mainly controlled by the small transverse slope gradient of the road surface. Because some residential quarters are in the downstream direction, the debris flow has caused severe damage to the properties and several casualties, which could have been avoided with a stronger discharge capacity culvert.

5. Conclusions

Based on the field observations on the Puge event on 8 August 2017, the main conclusions can be drawn as follows:
(1)
From the records in the meteorological station and Doppler weather radar analyses, the debris flow occurred between 3:30 and 4:00 a.m. and the accumulative precipitation in the study area was 49.2 mm on the day of the event. Because of the lack of rainfall measurements at high elevations, it is deduced from the large size of the event and comparison with past debris flows that a large amount of rainfall occurred in the middle and upper reaches of the Tongzilin gully. This event is a warning for establishing a complete and responsible rainfall monitoring system to guard against future potential geologic hazards. Prior to the occurrence of catastrophic consequences, it is possible to make a series of hazard prevention and mitigation works in advance to respond to the occurrence of debris flows.
(2)
According to estimates, the averages of peak velocity and peak discharge of debris flow are 6.9 m/s and 151 m3/s, respectively. It is quite a shocking motion compared to the recent events. The calculation results provide a design reference for the reconstruction of flood discharge structures.
(3)
Supply conditions, in addition to rainfall intensity and duration, are important factors that should be considered in predicting the occurrence of debris flows. In the current research, the ignoring of the supply conditions makes the prediction of the occurrence of debris flows meaningless. According to the consultation with local residents and the field investigation, large-scale surface runoff rarely occurs with the erosion effect before. Therefore, the supply condition of solid materials is abundant. For future government works, more prevention and control measures, such as gully channel dredging, gully bed reinforcing and slope stabilization, should be taken for channels with an abundant supply.
(4)
The transformation of natural topography by human activities is likely to increase the risk of geologic hazards. In the case of the Puge event, the blockage effect of two culverts made great contributions to the movement of debris flow by changing the flow direction. The construction of prevention and mitigation measures for geologic hazards must consider the occurrence and movement. Therefore, coordinating the relationship between humans and nature is the key to dealing with geologic hazards, including the rational layout of human living space, the thoughtful design of hazard prevention, mitigation construction and the effective conservation of soil and water.

Author Contributions

J.Z. and M.C carried out the field survey of this study and wrote the original manuscript. T.Z. and X.W. revised the original manuscript. X.L. and J.Z. conceived the original ideas and supervised the project.

Funding

This research was funded by the National Key R&D Program of China (2017YFC1501102), the National Natural Science Foundation of China (51639007) and the Youth Science and Technology Fund of Sichuan Province (2016JQ0011).

Acknowledgments

Critical comments by the anonymous reviewers greatly improved the initial manuscript.

Conflicts of Interest

The authors declare no conflict of interest.

References

  1. Chang, M.; Tang, C.; Van Asch, T.W.J.; Cai, F. Hazard assessment of debris flows in the Wenchuan earthquake-stricken area, South West China. Landslides 2017, 14, 1–10. [Google Scholar] [CrossRef]
  2. Tang, C.; Zhu, J.; Li, W.L.; Liang, J.T. Rainfall-triggered debris flows following the Wenchuan earthquake. Bull. Eng. Geol. Environ. 2009, 68, 187–194. [Google Scholar] [CrossRef]
  3. Zhou, J.W.; Cui, P.; Yang, X.G. Dynamic process analysis for the initiation and movement of the Donghekou landslide-debris flow triggered by the Wenchuan earthquake. J. Asian Earth Sci. 2013, 76, 70–84. [Google Scholar] [CrossRef]
  4. Iverson, R.M. The physics of debris flows. Rev. Geophys. 1997, 35, 245–296. [Google Scholar] [CrossRef] [Green Version]
  5. Iverson, R.M.; Reid, M.E.; Lahusen, R.G. Debris-flow mobilization from landslides. Annu. Rev. Earth Planet. Sci. 1997, 25, 85–136. [Google Scholar] [CrossRef]
  6. Takahashi, T. Estimation of potential debris flows and their hazardous zones: Soft countermeasures for a disaster. J. Nat. Disaster Sci. 1981, 3, 57–89. [Google Scholar]
  7. Coe, J.A.; Kinner, D.A.; Godt, J.W. Initiation conditions for debris flows generated by runoff at Chalk Cliffs, central Colorado. Geomorphology 2008, 96, 270–297. [Google Scholar] [CrossRef]
  8. Tognacca, C.; Bezzola, G.R.; Minor, H.E. Threshold criterion for debris-flow initiation due to channel-bed failure. In Proceedings of the 2nd International Conference on Debris-Flow Hazard Mitigation, Taipei, Taiwan, 16–18 August 2000; pp. 89–97. [Google Scholar]
  9. Gregoretti, C. Experimental evidence from the triggering of debris flow along a granular slope. Phys. Chem. Earth Part B Hydrol. Ocean. Atmos. 2000, 25, 387–390. [Google Scholar] [CrossRef]
  10. Gregoretti, C. The initiation of debris flow at high slopes: Experimental results. J. Hydraul. Res. 2000, 38, 83–88. [Google Scholar] [CrossRef]
  11. Hu, W.; Dong, X.J.; Wang, G.H.; van Asch, T.W.J.; Hicher, P.Y. Initiation processes for run-off generated debris flows in the Wenchuan earthquake area of China. Geomorphology 2016, 253, 468–477. [Google Scholar] [CrossRef]
  12. Berti, M.; Simoni, A. Experimental evidences and numerical modelling of debris flow initiated by channel runoff. Landslide 2005, 2, 171–182. [Google Scholar] [CrossRef]
  13. Imaizumi, F.; Sidle, R.C.; Tsuchiya, S.; Ohsaka, O. Hydrogeomorphic processes in a steep debris flow initiation zone. Geophys. Res. Lett. 2006, 33, 229–237. [Google Scholar] [CrossRef]
  14. Cannon, S.; Gartner, J.E.; Wilson, R.C.; Bowers, J.C.; Laber, J.L. Storm rainfall conditions for floods and debris flows from recently burned areas in Southwestern Colorado and Southern California. Geomorphology 2008, 96, 250–269. [Google Scholar] [CrossRef]
  15. Gregoretti, C.; Dalla Fontana, G. The triggering of debris flow due to channel-bed failure debris flow in some alpine headwater basins of the Dolomites: Analyses of critical runoff. Hydrol. Process. 2008, 22, 2248–2263. [Google Scholar] [CrossRef]
  16. Theule, J.I.; Liebault, F.; Loye, A.; Laigle, D.; Jaboyedoff, M. Sediment budget monitoring of debris flow and bedload transport in the Manival Torrent, SE France. Nat. Hazard Earth Syst. Sci. 2012, 12, 371–749. [Google Scholar] [CrossRef]
  17. McCoy, S.W.; Kean, J.W.; Coe, J.A.; Tucker, G.E.; Staley, D.M.; Wasklewicz, W.A. Sediment entrainment by debris flows: In situ measuremeants from the head-waterscof of a steep catchment. J. Geophys. Res. Earth Surf. 2012, 117, F03016. [Google Scholar] [CrossRef]
  18. Kean, J.W.; McCoy, S.W.; Tucker, G.E.; Staley, D.M.; Coe, J.A. Runoff-generated debris flows: Observations and modeling of surge initiation, magnitude, and frequency. J. Geophys. Res. Earth Surf. 2013, 118, 2190–2207. [Google Scholar] [CrossRef] [Green Version]
  19. Hurlimann, M.; Abanco, C.; Moya, J.; Vilajosana, I. Results and experiences gathered at the Rebaixader debris-flow monitoring site, Central Pyrenees, Spain. Landslides 2014, 11, 939–953. [Google Scholar] [CrossRef]
  20. Tiranti, D.; Deangeli, C. Modeling of debris flow depositional patterns according to the catchments and sediment source areas characteristics. Front. Earth Sci. 2015, 3, 8. [Google Scholar] [CrossRef]
  21. Ma, C.; Deng, J.; Wang, R. Analysis of the triggering conditions and erosion of a runoff-triggered debris flow in Miyun County, Beijing, China. Landslides 2018, 15, 2475–2485. [Google Scholar] [CrossRef]
  22. Qi, S.; Vanapalli, S.K. Hydro-mechanical coupling effect on surficial layer stability of unsaturated expansive soil slopes. Comput. Geotech. 2015, 70, 68–82. [Google Scholar] [CrossRef]
  23. Qi, S.; Vanapalli, S.K. Influence of swelling behavior on the stability of an infinite unsaturated expansive soil slope. Comput. Geotech. 2016, 76, 154–169. [Google Scholar] [CrossRef]
  24. Qi, S. Numerical Investigation for Slope Stability of Expansive Soils and Large Strain Consolidation of Soft Soils. Ph.D. Thesis, University of Ottawa, Ottawa, ON, Canada, 2017. [Google Scholar]
  25. Theule, J.I.; Liebault, F.; Laigle, D.; Loye, A.; Jaboyedoff, M. Channel scour and fill by debris flows and bedload transport. Geomorphology 2015, 243, 92–105. [Google Scholar] [CrossRef]
  26. Reid, M.E.; Coe, J.A.; Dianne, L.B. Forecasting inundation from debris flows that grows volumetrically during travel, with application to the Oregon Coast Range, USA. Geomorphology 2016, 273, 396–411. [Google Scholar] [CrossRef]
  27. Gregoretti, C.; Degetto, M.; Bernard, M.; Boreggio, M. The debris flow occurred at Ru Secco Creek, Venetian Dolomites, on 4 August 2015: Analysis of the phenomenon, its characteristics and reproduction by models. Front. Earth Sci. 2018, 6, 80. [Google Scholar] [CrossRef]
  28. Gregoretti, C.; Stancanelli, L.M.; Bernard, M.; Boreggio, M.; Degetto, M.; Lanzoni, S. Relevance of erosion processes when modelling in-channel gravel debris flows for efficient hazard assessment. J. Hydrol. 2019, 569, 575–591. [Google Scholar] [CrossRef]
  29. Gregoretti, C.; Degetto, M.; Bernard, M.; Crucil, G.; Pimazzoni, A.; De Vido, G.; Lanzoni, S. Runoff of small rocky headwater catchments: Field observations and hydrological modeling. Water Resour. Res. 2016, 52, 8138–8158. [Google Scholar] [CrossRef]
  30. Imaizumi, F.; Hayakawa, Y.S.; Hotta, N.; Tsunetaka, H.; Ohsaka, O.; Tsuchiya, S. Relationship between the accumulation of sediment storage and debris-flow characteristics in a debris-flow initiation zone, Ohya landslide body, Japan. Nat. Hazards Earth Syst. Sci. 2017, 17, 1923–1938. [Google Scholar] [CrossRef]
  31. Iverson, R.M.; Schilling, S.P.; Vallance, J.W. Objective delineation of lahar-hazard zones downstream from volcanoes. Geol. Soc. Am. Bull. 1998, 110, 972–984. [Google Scholar] [CrossRef]
  32. Rickenmann, D. Empirical relationships for debris flows. Nat. Hazards 1999, 19, 47–77. [Google Scholar] [CrossRef]
  33. Rickenmann, D.; Weber, D. Flow resistance of natural and experimental debris flows in torrent channels. In Proceedings of the Second International Conference on Debris Flow Hazard and Mitigation, Taipei, Taiwan, 16–18 August 2000; pp. 245–254. [Google Scholar]
  34. Santi, P.M.; de Wolfe, V.G.; Higgins, J.D.; Cannon, S.H.; Gartner, J.E. Sources of debris flow material in burned areas. Geomorphology 2008, 96, 310–321. [Google Scholar] [CrossRef]
  35. Flores, J.; D’Alpaos, A.; Squarzoni, C.; Genevois, R.; Marani, M. Recent changes in rainfall characteristics and GIS and their influence on threshold for debris flow triggering on Dolomitc area of Cortina d’Ampezzo, North-eastern Italian Alps. Nat. Hazard Earth Syst. Sci. 2010, 10, 571–580. [Google Scholar] [CrossRef]
  36. Chiarle, M.; Iannotti, S.; Mortara, G.; Deline, P. Recent debris flow occurrences associated with glaciers in the Alps. Glob. Planet. Chang. 2007, 56, 123–136. [Google Scholar] [CrossRef]
  37. Ren, D. The devastating Zhouqu storm-triggered debris flow of August 2010: Likely causes and possible trends in a future warming climate. J. Geophys. Res. Atmos. 2014, 119, 3643–3662. [Google Scholar] [CrossRef] [Green Version]
  38. Tang, C.; Rengers, N.; van Asch, T.W.J.; Yang, Y.H. Triggering conditions and depositional characteristics of a disastrous debris flow event in Zhouqu City, Gansu Province, Northwestern China. Nat. Hazards Earth Syst. Sci. 2011, 11, 2903–2912. [Google Scholar] [CrossRef]
  39. Tang, C.; Zhu, J.; Ding, J.; Cui, X.F.; Chen, L.; Zhang, J.S. Catastrophic debris flows triggered by a 14 August 2010 rainfall at the epicenter of the Wenchuan earthquake. Landslides 2011, 8, 485–497. [Google Scholar] [CrossRef]
  40. Yu, B.; Ma, Y.; Wu, Y. Case study of a giant debris flow in the Wenjia gully, Sichuan Province, China. Nat. Hazards 2013, 65, 835–849. [Google Scholar] [CrossRef]
  41. Zhou, J.W.; Cui, P.; Yang, X.G.; Su, Z.M. Debris flows introduced in landslide deposits under rainfall conditions: The case of Wenjiagou gully. J. Mt. Sci. 2013, 10, 249–260. [Google Scholar] [CrossRef]
  42. Xie, H.; Zhong, D.L.; Jiao, Z.; Zhang, J.S. Debris Flow in Wenchuan Quake-hit Area in 2008. J. Mt. Sci. 2009, 27, 501–509, (Chinese Reference). [Google Scholar]
  43. Liao, Y.F.; Li, Y.; Chen, X.Y.; Feng, J.N. Study and application of glaze environmental influence factors—Taking hunan as an example. J. Catastrophol. 2011, 26, 76–81, (Chinese Reference). [Google Scholar]
  44. Cui, P.; Lin, Y. Debris-flow treatment: The integration of botanical and geotechnical methods. J. Resour. Ecol. 2013, 4, 97–104. [Google Scholar]
  45. Gan, B.R.; Liu, X.N.; Yang, X.G.; Wang, X.K.; Zhou, J.W. The impact of human activities on the occurrence of mountain flood hazards: Lessons from the 17 August 2015 flash flood/debris flow event in Xuyong County, south-western China. Geomat. Nat. Hazards Risk 2018, 9, 816–840. [Google Scholar] [CrossRef]
  46. Chen, N.; Chen, M.; Li, J.; He, N.; Deng, M.; Iqbal Tanoli, J.; Cai, M. Effects of human activity on erosion, sedimentation and debris flow activity—A case study of the Qionghai Lake watershed, southeastern Tibetan Plateau, China. Holocene 2015, 25, 973–988. [Google Scholar] [CrossRef]
  47. Wang, G.L. Lessons learned from protective measures associated with the 2010 Zhouqu debris flow disaster in China. Nat Hazards 2013, 69, 1835–1847. [Google Scholar] [CrossRef]
  48. Bovis, M.J.; Jakob, M. The role of debris supply conditions in predicting debris flow activity. Earth Surf. Process. Landf. 1999, 24, 1039–1054. [Google Scholar] [CrossRef]
  49. Berger, C.; Mcardell, B.W.; Schlunegger, F. Direct measurement of channel erosion by debris flows, Illgraben, Switzerland. J. Geophys. Res. Earth Surf. 2011, 116, 93–104. [Google Scholar] [CrossRef]
  50. Kean, J.W.; Coe, J.A.; Coviello, V.; Smith, J.B.; Mccoy, S.W.; Arattano, M. Estimating rates of debris flow entrainment from ground vibrations. Geophys. Res. Lett. 2015, 42, 6365–6372. [Google Scholar] [CrossRef] [Green Version]
  51. Prochaska, A.B.; Santi, P.M.; Higgins, J.D.; Cannon, S.H. A study of methods to estimate debris flow velocity. Landslides 2008, 5, 431–444. [Google Scholar] [CrossRef]
  52. Hungr, O.; Morgan, G.C.; Kellerhals, R. Quantitative analysis of debris torrent hazards for design of remedial measures. Can. Geotech. J. 1984, 21, 663–677. [Google Scholar] [CrossRef]
  53. Lanzoni, S.; Gregoretti, C.; Stancanelli, L.M. Coarse-grained debris flow dynamics on erodible beds. J. Geophys. Res. 2017, 122, 592–614. [Google Scholar] [CrossRef]
  54. Stancanelli, L.M.; Musumeci, R.E. Geometrical Characterization of Sediment Deposits at the Confluence of Mountain Streams. Water 2018, 10, 401. [Google Scholar] [CrossRef]
  55. Luo, P.; Mu, D.; Xue, H.; Ngo-Duc, T.; Dang-Dinh, K.; Takara, K.; Nover, D.; Schladow, G. Flood inundation assessment for the Hanoi Central Area, Vietnam under historical and extreme rainfall conditions. Sci. Rep. 2018, 8, 12623. [Google Scholar] [CrossRef] [PubMed]
  56. Luo, P.; Zhou, M.; Deng, H.; Lyu, J.; Cao, W.; Takara, K.; Nover, D.; Schladow, G. Impact of forest maintenance on water shortages: Hydrologic modeling and effects of climate change. Sci. Total Environ. 2018, 615, 1355–1363. [Google Scholar] [CrossRef] [PubMed]
  57. Zhou, J.W.; Yang, X.G.; Hou, T.X. An analysis of the supply process of loose materials to mountainous rivers and gullies as a result of dry debris avalanches. Environ. Earth Sci. 2017, 76, 452. [Google Scholar] [CrossRef]
Figure 1. An overview of the study area by aerial photography on 8 August 2017 with the site location of the study area on a map of China.
Water 11 00169 g001
Figure 2. Geologic and geomorphic map of the Zemuhe fault zone around the study area.
Water 11 00169 g002
Figure 3. (a) An overview of the formation area in the study area by aerial photography. (b) Lithological composition exposed behind the bank slope.
Water 11 00169 g003
Figure 4. (a) An overview of the gully channel in the formation area. (b) Morphological observation of the residual material in the side edge of the gully channel of the formation area.
Water 11 00169 g004
Figure 5. (a) A photo of the gully channel between the formation and transition areas. (b) A photo of the gully channel in the transition area. (c) Scour of the right bank of the gully channel in the transition area. (d) Scoring of the left bank of the gully channel in the transition area (all photos were shot on 9 August 2017).
Water 11 00169 g005aWater 11 00169 g005b
Figure 6. Route diversion of the debris flow after the arc culvert of the township road in the inundated or runout area with morphological observation of the cleared arc culvert of the township road and the great stone block in the arc culvert after cleaning (all photos were shot on 9 August 2017).
Water 11 00169 g006
Figure 7. (a) Flow direction diversion of the debris flow after the rectangle culvert of the village road in the inundated or runout area. (b) Hazard trace situation after the diversion of the debris flow in the inundated or runout area (all photos were shot on 9 August 2017).
Water 11 00169 g007
Figure 8. Rainfall characteristics on 8 August 2017. (a) Hourly and cumulative rainfall measured by the Qiaowo meteorological station. (b) Evolution of the reflectivity factor at an elevation of 2.4 degrees on the Doppler radar of Xichang city.
Water 11 00169 g008
Figure 9. Recommended values of the velocity coefficient (Kc) by debris flow depth (Hc).
Water 11 00169 g009
Figure 10. Evolution of mountain water hazards and the cascading process of the supply for hazard formation and development.
Water 11 00169 g010
Figure 11. Blockage types of debris flows occurring on natural topography: (a) constricted section of gully channel, (b) arc gully channel and (c) intersection between the gully channel of the larger longitudinal gradient and the gully channel of the smaller longitudinal gradient.
Water 11 00169 g011
Figure 12. Diagrammatic sketches of different sorts of flow: (a) normal surface runoff, mountain flood or small-scale debris flow passing through the culvert; (b) a large-scale debris flow passing through the culvert and (c) a special circumstance of a large-scale debris flow passing through the culvert with the participation of a great stone block.
Water 11 00169 g012
Table 1. Main morphometric parameters of the Tonzilin Gully.
LocationTongzilin Gully
Channel length (km)5.5
Basin area (km2)3.7
Average longitudinal channel gradient (‰)365
Average longitudinal channel gradient (Elevation 1650–3430 m, ‰)476
Average longitudinal channel gradient (Below elevation 1650 m, ‰)147
Average slope gradient (Elevation 1650–3430 m, ‰)40°–60°
Average slope gradient (Below elevation 1650 m, ‰)15°–20°
Table 2. Morphological characteristics of three chosen sections after suffering the influence of debris flow in the transition area.
No.LongitudeLatitudeLeft BankRight BankRiverbed Width (m)Water Passing Height (m)
ObjectCovering Width (m)ObjectCovering Width (m)
1E 102°28′37′′N 27°28′09′′Paddy field34.8Dry land8.07.30.9
2E 102°28′35′′N 27°28′07′′Woods12.0Dry land15.79.01.0
3E 102°28′29′′N 27°27′58′′Hennery14.5Barren slope5.210.50.8
Table 3. The calculation results of motion characteristics’ parameters in three chosen sections.
No.KCI (‰)WC (m2)Chinese Specification
QC (m3/s)VC (m/s)
11022925.83179.36.9
21022922.85170.27.4
31022916.28104.56.4
Table 4. The comparison of motion characteristics of a section in the transition area between the Puge event and the Zhouqu event.
LocationTorrentChannel Length (km)Basin Area (km2)VC (m/s)QC (m3/s)
Zhouqu [22]Sanyanyu Gully10.425.759.71358
Luojiayu Gully9.516.1411.0572
PugeTongzilin Gully5.53.76.9105

