Relationship between Soil Salinization and Groundwater Hydration in Yaoba Oasis, Northwest China


1
Key Laboratory of Subsurface Hydrology and Ecological Effects in Arid Region of Ministry of Education, School of Environmental Science and Engineering, Chang’an University, Xi’an 710054, China
2
The First Topographic Surveying Brigade of Ministry of Natural Resource of P.R.C., Xi’an 710054, China
3
School of Geological Engineering and Geomatics, Chang’an University, Xi’an 710054, China
*
Author to whom correspondence should be addressed.
Water 2019, 11(1), 175; https://doi.org/10.3390/w11010175
Submission received: 13 November 2018
/
Revised: 11 January 2019
/
Accepted: 11 January 2019
/
Published: 20 January 2019
(This article belongs to the Section Water Quality and Contamination)
Abstract
:Precipitation is scarce and evaporation is intense in desert areas. Groundwater is used as the main water source to develop agriculture in the oases. However, the effects of using groundwater on the ecological environment elicit widespread public concern. This study investigated the relationship between soil salinity and groundwater characteristics in Yaoba Oasis through in situ experiments. The relationship of the mineral content, pH, and main ion content of groundwater with soil salt was quantitatively evaluated through a gray relational analysis. Four main results were obtained. First, the fresh water area with low total dissolved solid (TDS) was usually HCO3− or SO42− type water, and salt water was mostly Cl− and SO42−. The spatial distribution of main ions in groundwater during winter irrigation in November was basically consistent with that during spring irrigation in June. However, the spatial distribution of TDS differed in the two seasons. Second, soil salinization in the study area was severe, and the salinization rate reached 72.7%. In this work, the spatial variability of soil salinization had a relatively large value, and the values in spring were greater than those in autumn. Third, the soil in the irrigated area had a high salt content, and the salt ion content of surface soil was higher than that of subsoil. A piper trilinear diagram revealed that Ca2+ and K+ + Na+ were the main cations. SO42−, Cl−, and HCO3− were the main anions, and salinization soil mainly contained SO42−. Fourth, the changes in soil salt and ion contents in the 0–10 cm soil layer were approximately similar to those of irrigation water quality, both of which showed an increasing trend. The correlation of surface soil salinity with the salinity of groundwater and its chemical components was high. In summary, this study identified the progress of irrigation water quality in soil salinization and provided a scientific basis for improving the oasis ecosystem, maintaining the healthy development of agriculture, managing oasis water resources, and policy development. Our findings can serve as a reference for other, similar oasis research.
1. Introduction
Soil salinization is one of the main threats to land desertification that frequently occurs in areas with drought climate [1,2,3,4]. Soil evaporation is intensive, and surface water contains high-solubility salts [5,6]. These conditions are caused by regional water and salt movements due to the effects of climate, topography, hydrogeology, and unreasonable human factors. Yaoba Oasis in Inner Mongolia is located in the northwestern desert region of China; its surface water resources are scarce, and its main supply source is the groundwater of Helan Mountain [7,8,9,10]. With strong evaporation, water diversion and irrigation during agricultural production increase the underground water level and cause it to exceed the critical depth, resulting in continuous water evaporation and considerable salt surface accumulations; soil salinization is also widespread in these areas [11,12]. Land salinization aggravates soil conditions and causes oasis loss and desertification [13]. These problems seriously affect the sustainable development of oases and have become key issues in internationalization [14,15,16].
Numerous authors have conducted studies on the relationship between soil salinization and groundwater in different regions. The methods they used involved a model simulation of groundwater dynamic effects on soil salt migration [17,18,19,20,21]. An empirical model was established in a previous work to quantitatively analyze the relationship between groundwater depth and soil salt content [22]. The corresponding relationship between groundwater and soil salinization was analyzed in another study by comparing the spatial distribution characteristics of groundwater depth, mineralization, and soil salt content [23,24,25]. Bing et al. confirmed that freezing and thawing are the controlling mechanisms of soil water and salt redistribution and indicated that soil salt redistribution is due to the combined action of convection, diffusion, and numerous chemical and physical processes [26]. Xia et al. established an empirical model to quantitatively analyze the relationship of groundwater depth and mineralization with soil salt content; they measured the salt content and salinity of different soil profiles under different underground water levels [27]. Abliz et al. analyzed the relationship between groundwater and soil salinization, and their results showed that the salinity of groundwater increases with decreasing groundwater depth [28]. Haj-Amor et al. investigated the driving factors of soil salinization to evaluate the impact of groundwater on soil salinization and indicated that increased soil salinity and shallow groundwater seriously threaten the long-term sustainability of irrigated agriculture [29]. Wichelns et al. evaluated the effect of groundwater on soil salinization by setting different groundwater conditions in simulation experiments [30].
Mathematical models have recently been used to quantitatively analyze the relationship between groundwater depth and salinity. Soil salinity has elicited the attention of many researchers. Xu et al. evaluated groundwater chemistry based on monitoring data by using comprehensive quantitative methods, such as statistics, principal component analysis, and gray correlation analysis [31]. Libutti et al. applied a balance model of water and salt with a representative soil profile to assess different planting strategies [32].
Current research on the effect of groundwater on soil salinity focuses on the relationship of groundwater depth and mineralization with soil salinity under a certain period; the influence of groundwater depth and its chemical characteristics on soil salinity in multiple periods should be investigated [33,34].
The above-mentioned studies have focused on natural oases with relatively abundant water resources, and only a few studies have been conducted on arid oases in artificial areas. Ground water in these areas should be investigated comprehensively to study the irrigation of local crops. A scientific basis can be provided for crop production and rational utilization of water resources by understanding the characteristics of water movement. Thus, Yaoba Oasis requires considerable attention. In the present study, fixed-point observation data on soil salinity and groundwater were used, and a gray relational analysis was conducted to quantitatively analyze the relationship between soil salinity and groundwater characteristics in different periods. The aim is to provide a scientific basis for the sustainable development of oasis agriculture and effective prevention of soil salinization in the northwestern desert region of China.
2. Materials and Methods
2.1. Study Area
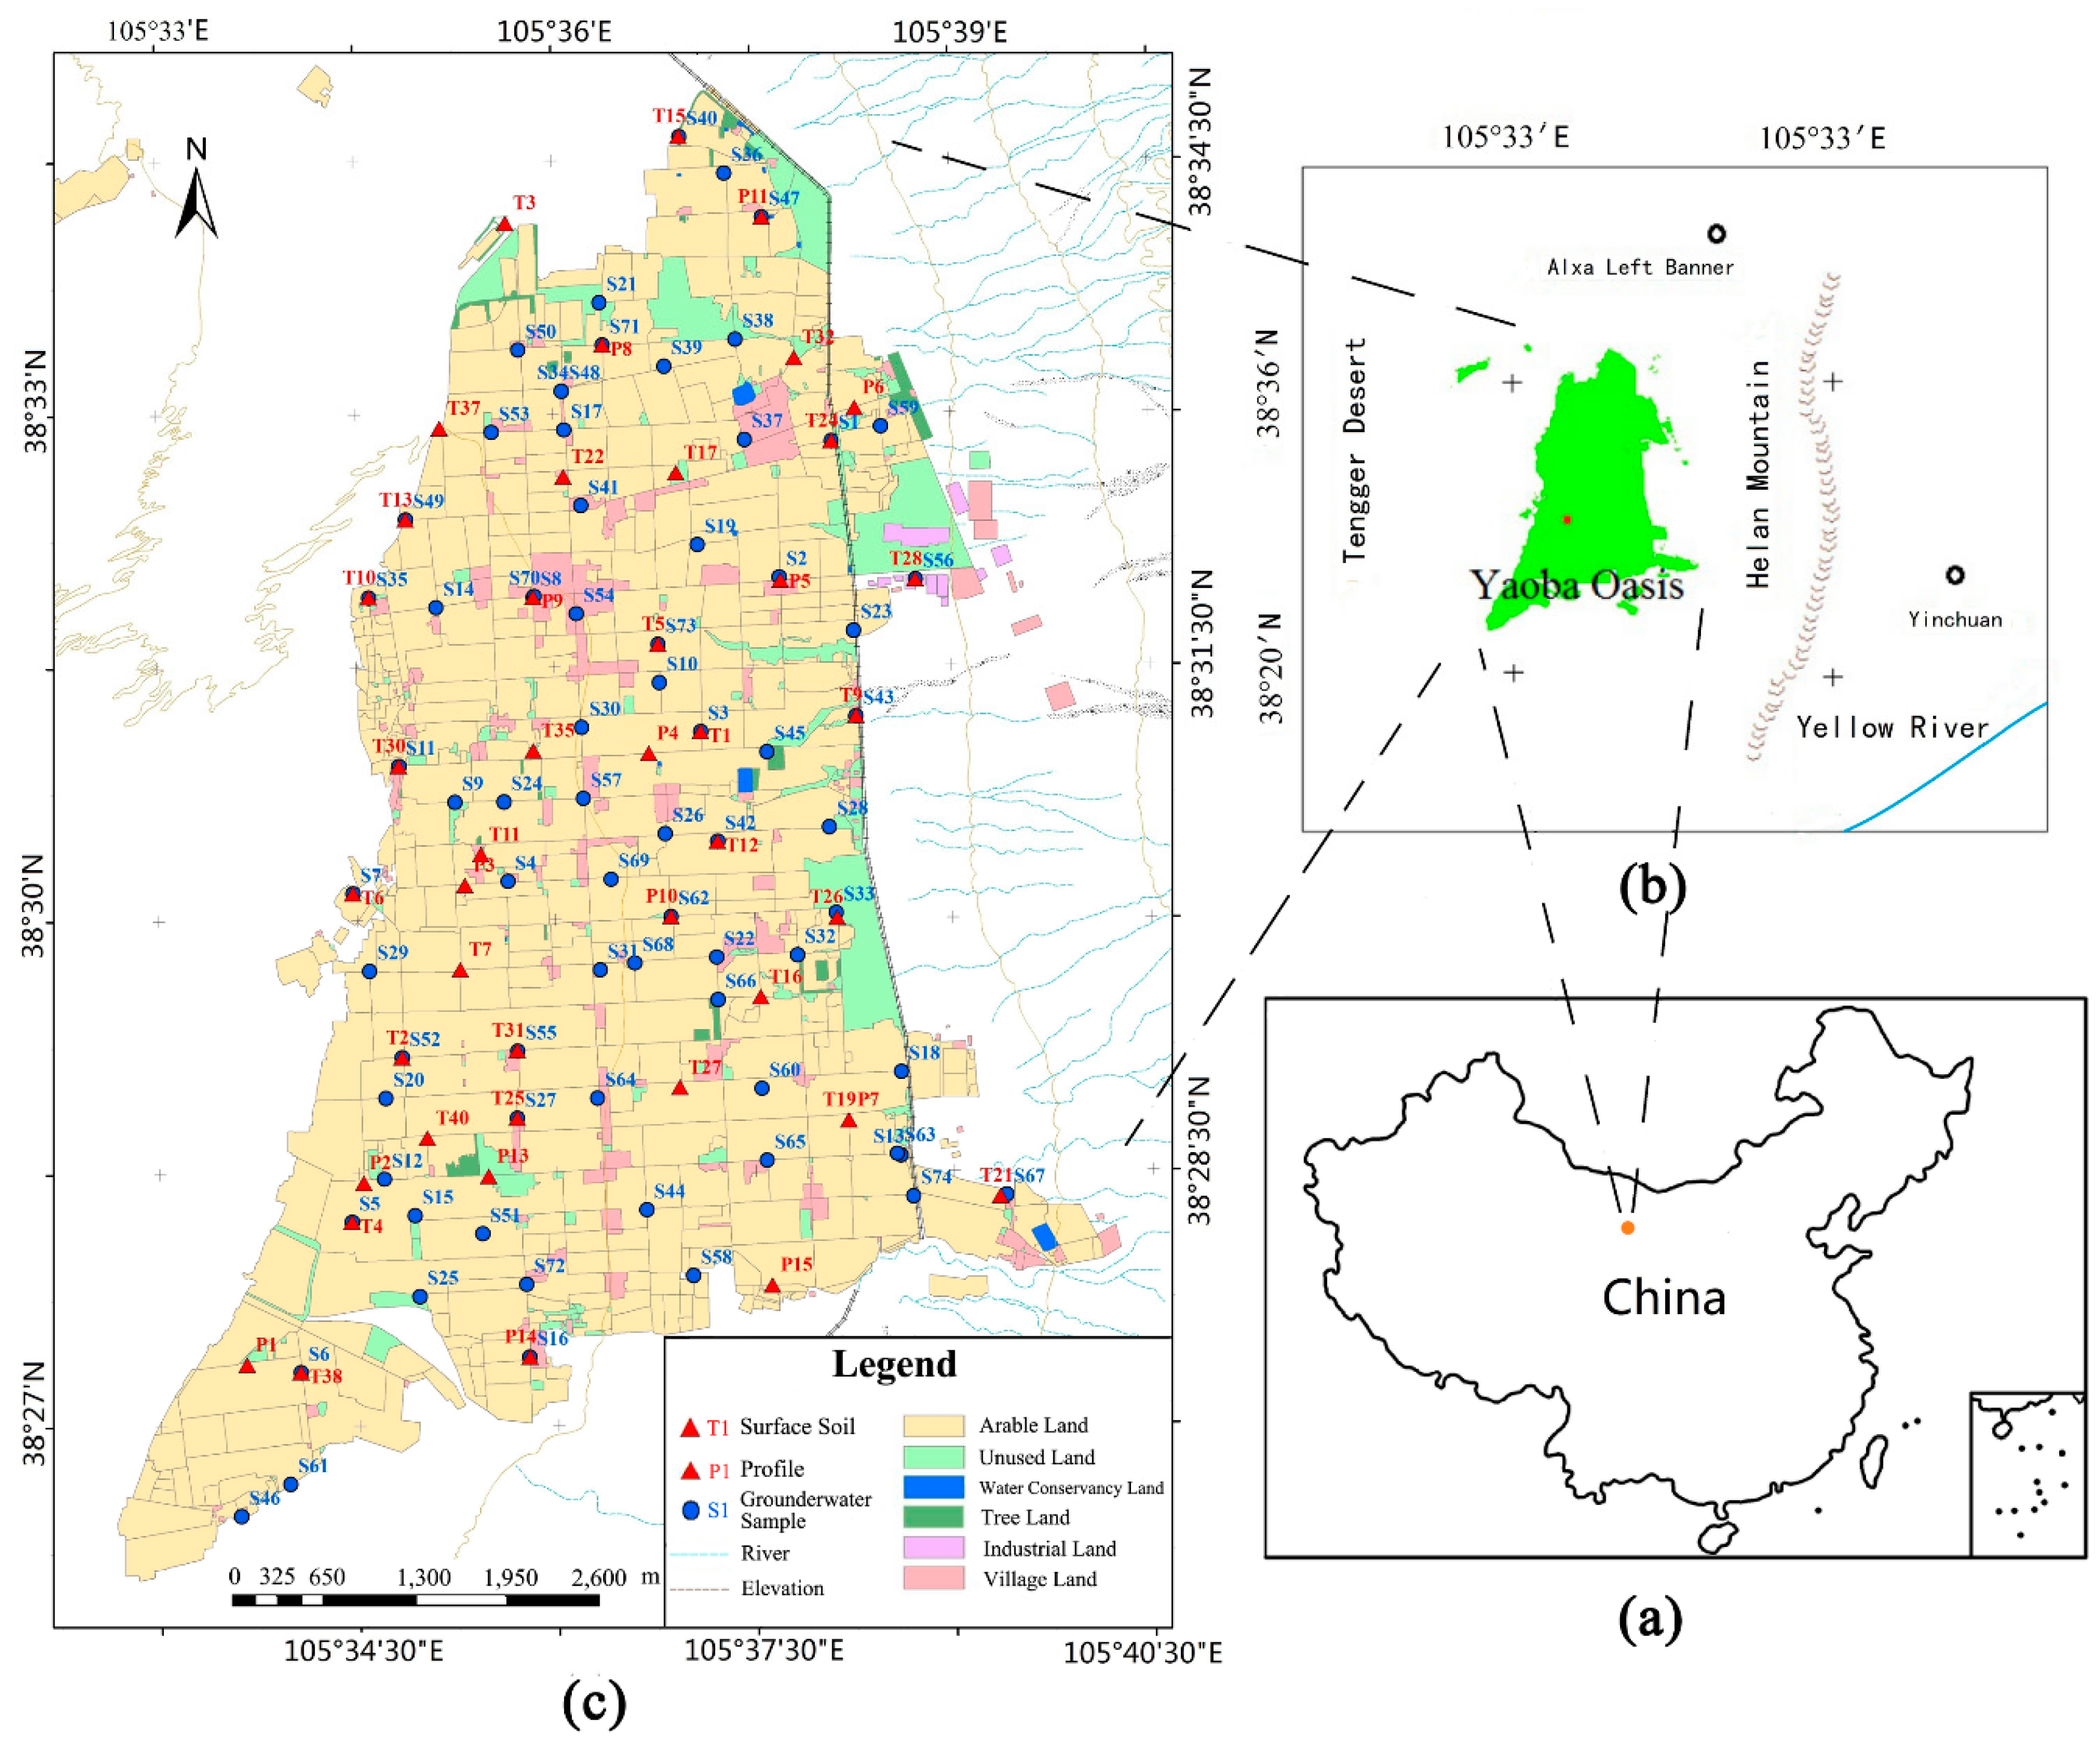
Yaoba Oasis (105°34′–105°39′ E, 38°25′–38°36′ N) is one of the few artificial oases in Alxa Plateau in Inner Mongolia, Northwestern China (Figure 1). Yaoba Oasis, which is located at the edge of the alluvial plain in front of western Helan Mountain, extends westward in the Tengger Desert with an area of approximately 81 km2 [35]. Yaoba Oasis is a traditional agricultural irrigation area in the Alxa Left Banner, which is a dustpan-type, close-flow basin [36]. The study area is characterized by sparse rainfall, typical continental arid climate, and considerable winds throughout the year. The maximum annual rainfall can reach 330.1 mm, the minimum annual rainfall is only 93.2 mm, and the average annual rainfall is 198 mm. Rainfall is mainly concentrated in July and September in the form of heavy rains and accounts for more than 65% of the annual rainfall. Winter rainfall is scarce, with monthly rainfall of less than 1% of the year. The rainfall from east to west shows a gradually decreased distribution. The annual rainfall in the eastern Helan Mountain area is more than 400 mm, and that in the western desert area is less than 150 mm [37].
Daytime sunshine is intense, with an average length of 7.7 h throughout the day, and the maximum number of hours of sunshine in summer can be as high as 13.6. The soil types in the area are mainly brown calcium (Ca2+), desert salt, and wind sand soils. The groundwater in the Yaoba Oasis irrigation area is mainly derived from the lateral recharge of precipitation in Helan Mountain. The groundwater in the irrigation area is deep (20 m on the average), and the mineralization of groundwater is relatively high, which generally ranges from 0.4–7 g/L. Yaoba Oasis is an underground water agricultural irrigation area. The average annual irrigation water is 900–1050 m3/km2, and the irrigation water mainly adopts the method of flood irrigation. A total of 375 wells exist in the 4653.3 km2 irrigation area. Four reservoirs with a total capacity of 710,000 m3 are present. The water source of the diversion project is mainly from the spring water of Helan Mountain with 11 places. In the northeast, east, and southeast parts of the irrigation area, a floodwall with a length of 29.9 km and a height of 3–5 m had been built.
2.2. Data Sources and Research Methods
2.2.1. Geological and Hydrogeological Setting
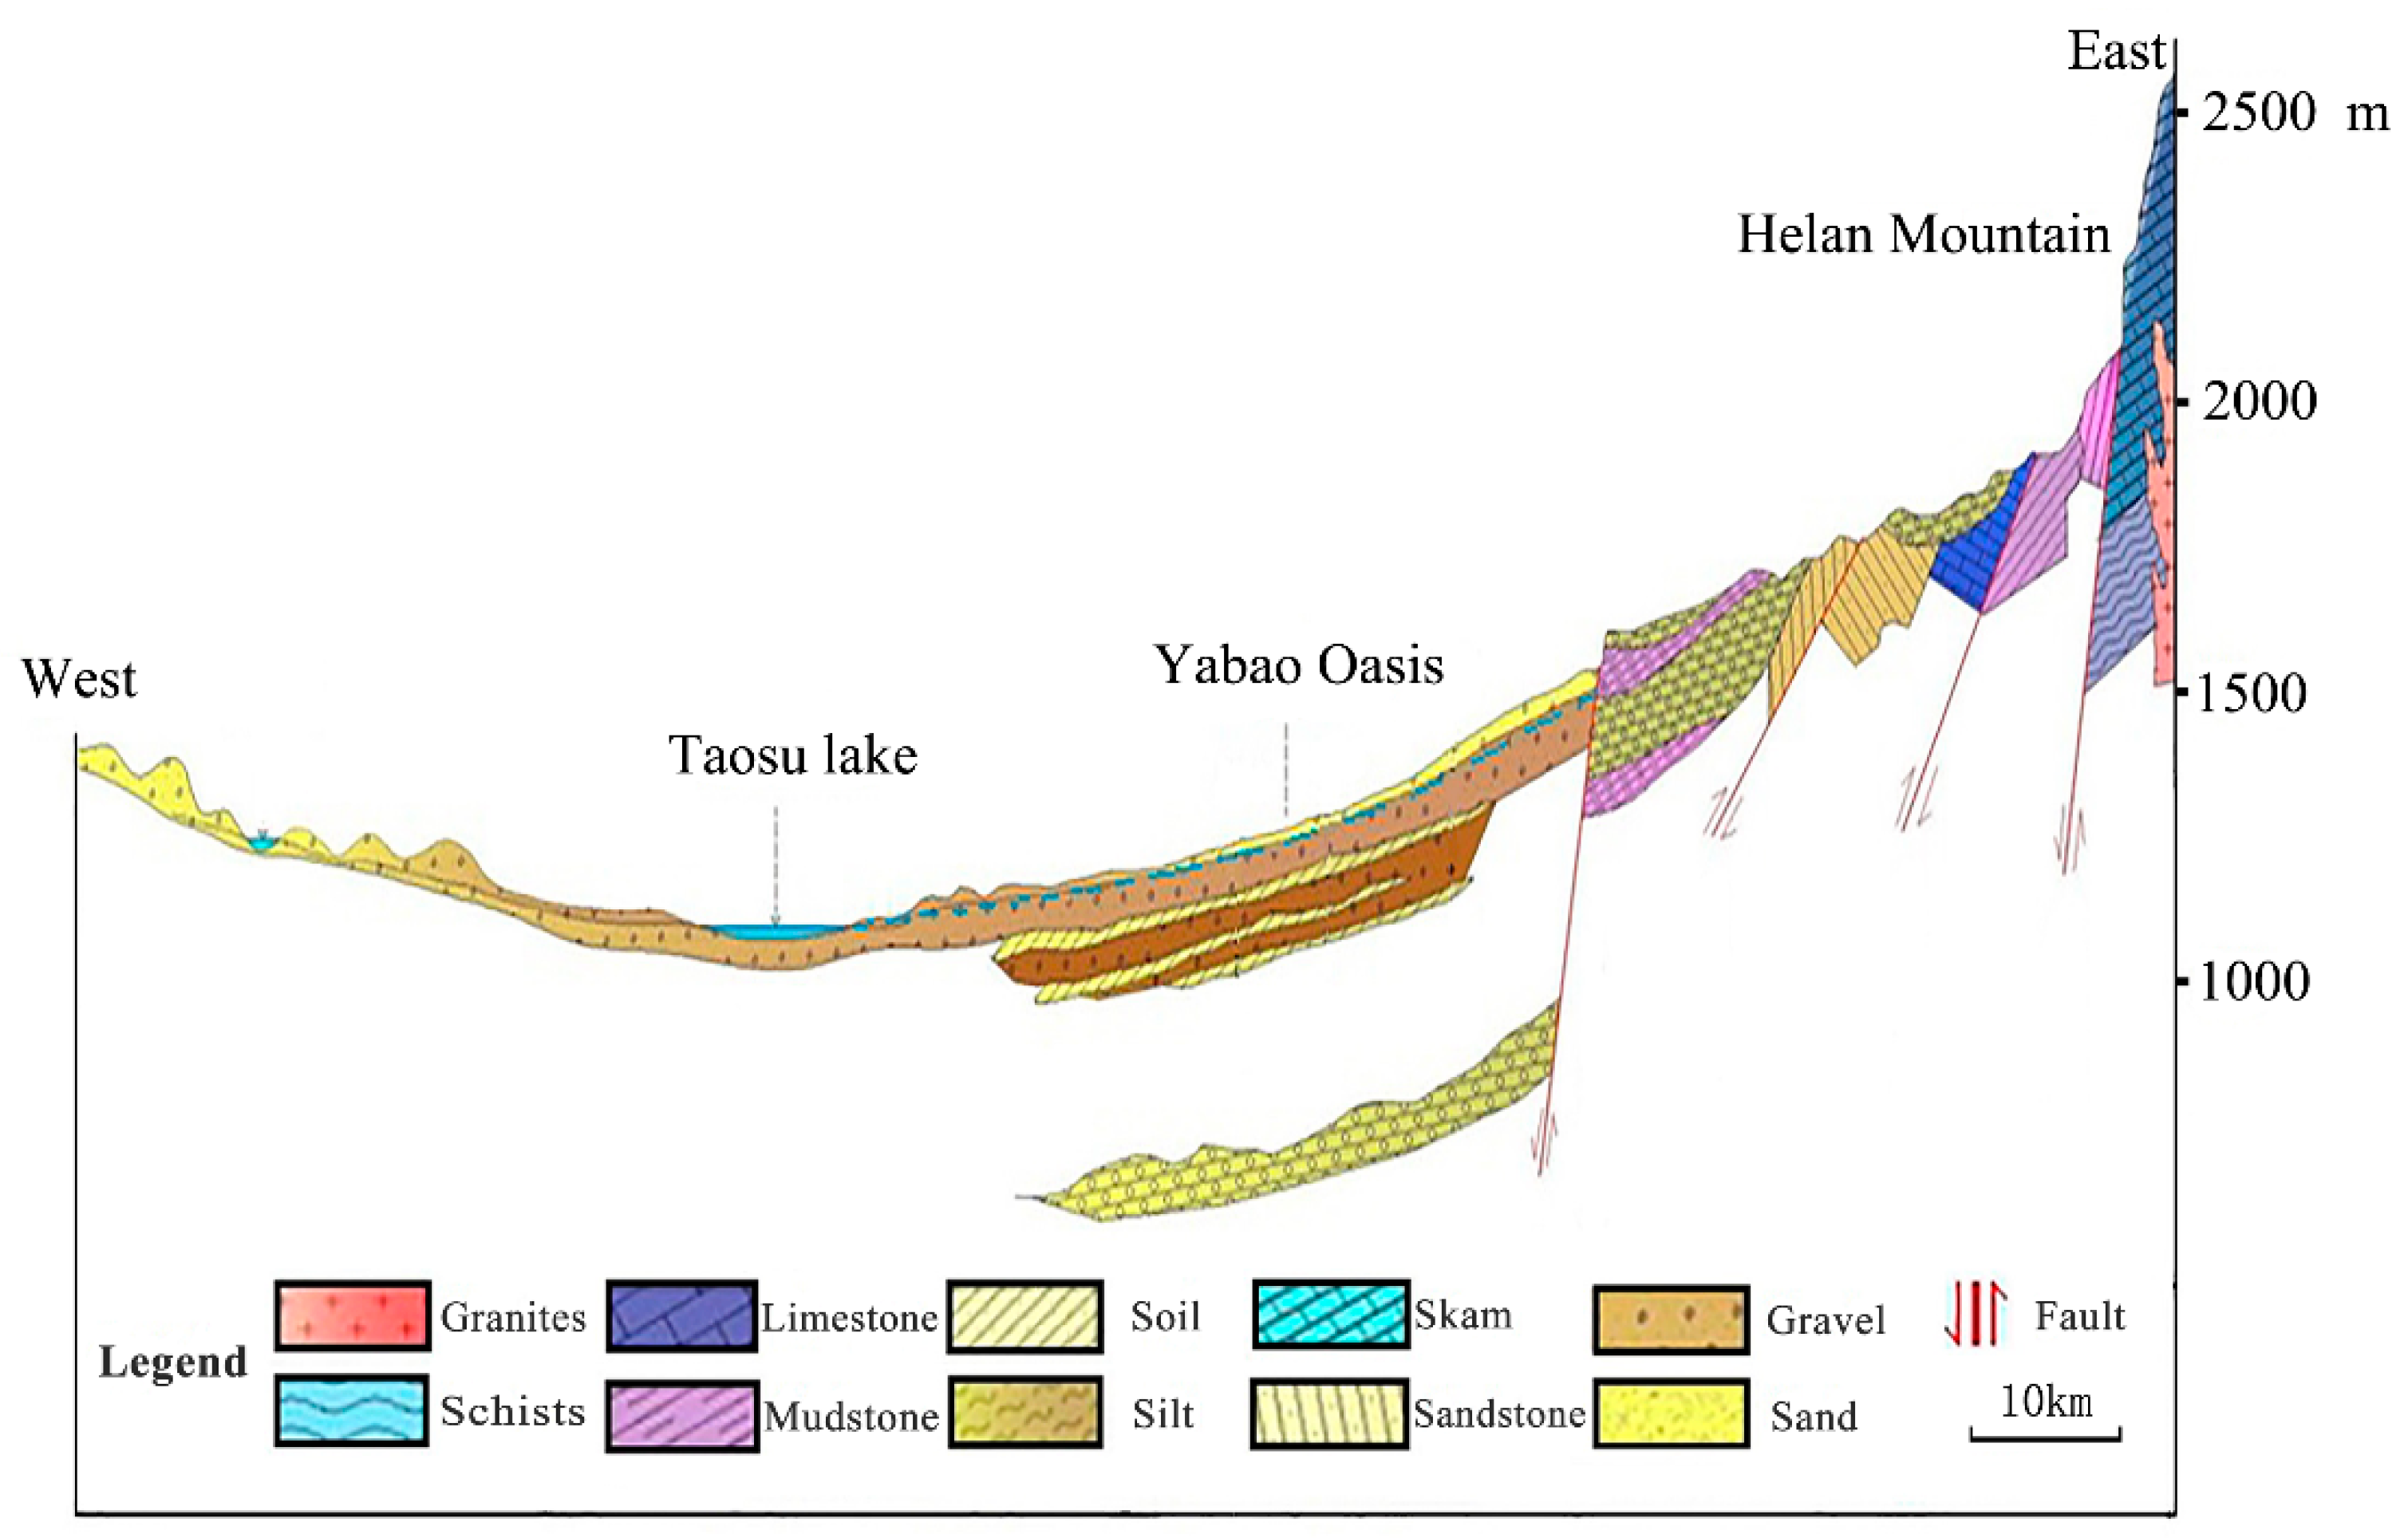
Figure 2 shows a schematic of the geological section. Yabao Oasis is located at the edge of the diluvial sloping plain on the western side of Helan Mountain. From east to west, the topography ranges from high to low and is controlled by the four north–south spreading faults of Helan Mountain. The terraced terrain decreases successively from the west side of Helan Mountain to the west side of the oasis, where mountains, platforms, fault basins, and deserts can be found. The lowest point of the oasis basin is on the southwest side of Taosu Lake. In summary, Yaoba Oasis is a dustpan-type, closed-flow basin. The curve shapes of six different observation wells in the oasis are roughly similar and have the same variation pattern. The curve variation can be divided into the following stages.
(a) From January to mid-March, the water level begins to rise after winter irrigation of previous years. The level is the highest in the year and stabilizes by March.
(b) The period from April to late August has the most intense groundwater utilization, and groundwater is mainly used for crop irrigation. At this time, the water level drops drastically with a variation in water level of up to 2.56–6.38 m.
(c) From late August to the end of September, groundwater extraction is performed mainly for autumn irrigation, which has a smaller water consumption than that in June and July. The water level rapidly increases, but the depth remains below normal levels.
(d) From the end of September to December, the water level recovers without irrigation, and the curve shows a continuously rising trend.
2.2.2. Experiments
Soil and groundwater chemical characteristics were used as the research objects, and field investigation, sampling, sample testing, and correlation analysis of each component were utilized to determine the distribution of area soil salinity and the relationship between groundwater and soil salinity.
(1) Layout of sampling points
(A) Soil sample collection scheme
Remote sensing images and GPS positioning were used to design and implement the distribution of soil sampling points. The sampling points should be arranged uniformly. The spacing between soil sampling points should be approximately 1.8 km. A total of 197 soil samples were collected throughout the region, and these samples included 44 surface soil samples and 135 section samples from 15 typical profiles (0–10 cm, 10–20 cm, 20–30 cm, 30–40 cm, 40–50 cm, 60–80 cm, 80–100 cm, 100–120 cm, and 120–140 cm).
(B) Groundwater sample collection scheme
The groundwater sampling points should be distributed evenly according to the location of the wells. The groundwater extracted from the study areas mainly originated from the second water-bearing rock group of the quaternary system. The depth of wells is more than 100 m, and the extracted water samples were all confined water. Seventy-four groups of water samples were collected, and the spacing between the samples was approximately 1.1 km.
(2) Collection and testing of sampling points
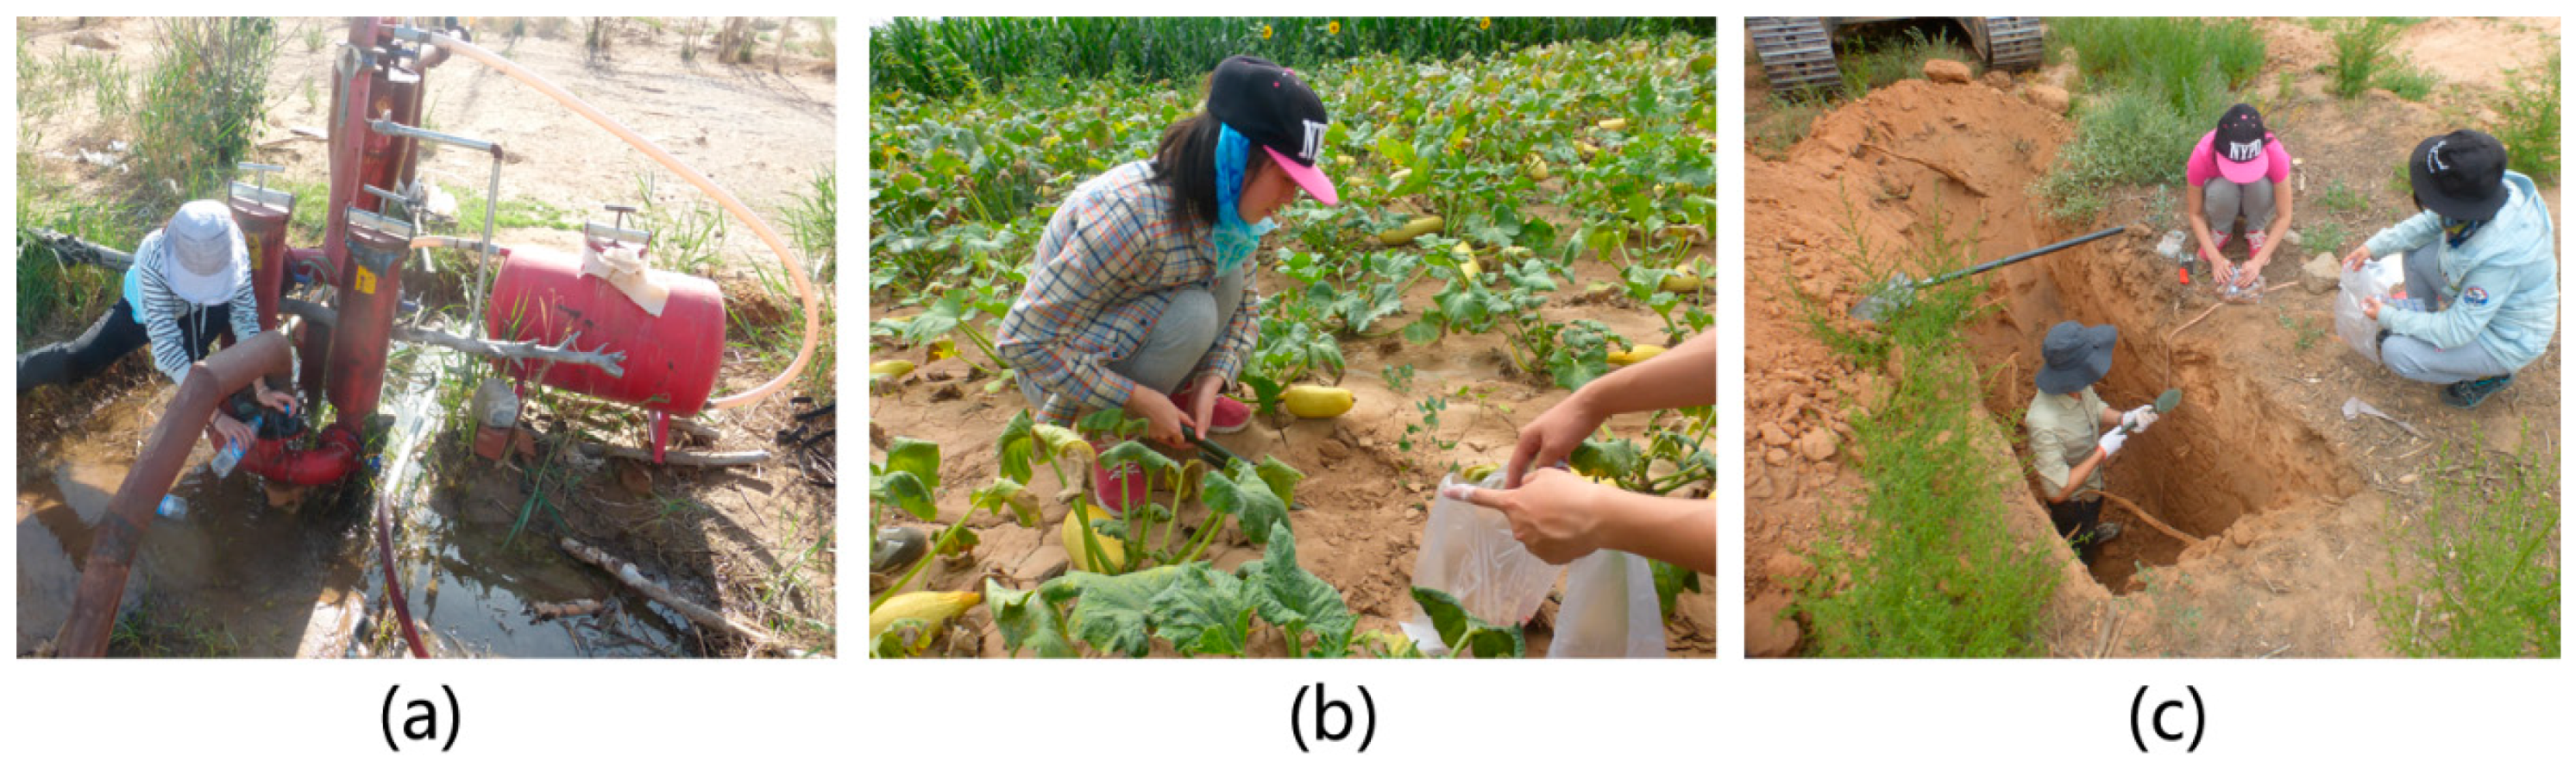
The sampling time was from 13 to 17 June 2016 and 10 to 23 November 2016, as shown in Figure 3.
The sampling method for groundwater was based on the “Water Quality Sampling–Technical Regulation of the Preservation and Handling of Samples” (HJ493-2009). Two bottles of 500 mL water were collected from each sampling point, and pH and free carbon dioxide were measured simultaneously. All of the groundwater characteristics of collected samples were measured within 15 days.
The sampling method for soil was based on “Agrology” [38]. Approximately 500 g of soil was collected and labeled in each sampling point. In the laboratory, the soil samples were placed in a well-ventilated place for natural air drying. The drying soil samples were transported to the laboratory for grinding and 2 mm screening experiments. A soil water-leaching solution with a mass ratio of 1:5 was prepared for all samples. Soil and groundwater properties (e.g., eight ions, pH, and total salt content) were measured using the methods provided in “Agrology.”
2.2.3. Data Processing Method
The data were processed and screened in Excel on the basis of the chemical analysis results. The data arrangement and combination were set with two decimal points. Descriptive statistical analysis is included in the analysis tool module of the Statistical Package for the Social Sciences software, which was applied for chemical statistical characteristic and correlation analysis.
We developed an application for gray comprehensive correlation degree calculation. Standardized data processing was conducted, and gray correlation analysis with standardized data was performed with the GM software according to the theory introduced in Section 2.2.4.
Geographic information systems provide many spatial analysis tools. For the sampling point data with a spatial distribution characteristic, interpolation analysis was performed to form a regional map. The contour line was drawn with ArcGIS software (ArcGIS 10.3, Esri China Co. Ltd., Beijing, China).
A hydrochemical map can directly show the chemical characteristics of water [39,40]. A piper trilinear diagram is composed of two triangles of the anion in the lower part and a diamond in the upper part; it was used in this study to build a hydrochemical map of groundwater.
The soil profile characteristics of different soil layers with different soil salinity distributions are affected by climatic, geological, hydrological, and human activities [41]. To examine the variations in salt content of distinct layers, soil profile types were analyzed in this work by conducting a Q-cluster analysis with the hierarchical clustering method. The salt accumulation conditions in different soil layers were found to be diverse on the basis of the result of the difference in groundwater quality and soil mechanical composition in the study area.
2.2.4. Gray Correlation Analysis
The main idea of gray correlation analysis is to determine the primary and secondary factors within complex, limited, and irregular data by establishing a continuous differential mathematical model [42,43]. The gray correlation degree between geometric shapes is high when the similarity degree between elements is high; otherwise, the gray relational degree is low [44,45]. This method can be divided into five steps.
First, the analysis series is determined. The data series that reflects system behavior is called the reference series (or parent series), which is given by Equation (1).
The data series that consists of factors that affect system behavior is called the comparison series (or subsequence), which is given by Equation (2).
Second, the data are handled non-dimensionally. The variables should be handled dimensionlessly to compare the data of various factors. Differences in physical meanings exist due to the inconsistency of data attributes between feature and related factor sequences. If the dimensional data are calculated by force without processing in gray relational degree calculation, then large errors will be generated, resulting in calculation inaccuracy. Dimensionless processing of each index is required to avoid affecting the accuracy of the results due to the difference in dimensionality. In this study, the mean value-processing technique was adopted for such a purpose, as shown in Equation (3).
where i = 1,2,…,n.
Third, the absolute correlation coefficients of and are calculated as follows:
where |S0|, |Si|, and |Si − S0| are expressed as
Fourth, the relative correlation degree is calculated from the following aspects.
(1) Relative correlation degree matrices and with and are calculated (each component of the sequence is divided by its corresponding first component) as follows:
(2) The image of the zero starting point of is calculated, followed by ||, ||, and ||. The relative gray correlation between X0 and Xi denoted as r0i is calculated, as shown in Equation (9).
Fifth, the comprehensive relationship degree is calculated.
The comprehensive relationship degree is calculated based on the result of absolute and relative correlations and is denoted as .
In general, the value of θ is 0.5, as suggested in literature [13].
3. Results and Discussion
3.1. Chemical Characteristics of Groundwater and Soil Salinization in Yaoba Oasis
3.1.1. Chemical Characteristics of Groundwater
Seven types of ions, namely, potassium (K+), sodium (Na+), Ca2+, magnesium (Mg2+), sulfate (SO42−), chloride (Cl−), and bicarbonate ions (HCO3−), are widespread and abundant in this area. The content of these ions accounts for more than 90% of all dissolved salts and is directly used to determine the chemical type of groundwater.
During the spring irrigation period in June, pH is 6.81–7.99 with an average value of 7.71, which belongs to weak alkaline water. The total dissolved solid (TDS) has a large variation range of 581.4–5845 mg/L, and the mean value is 1683.81 mg/L. The variation range of electrical conductivity is 0.74–5.79 ms/cm, which is consistent with that of TDS. During the winter irrigation period in November, the mean value of pH is 7.72, and the variation in TDS is relatively large. Compared with the water samples in June, the pH is basically unchanged. However, TDS slightly increases from 1683.81 mg/L to 1994.70 mg/L.
The statistical characteristic of the groundwater hydro-chemical parameters shown in Table 1 has a large variation coefficient, indicating that groundwater has large spatial variability. This large spatial variability is caused by many influencing factors, such as aquifer water quality, topography, geomorphology, hydrology, meteorological conditions, and human activities.
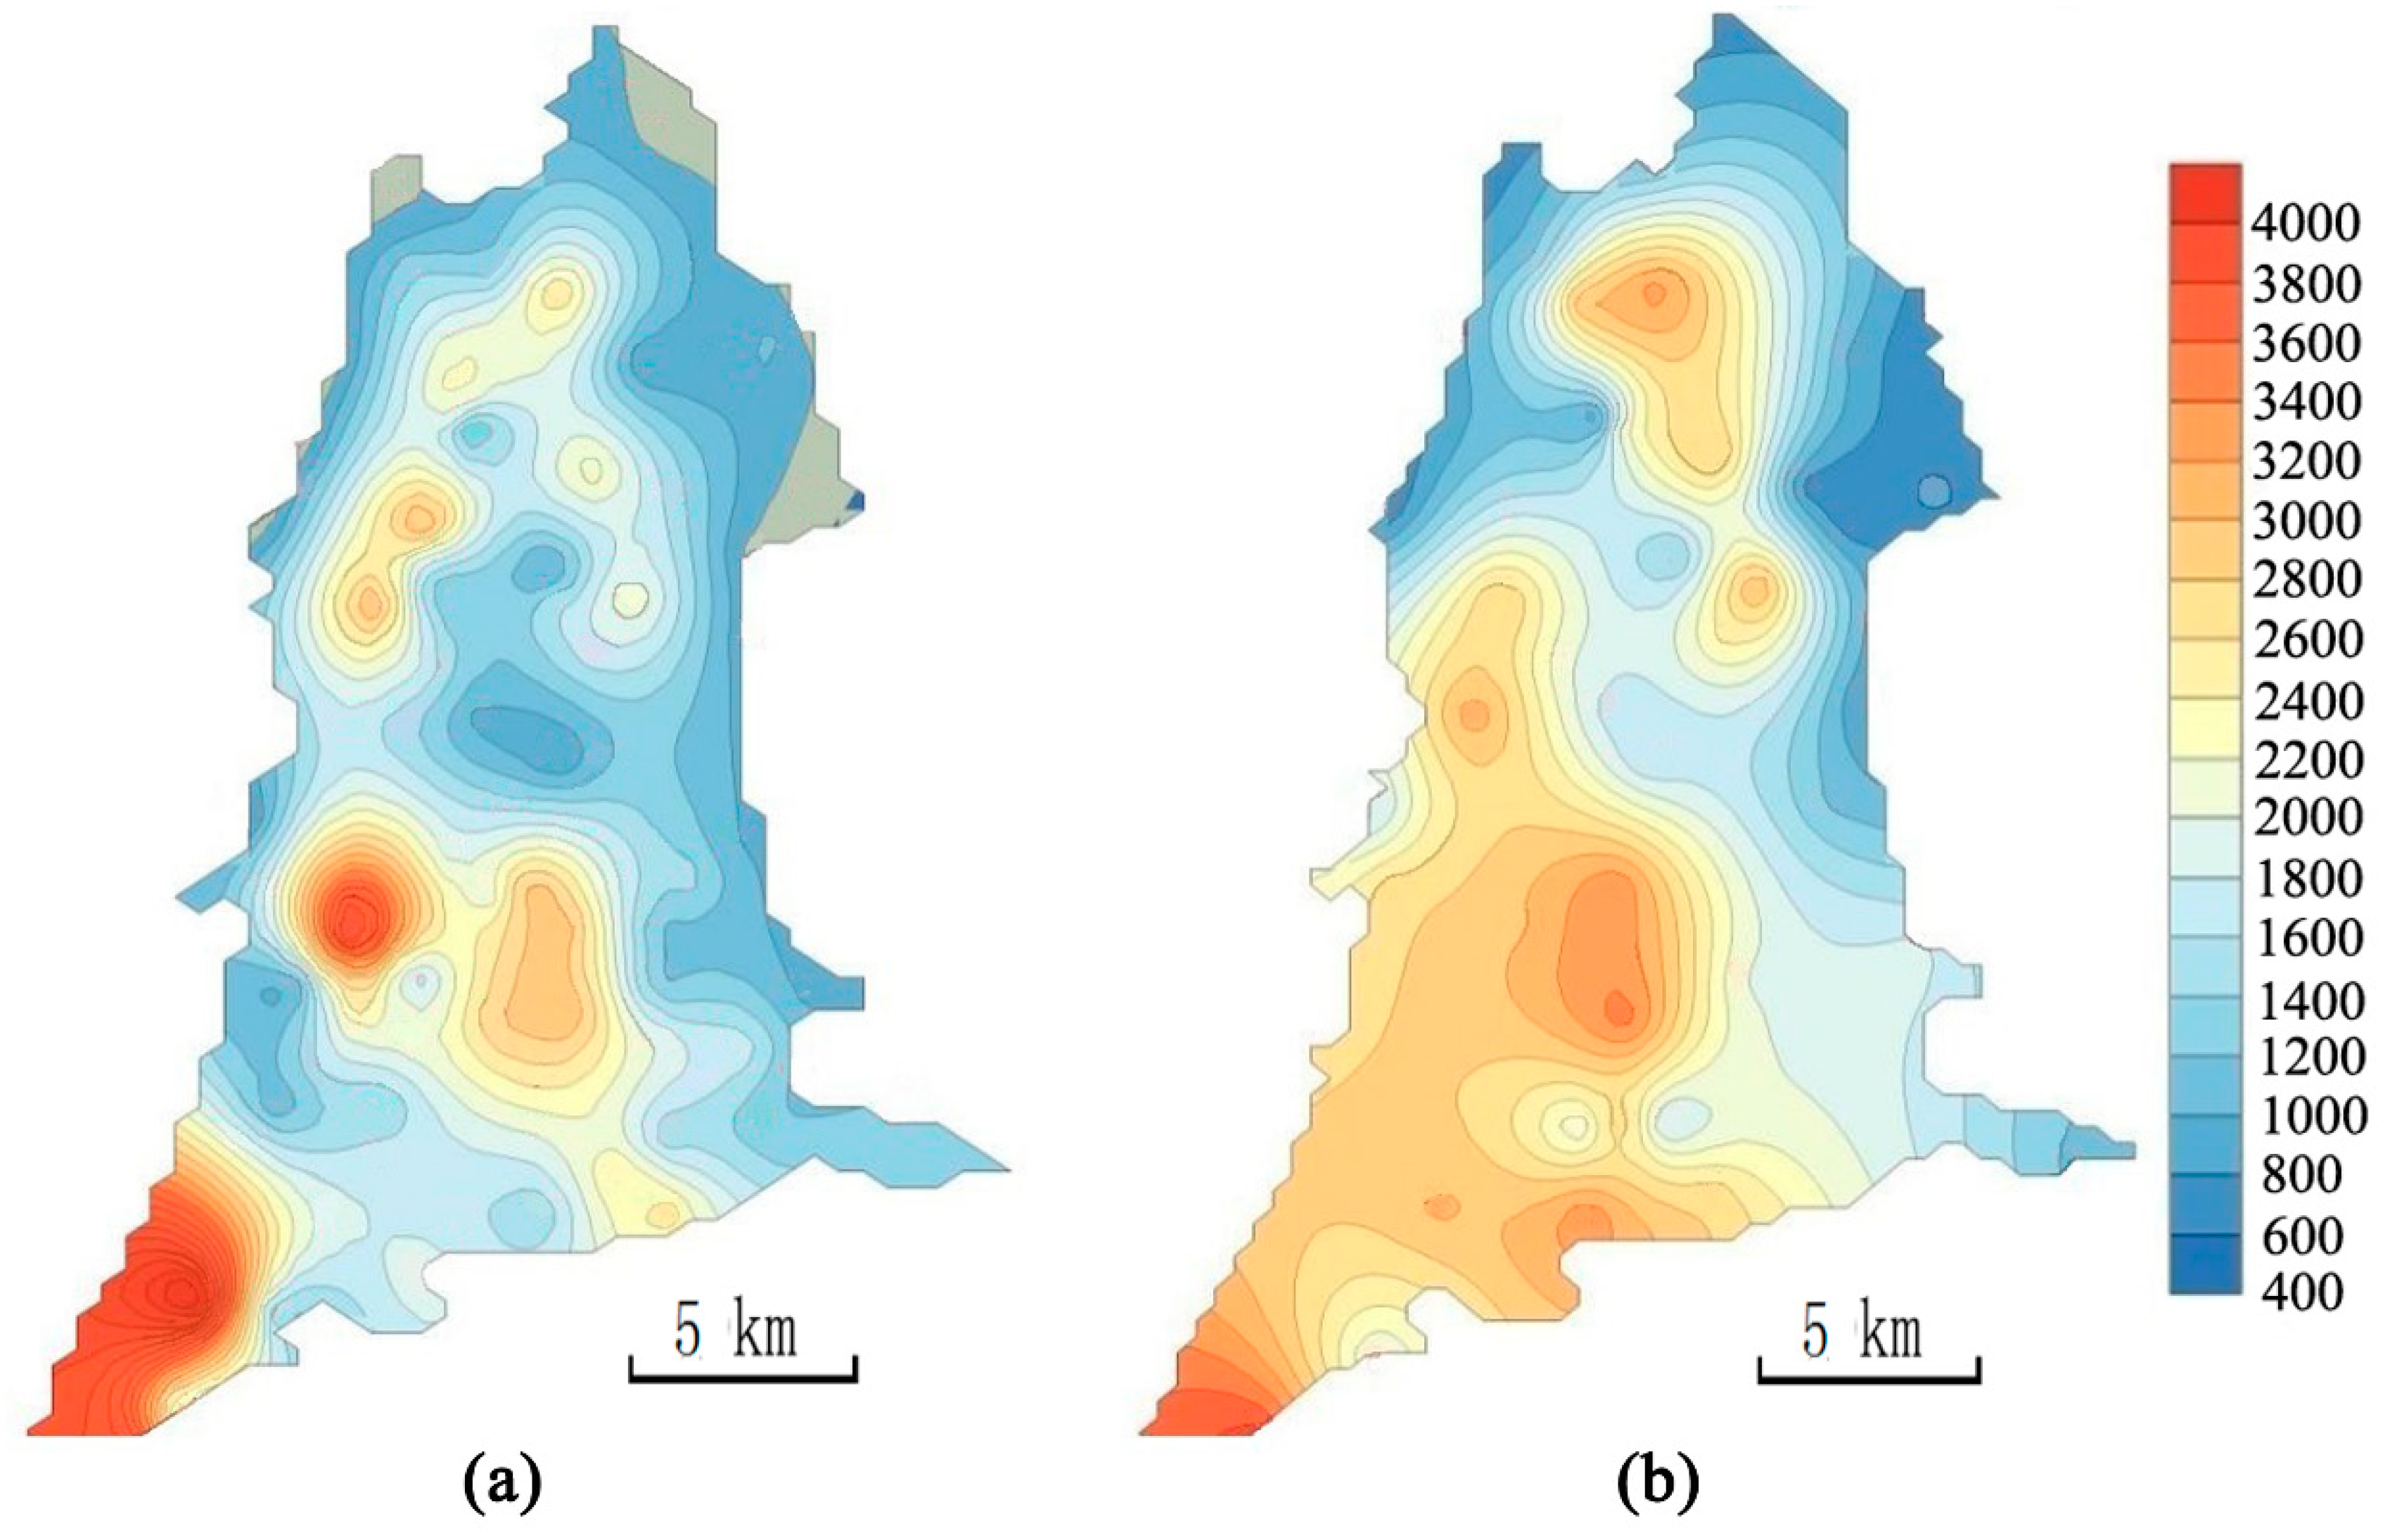
Figure 4 describes the spatial variability of the groundwater distribution of TDS in different periods. In this map, the region in the horizontal space mainly shows a gradual change from northeast to southwest, indicating that the salt content in the northeast is relatively low and that groundwater runoff flows from northeast to southwest.
In addition, Figure 4 shows that compared with the conditions in spring, the area of groundwater with TDS < 1000 mg/L (fresh water) in winter decreased, whereas the area of TDS > 3000 mg/L (salt water) increased. However, the area with an extremely high TDS value in Taosu Lake in the southwest region decreased to the southwest direction. The area of brackish water in groundwater increased remarkably, and TDS still showed an increasing trend from northeast to southwest in the entire region. Compared with the spring irrigation period, the amount of mining underground wells in Yaoba irrigation area decreased considerably in winter. The groundwater runoff, the water–rock interaction of groundwater, and the alternation of substances in water were slow in winter, resulting in a relative increase in groundwater TDS.
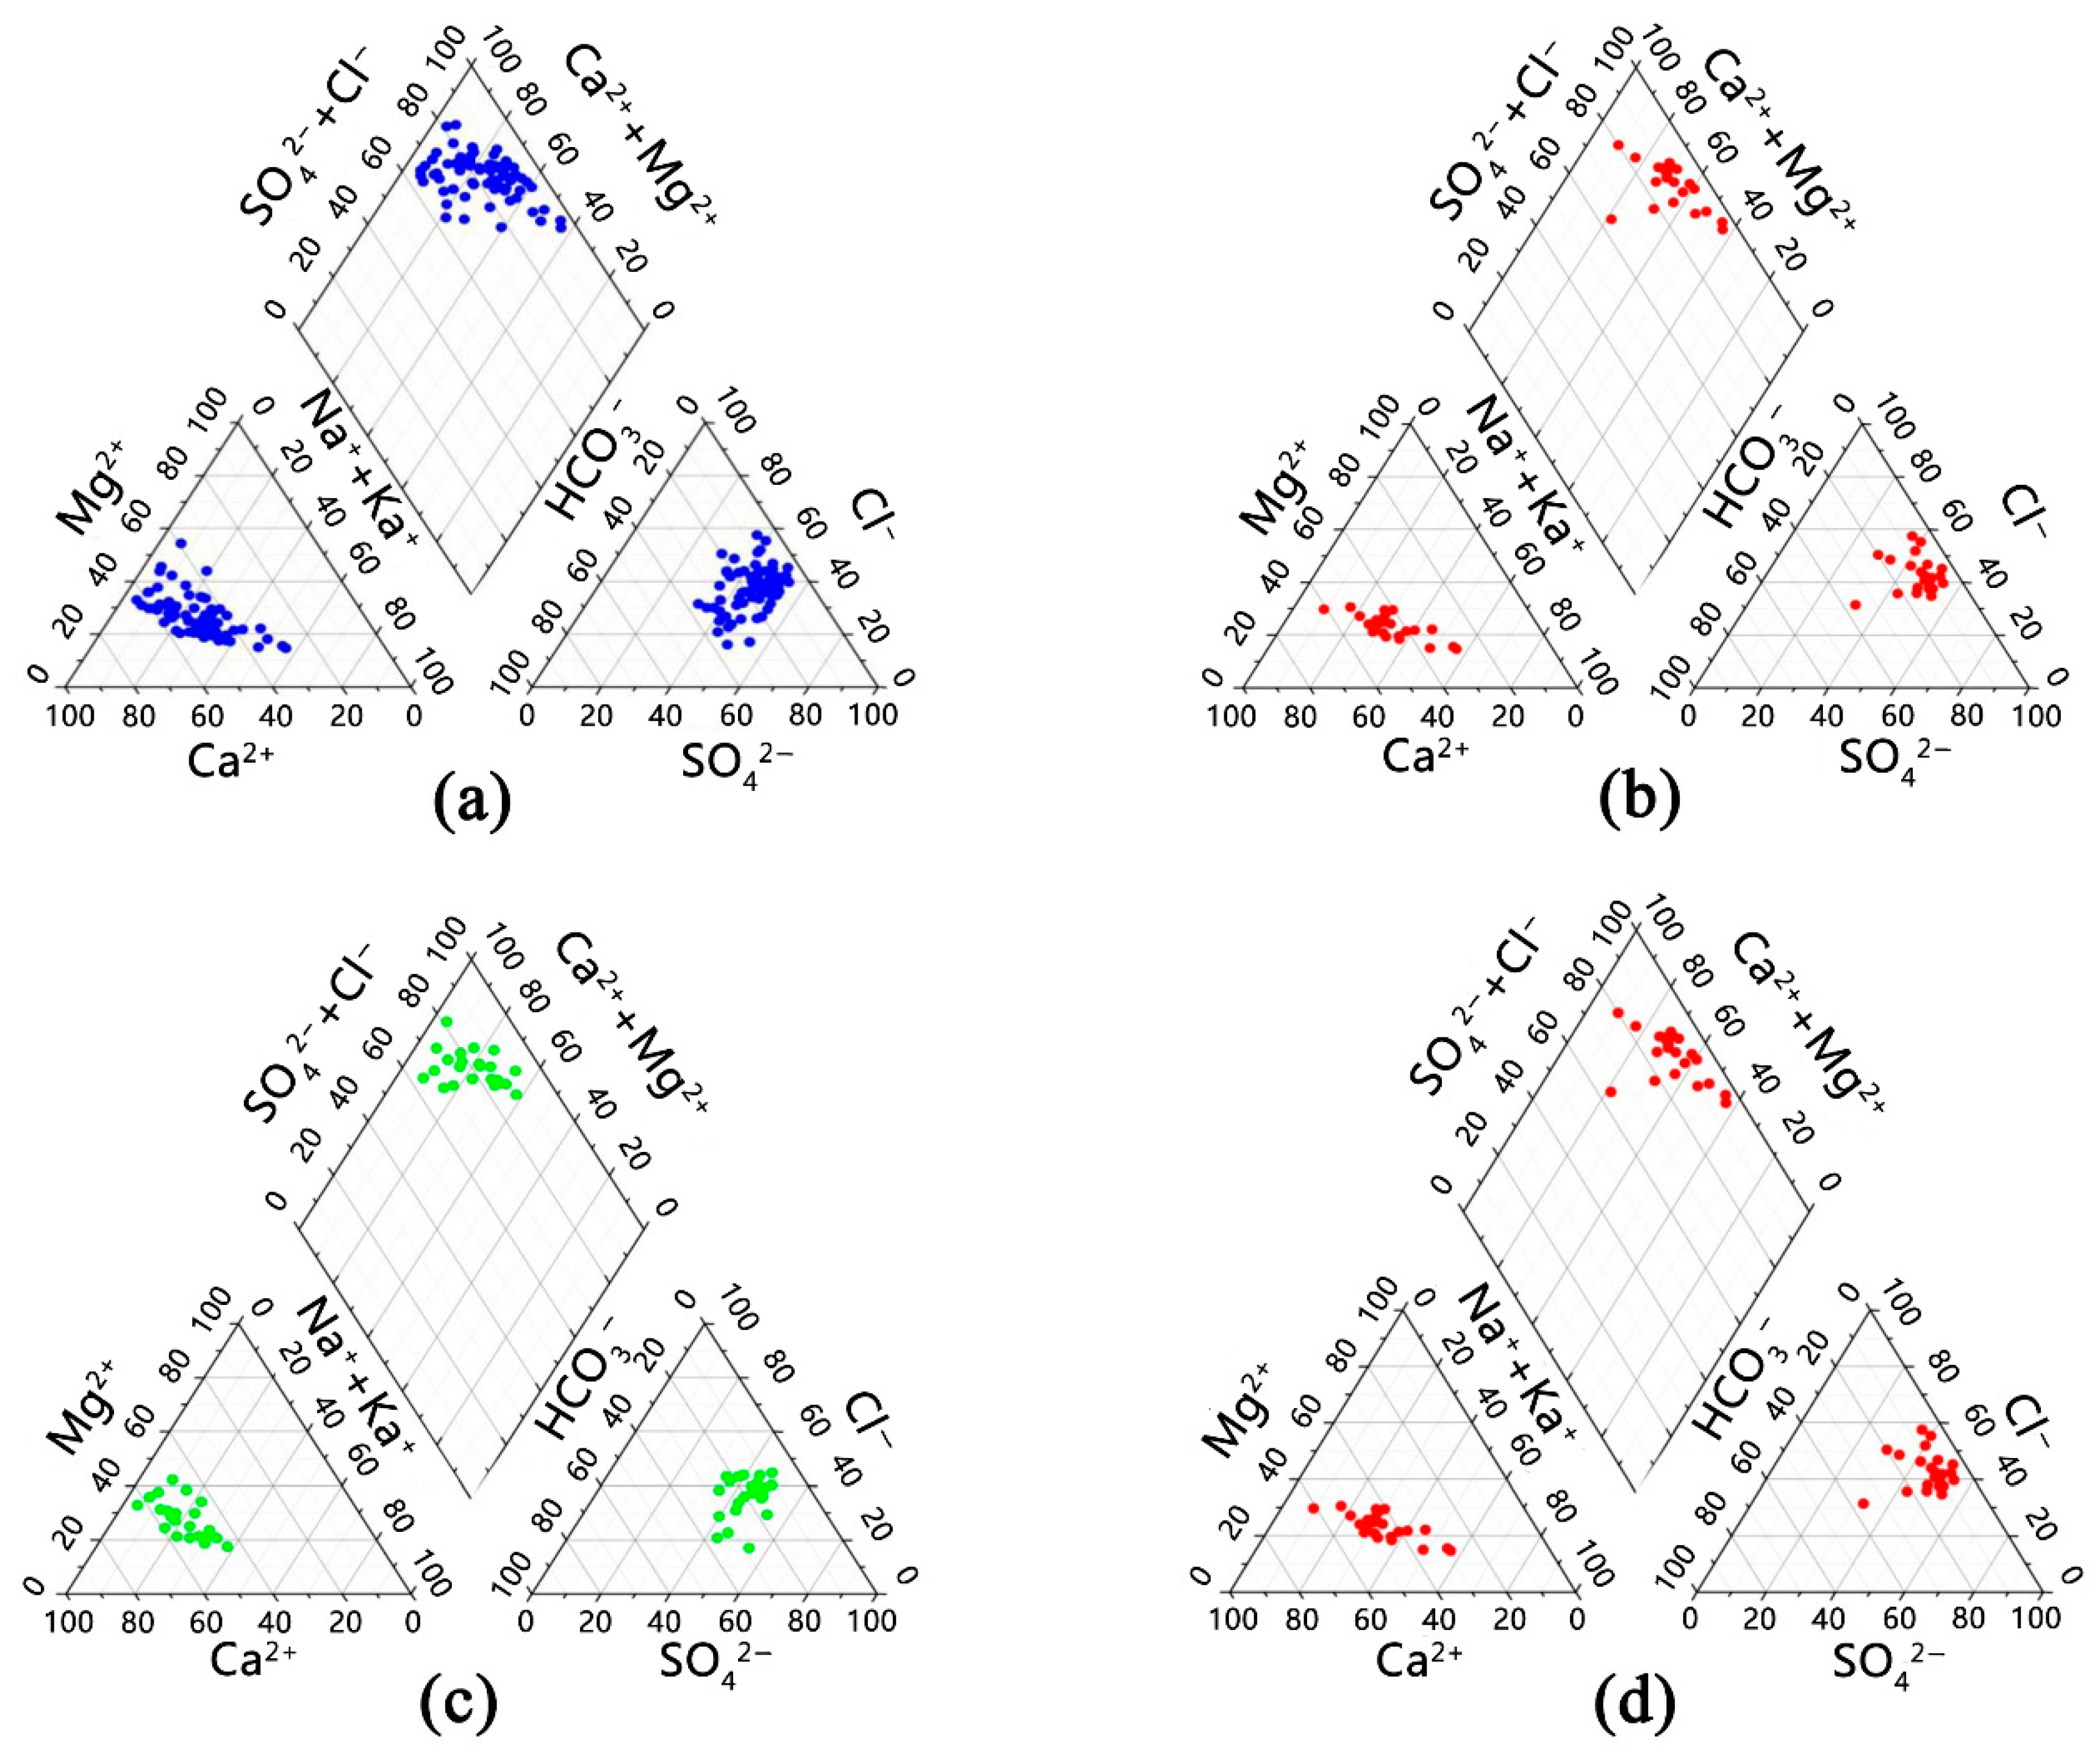
The piper trilinear diagram of spring groundwater chemical data was drawn and is shown in Figure 5a. The chemical components of groundwater in the study area were diverse and mainly included Cl·SO4−Na·Mg, Cl·HCO3·SO4−Na·Mg, and Cl·SO4−Na. Along the groundwater runoff direction (from northeast to southwest), the variation in groundwater chemical types, as shown in Figure 5b–d, was complicated. It was mainly from HCO3·SO4−Na·Mg type to Cl·SO4−Mg·Na and Cl·SO4−Na types. Therefore, the groundwater in the northeast was mainly of HCO3·SO4−Na·Mg type, the middle area was mainly of Cl·SO4−Mg·Na type, and the southwest was Cl·SO4−Na. Different groundwater chemical components may have different effects on the soil.
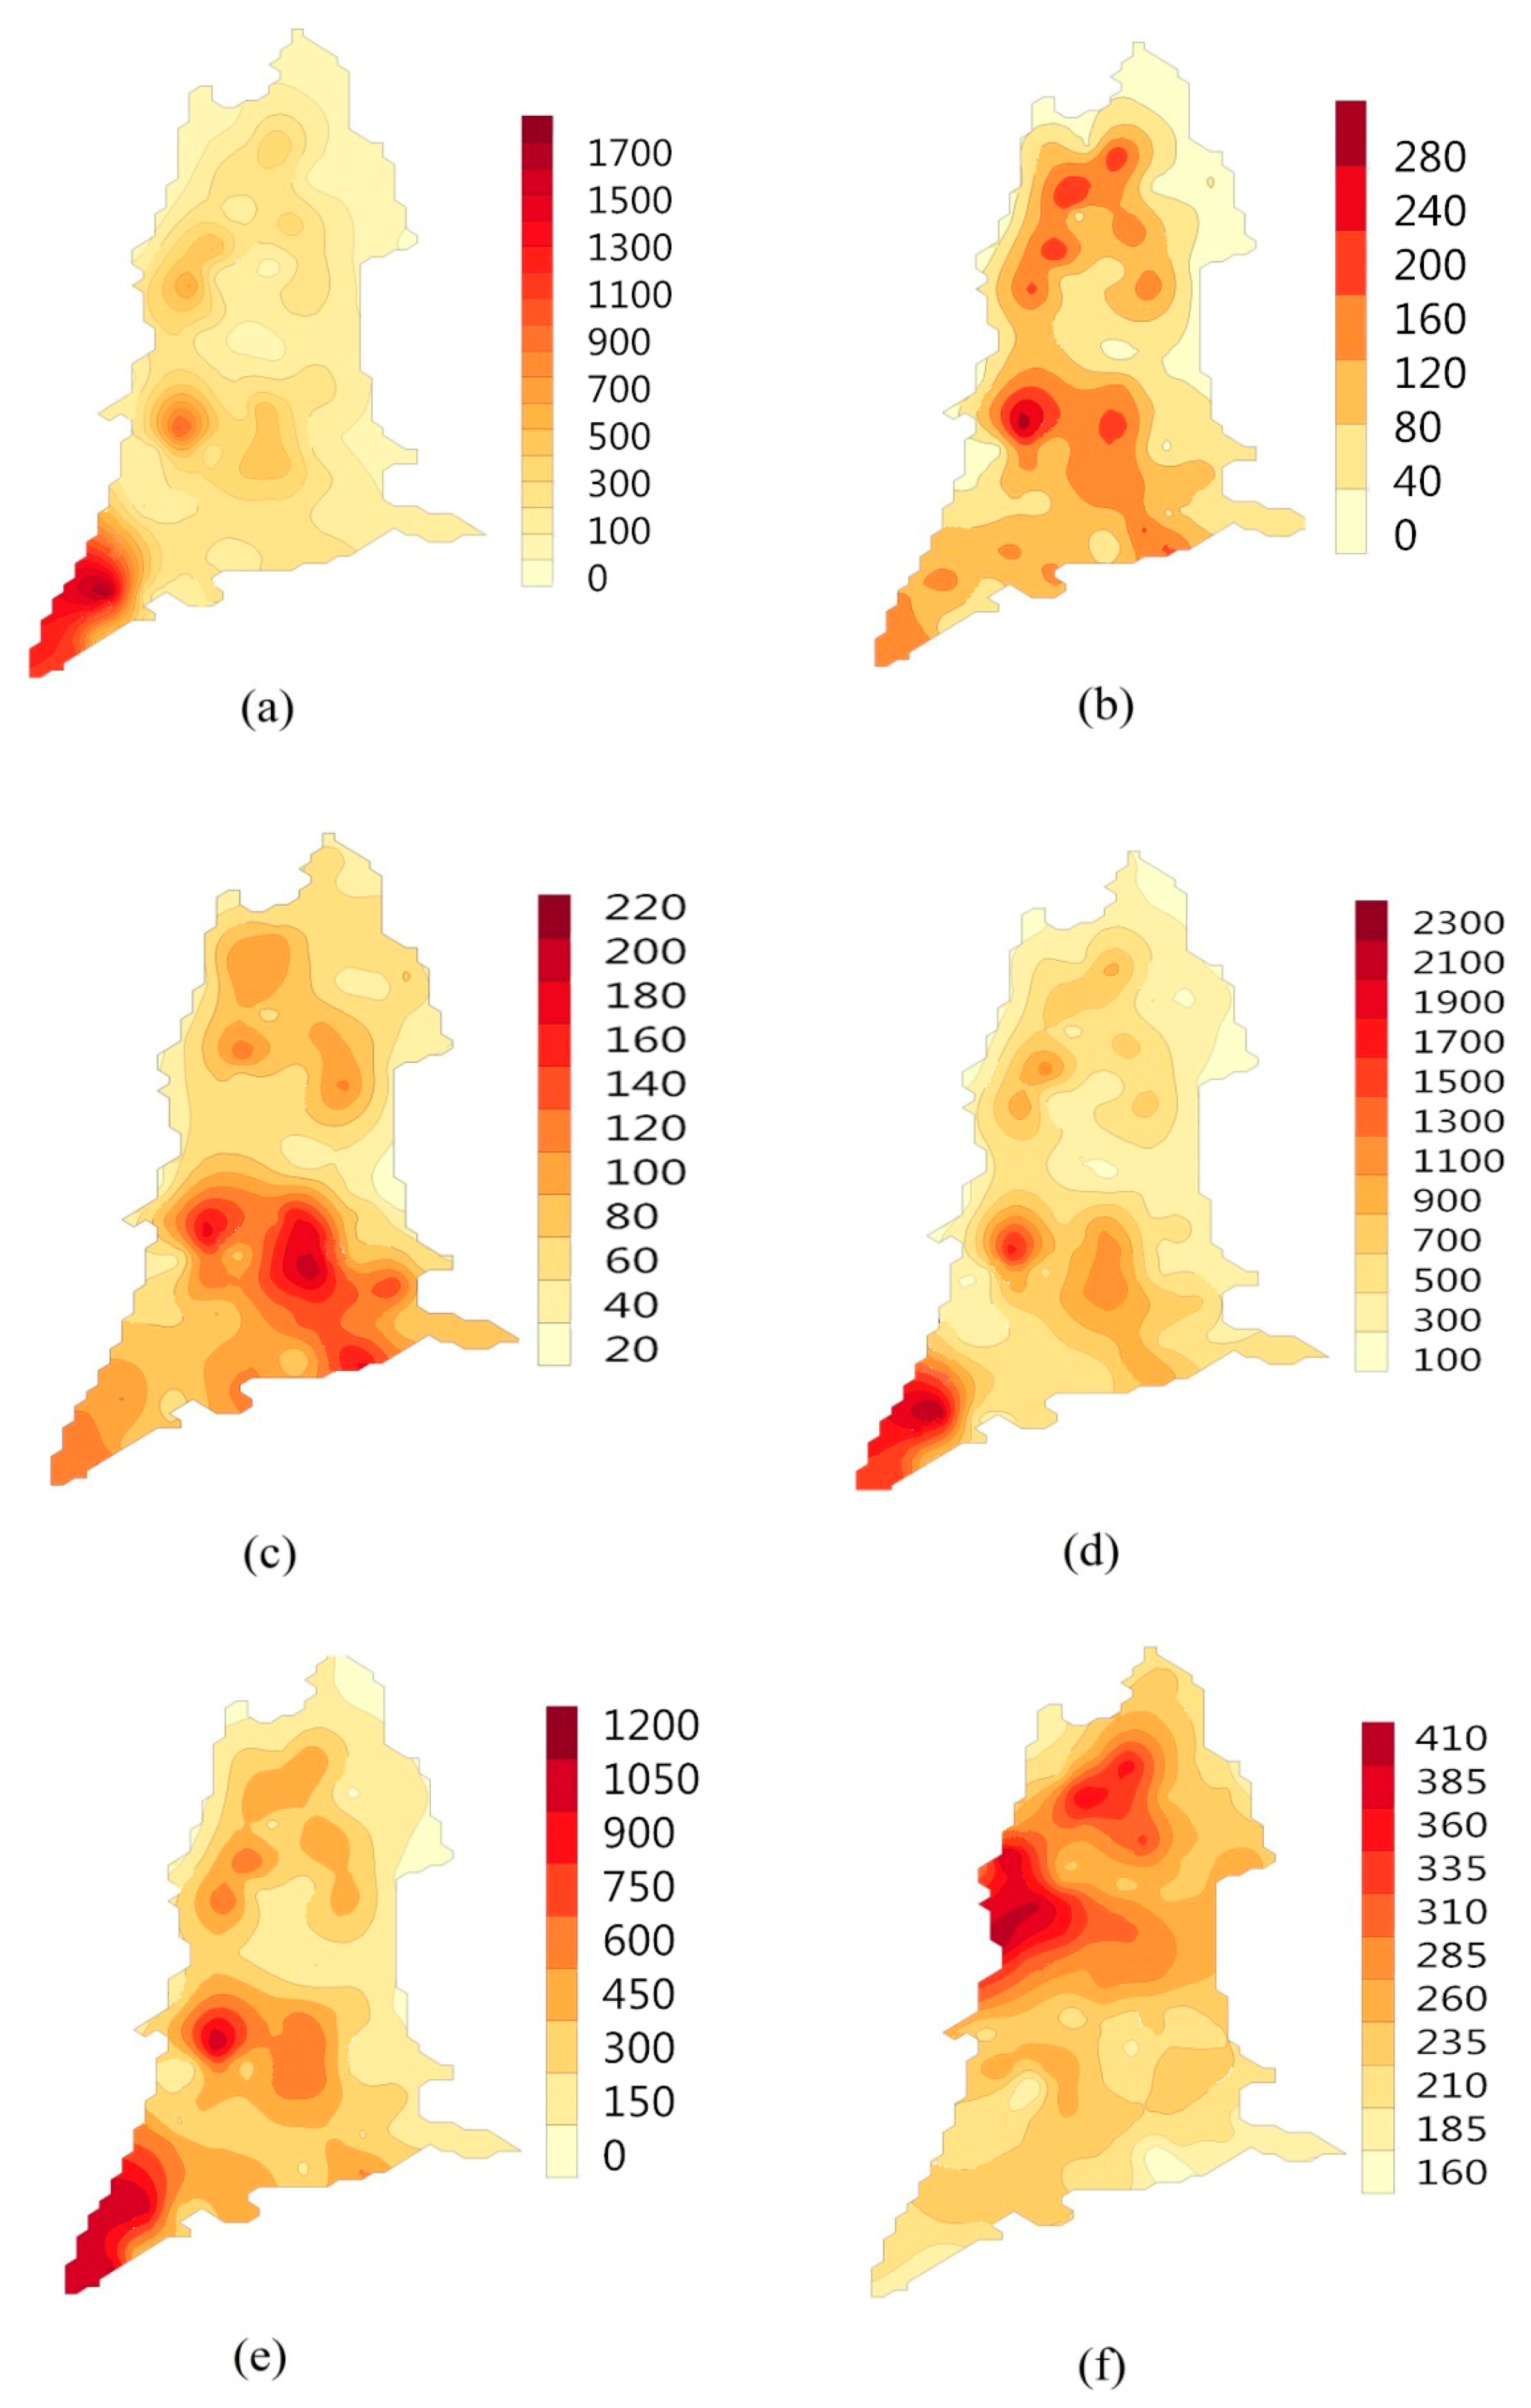
Contour maps of the main components of groundwater in the entire area were drawn using ArcGIS 10.3 software through a difference analysis, as shown in Figure 6. The value of Na+ + K+ decreased from southwest to northeast of the study area, as shown in Figure 6a. The middle area had a relatively higher value of Mg2+ than the other areas, as shown in Figure 6b. The variation in Ca2+ was similar to that in Mg2+, as shown in Figure 6c. The spatial distributions of SO42− and Cl− were similar to that of Na+ + K+, as shown in Figure 6d,e. The ion HCO3− had the same spatial distribution as Ca2+ and Mg2+, as shown in Figure 6f. The spatial distributions of the main components of groundwater revealed the region’s groundwater types.
3.1.2. Characteristics of Soil Salinization
The area can be divided into four soil salinization grades on the basis of salt content of 44 surface soil samples, as shown in Table 2. The spatial distribution is shown in Figure 7. Only 27.3% of the soil samples in the study area comprised non-salinization soils, which were mainly distributed in the periphery of the research area. Weak salinization soils accounted for 54.5%, mostly covering the study area, and were mainly distributed in the central and eastern parts of the study area. Strong salinization soils had a small quantity; they accounted for a total of 6.8% and were concentrated in the southwest corner of the research area. Soil salinization is widespread and serious in the study area and thus requires considerable attention.
Soil profile types were analyzed by conducting Q-cluster analysis with the hierarchical clustering method to examine the variations in the salt content of distinct layers.
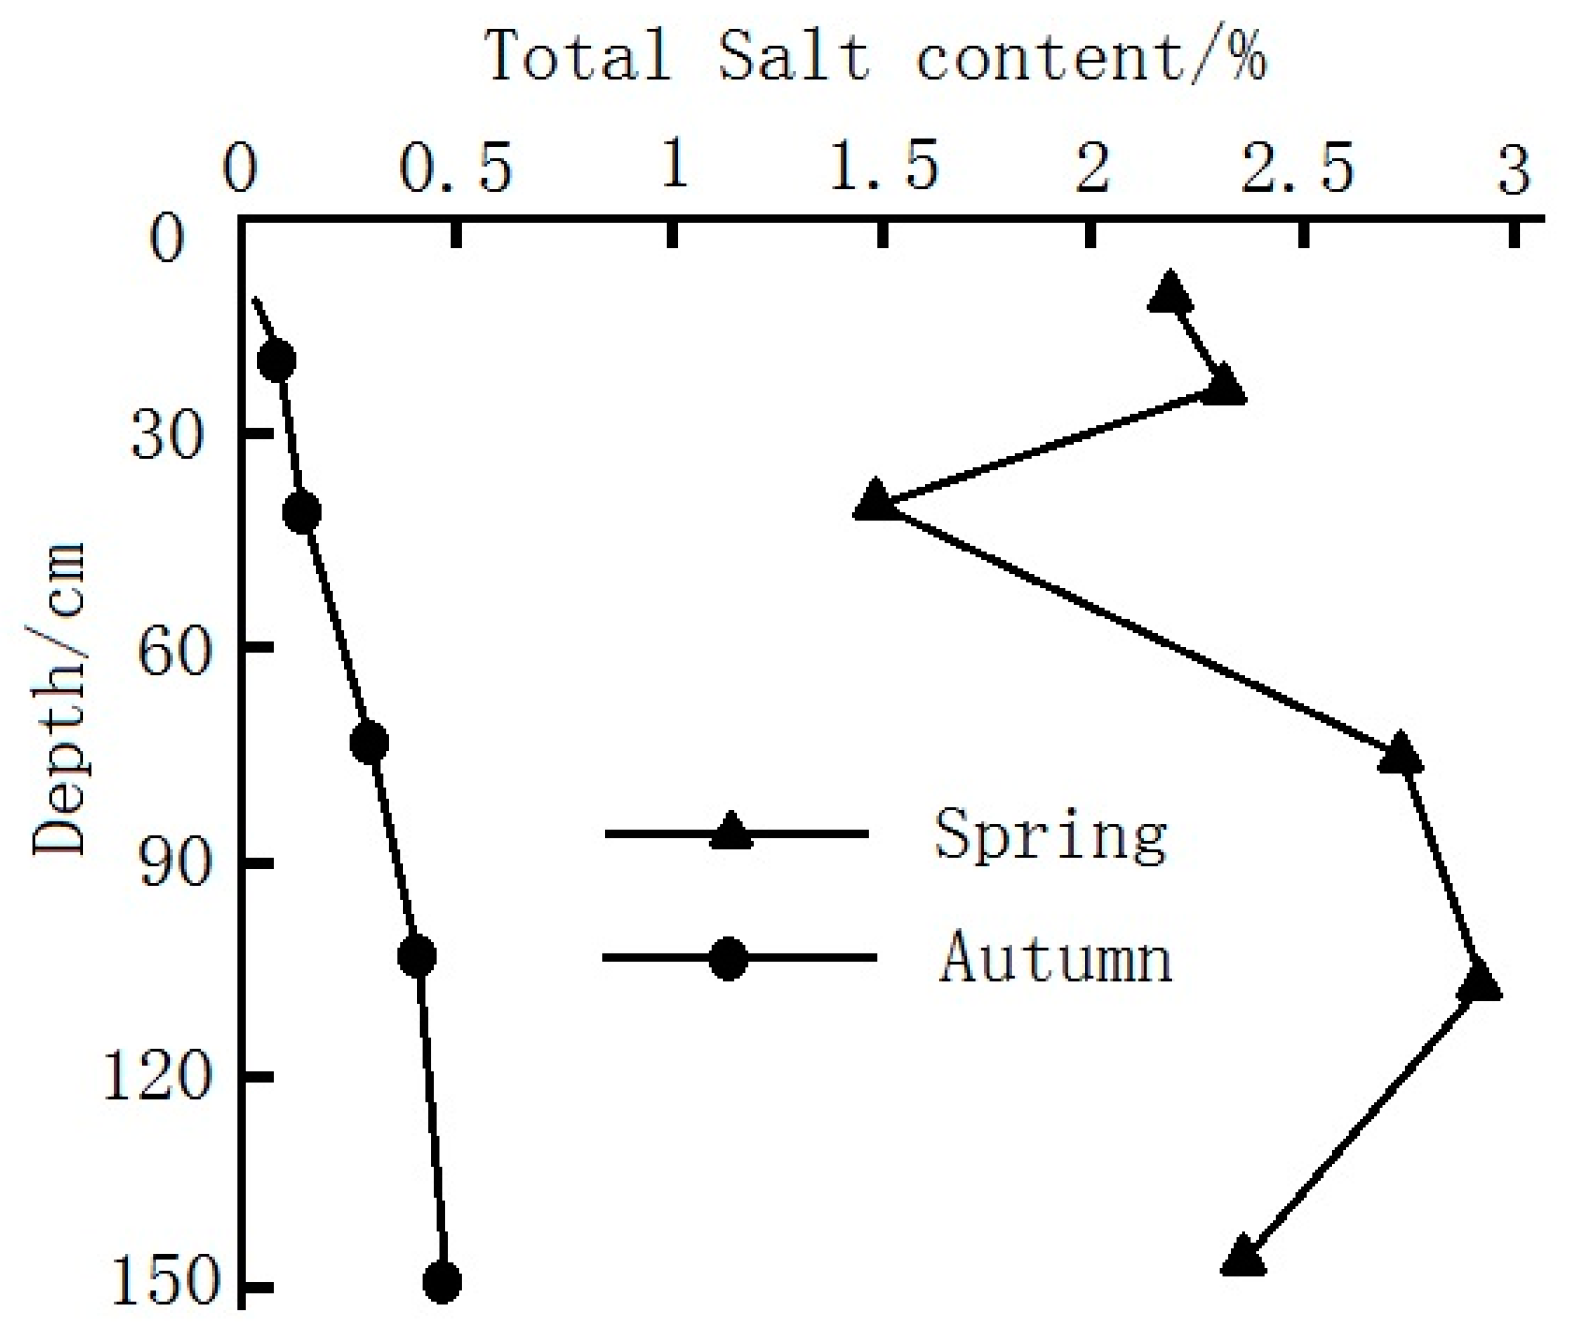
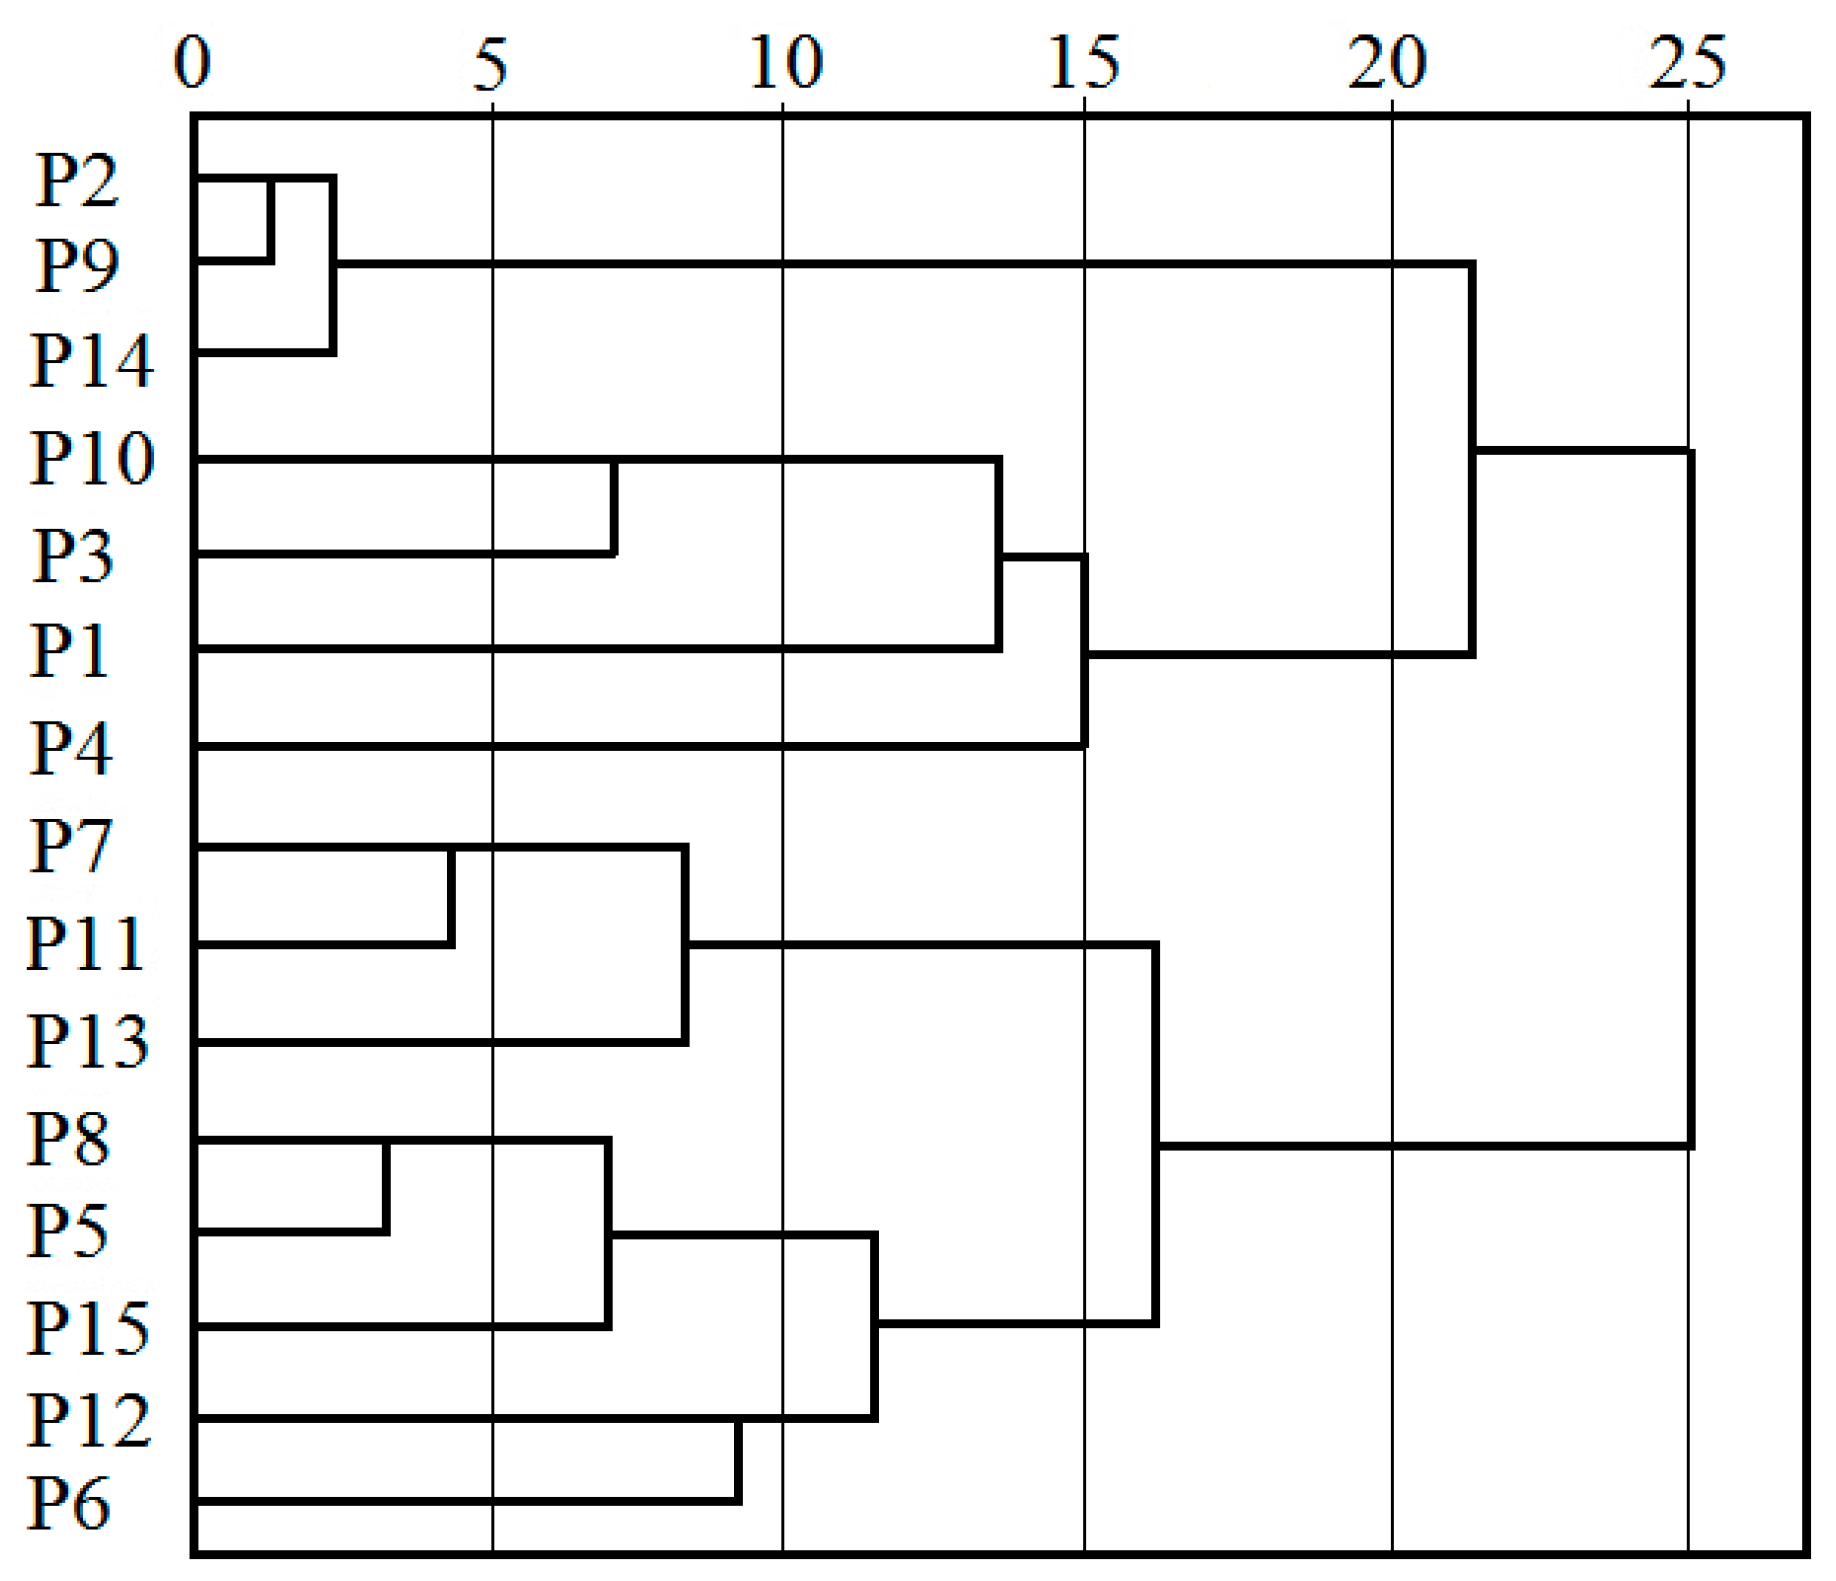
Appropriate clustering methods and measurement standards should be selected based on diverse salt content distributions. After multiple selection and comparison, the Pearson correlation coefficient was used as the statistic for conducting stratified cluster analysis. In Figure 8, the X-axis represents the cluster members, namely, the 15 selected soil profile points, and the Y-axis represents the Euclidean distance. When the Euclidean distance is 20, the soil profile is divided into three types, namely, surface aggregate, middle interlayer, and bottom aggregate. The favorable climatic conditions and the formation characteristics of salt soil in Yaoba Oasis suggest that the bottom soil profile is desalted soil, and the surface and middle aggregate soil profiles are salt-accumulated profiles. The difference between surface and middle aggregate soil profiles is that the surface aggregate profile has higher salt accumulation and more serious salinity ascending motion than the middle layer. Table 3 shows the statistical characteristics of soil salinity at different depths. The average pH of all soil layers in this area is more than 8.5, indicating that the soil is generally alkaline. The variation coefficient of the total soil salinity in each soil layer is large, which implies that the spatial variability of soil salinization is also large. The spatial variability of soil salinization is considerably affected by many factors, such as topography and landform, hydrological and meteorological conditions, and human activities. Figure 8 shows the change in total soil salinity in the saline–alkali land in the southwest of the oasis in spring and autumn. Soil salinity changes remarkably in different seasons. The values in spring are greater than those in autumn, and salinity gradually accumulates with the increase in depth. However, the salt content of the 0–10 cm soil layer in spring is generally higher than that of the 10–60 cm layer.
3.2. Relationship between Soil Salt Content and Chemical Components of Groundwater
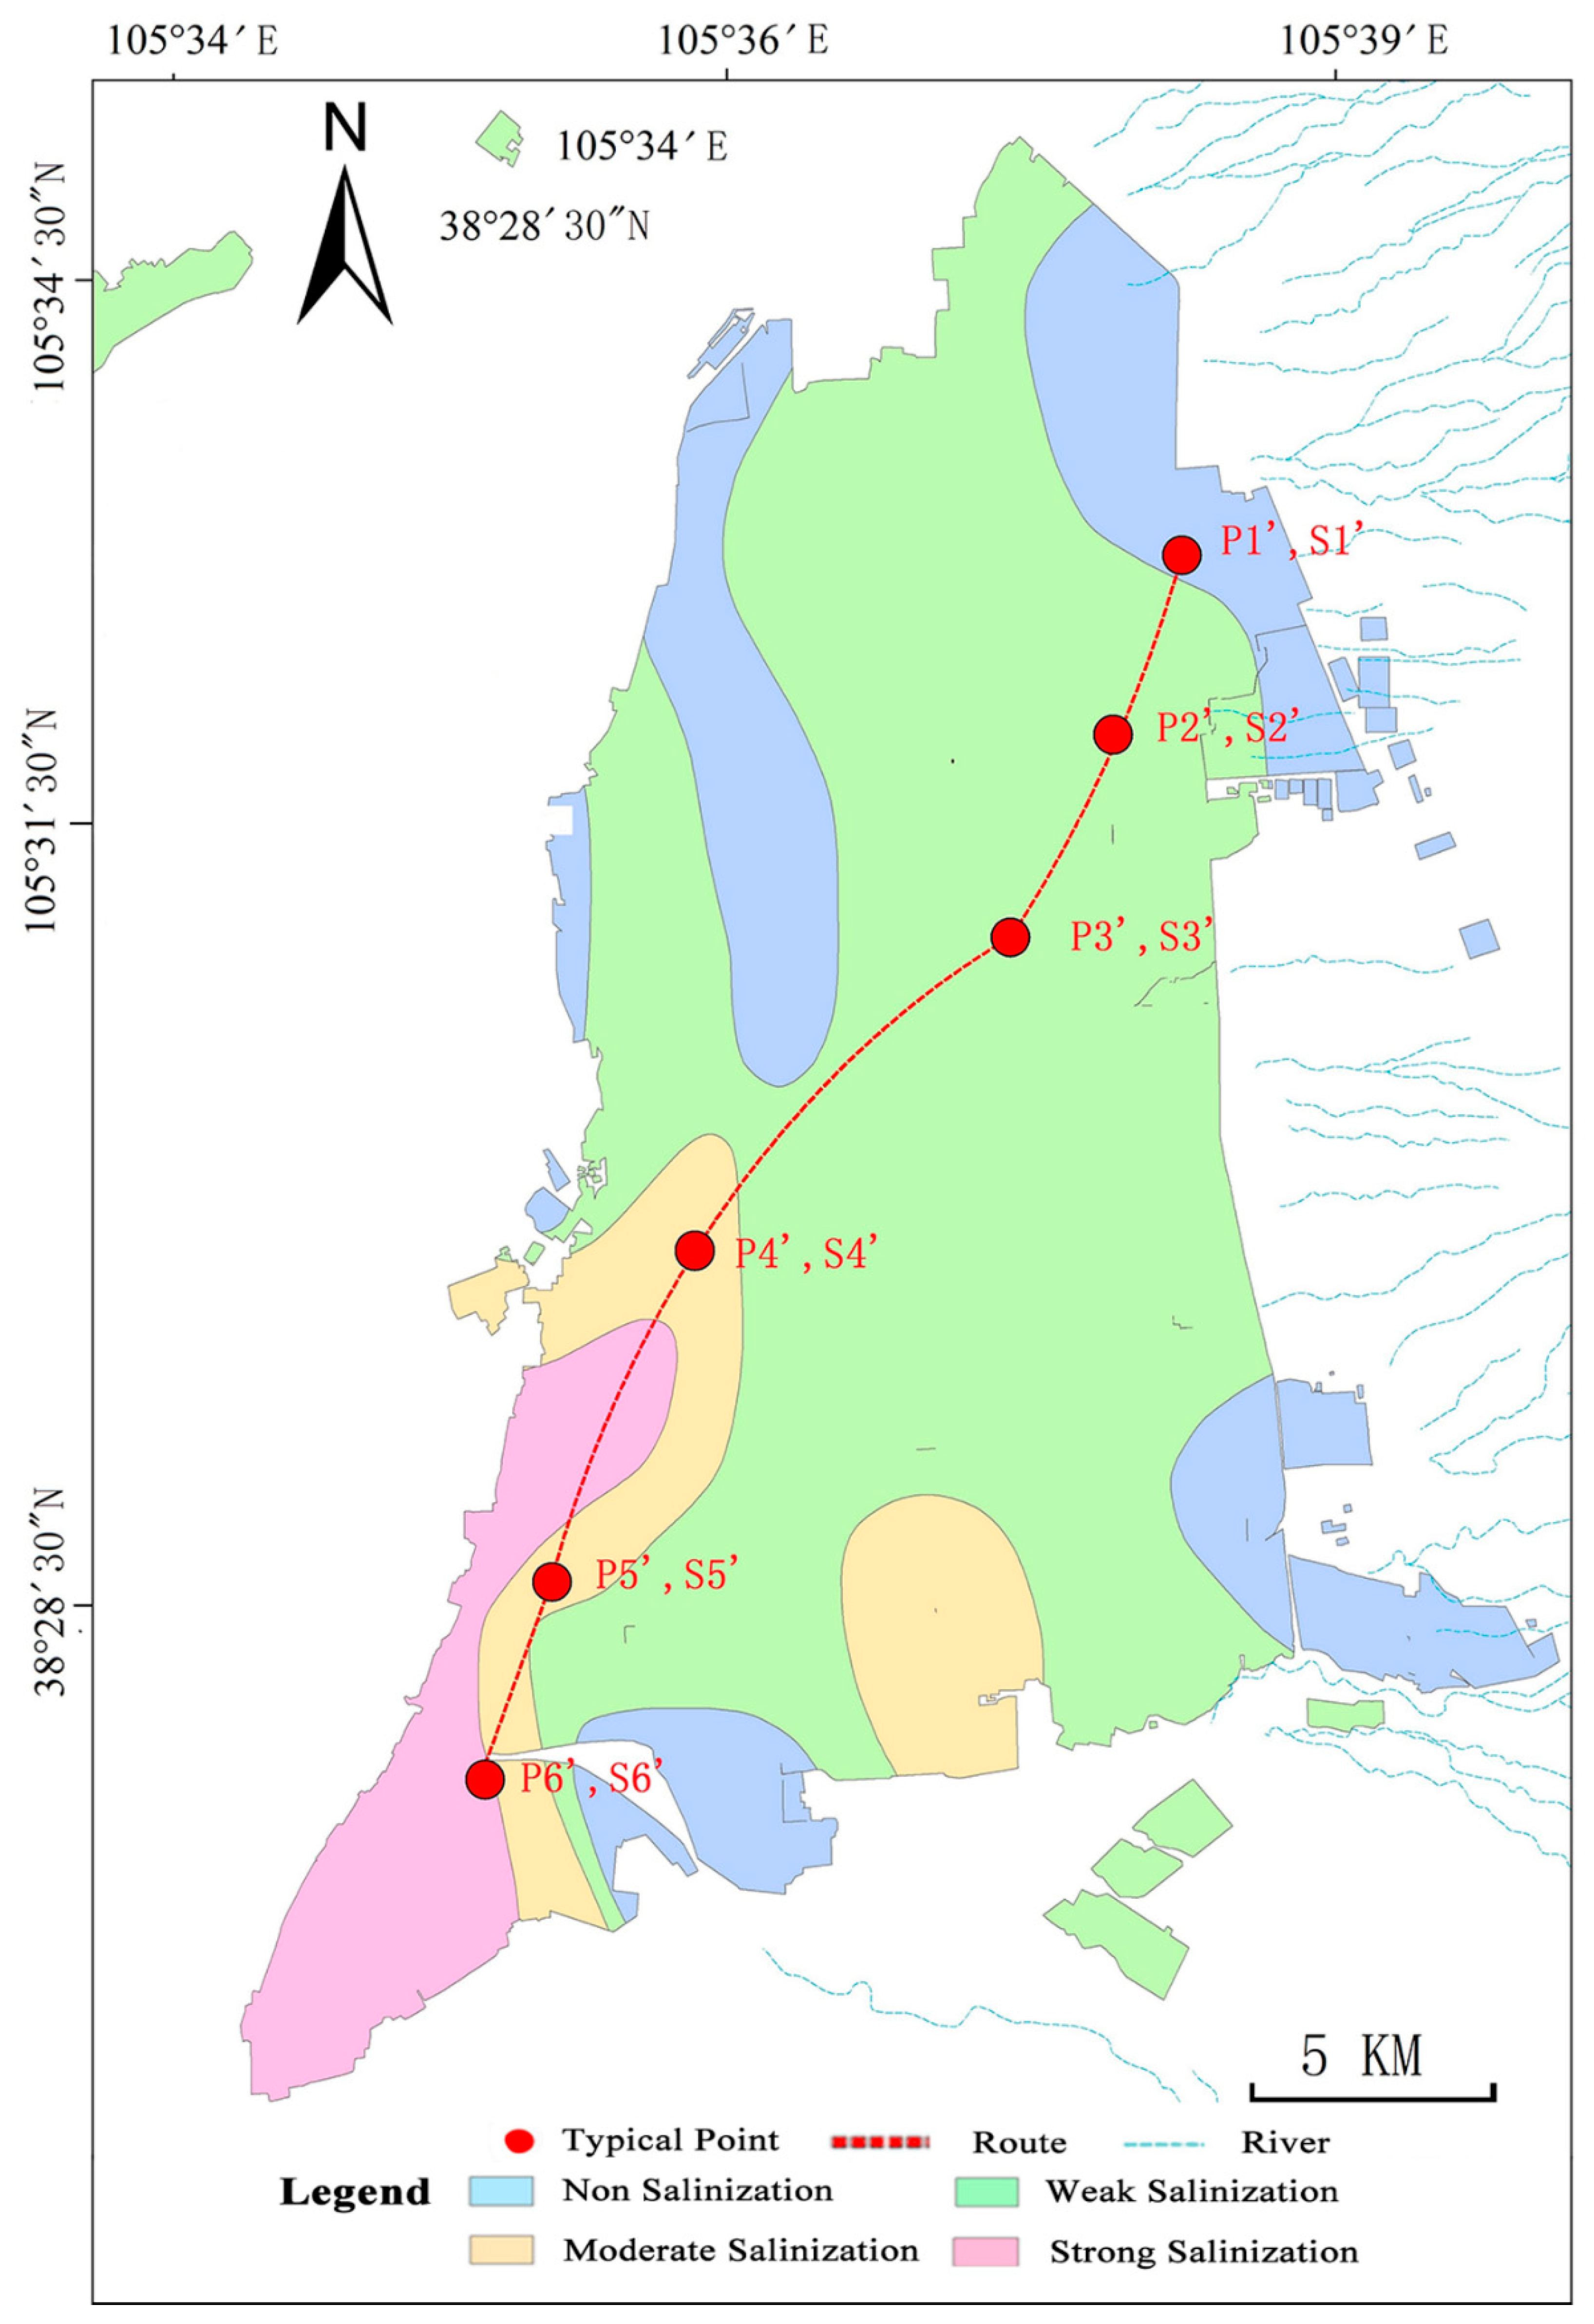
The analytical results of several soil profiles were used to evaluate the relationship between soil salt accumulation in different soil layers and underground water quality [45]. Section points P1’–P2’–P3’–P4’–P5’–P6’ from northeast to southwest collected in June were used as typical section points on the basis of runoff direction and soil salinization degree, and irrigation water samples S1’–S2’–S3’–S4’–S5’–S6’ from nearby wells of the soil samples were used as typical water samples, as shown in Figure 9.
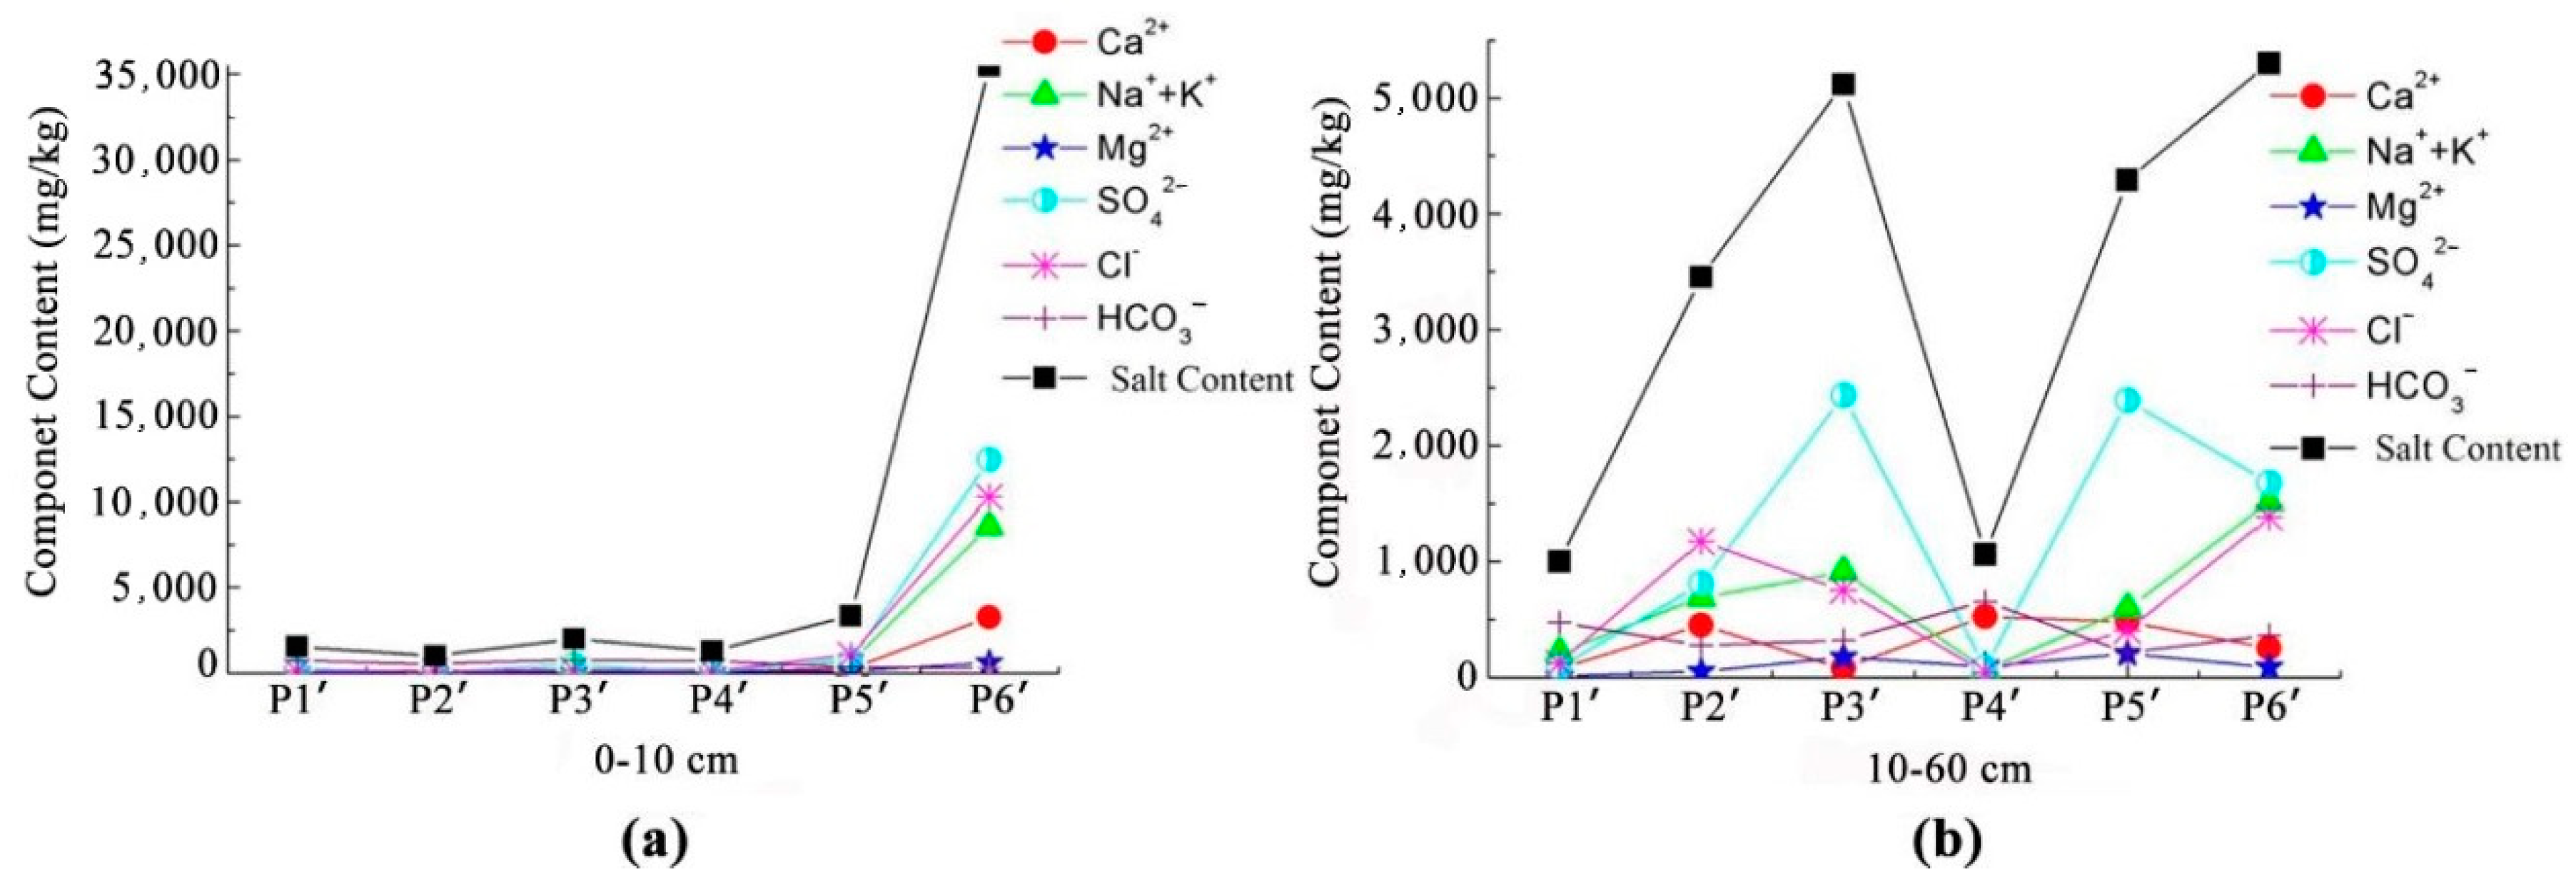
The soil salt ions are shown in Figure 10. The main cations are Ca2+ and K+ + Na+, and the main anions are SO42− and Cl−. Therefore, the main components of soil salinization are SO42− and Cl−, which are influenced by topography, geomorphology, hydrology, meteorological conditions, and human activities.
A comparison of different soil layers indicated that the salt content and ionic components have large spatial variability rather than a gradually increasing trend. The variation coefficients of total soil salinity SO42− and CO32− in the soil layers with depths of 0–10 cm and 10–60 cm are relatively large, indicating strong spatial variability.
The migration law of salt transport revealed that Cl− is the most active ion, followed by SO42−. CO32− is stable. However, in practice, saline soil in irrigated areas is mainly SO42−, followed by Cl−, because SO42− is abundant in the soil parent material, resulting in a higher content of SO42− radical ions in groundwater than that of Cl− ions. In addition, HCO3− under drought conditions becomes CO2 via intense evaporation, thereby causing CO32− to increase the content of CO32− in topsoil. Salt accumulation and desalination coexist on the soil soluble salt of the irrigation district and result in a higher value of soil salt ions or total salt content of the 0–10 cm soil layer than that of the 10–60 cm soil layer. Salt accumulation is mainly due to salt activity, and desalination is not evident due to the climatic conditions of the irrigation area, that is, low rainfall evaporation intensity has a close relationship with salt accumulation.
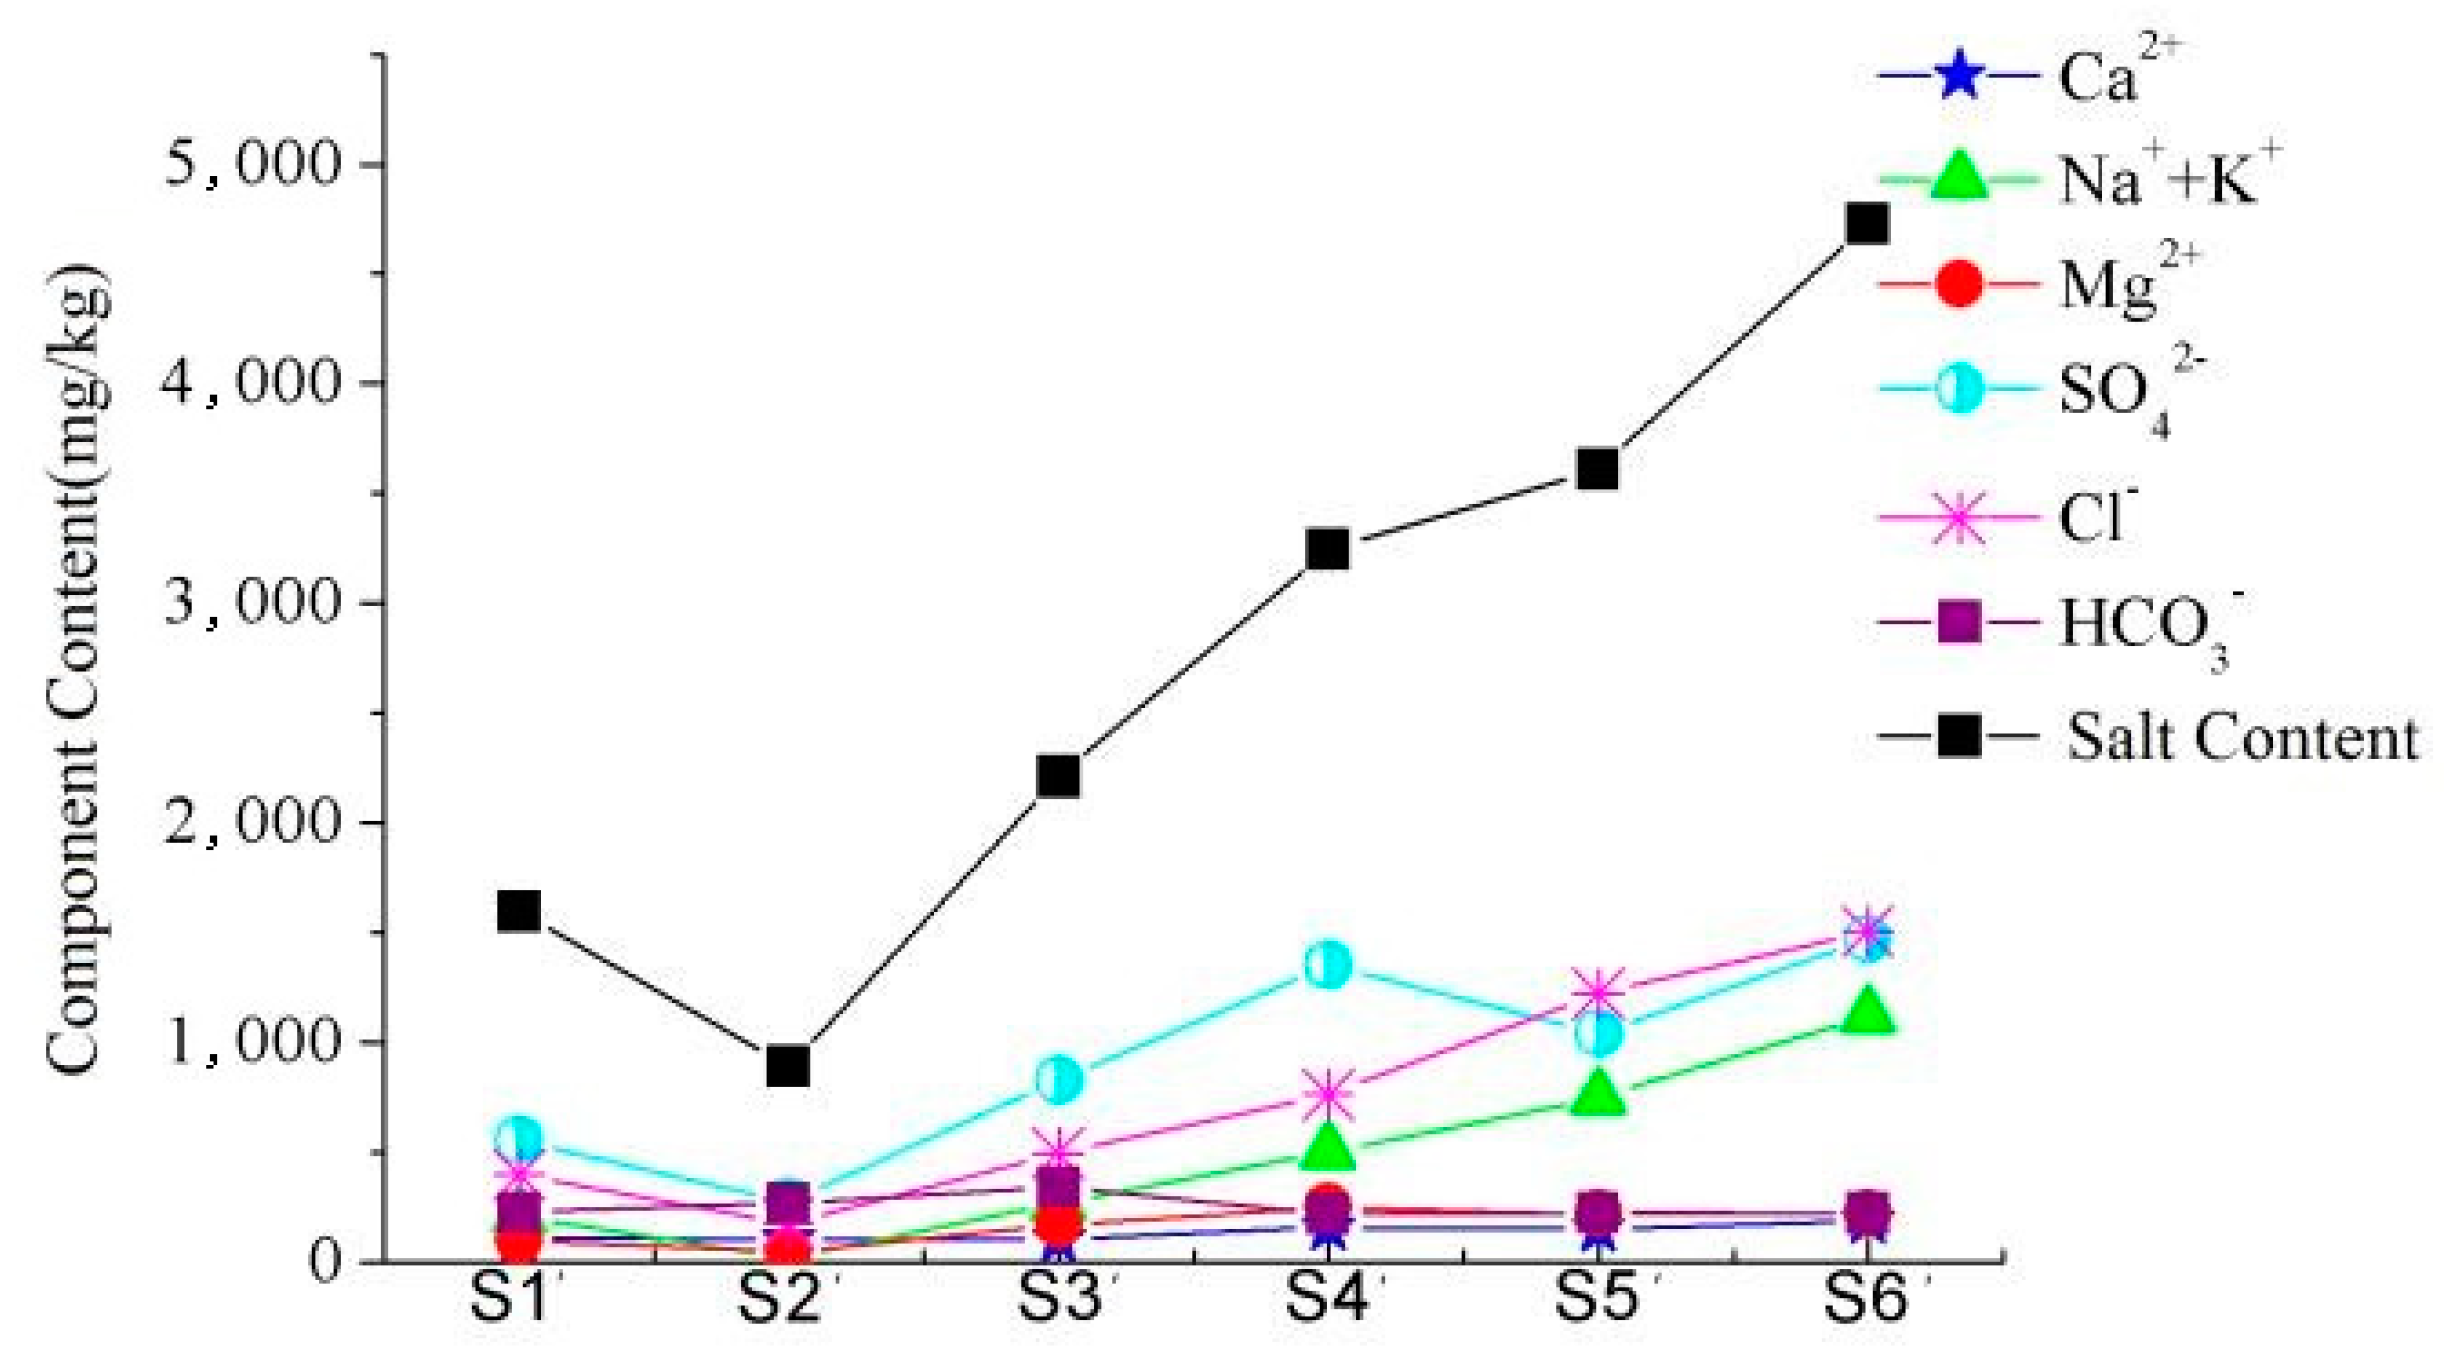
The change in groundwater quality in Figure 11 is relatively consistent with the salt and ionic component contents of the 0–10 cm soil layer. The change in the mineralization of groundwater from S1′ to S6′ shows a gradual upward trend, and the chemical components of groundwater are dominated by SO42−, Cl−, and Na+ + K+.
3.3. Correlation Analysis between Soil Salinity and Groundwater Quality
(a) Correlation of surface soil salinity and groundwater
We used surface soil salinity and underground water quality in the study area as the study objects. We utilized total soil salt contents of SO42−, Cl−, Ca2+, Na+ + K+, Mg2+, and HCO3− and pH as the basic data and the irrigation groundwater TDS(01) of SO42−(02), Cl−(03), Ca2+(04), Na+ + K+(05), Mg2+(06), and HCO3−(07) and pH(08) as the system factor sequence. Then, the correlation degree between soil salinity and irrigation groundwater quality was calculated and analyzed.
The absolute and relative correlation degrees of groundwater quality to topsoil salinity were obtained based on the data by conducting a non-dimensional quantitative treatment and using Formulas (4) and (6).
The absolute correlation degrees are expressed as
ε01 = 0.605, ε02 = 0.586, ε03 = 0.636, ε04 = 0.560, ε05 = 0.683, ε06 = 0.548, ε07 = 0.511, and ε08 = 0.512.
The relative correlation degrees are expressed as
r01 = 0.786, r02 = 0.755, r03 = 0.825, r04 = 0.704, r05 = 0.871, r06 = 0.674, r07 = 0.545, and r08 = 0.532.
When θ = 0.5, the gray comprehensive relationship degree is calculated using Formula (7); the results are expressed as
ρ01 = 0.696, ρ02 = 0.671, ρ03 = 0.731, ρ04 = 0.632, ρ05 = 0.777, ρ06 = 0.611, ρ07 = 0.529, and ρ08 = 0.532.
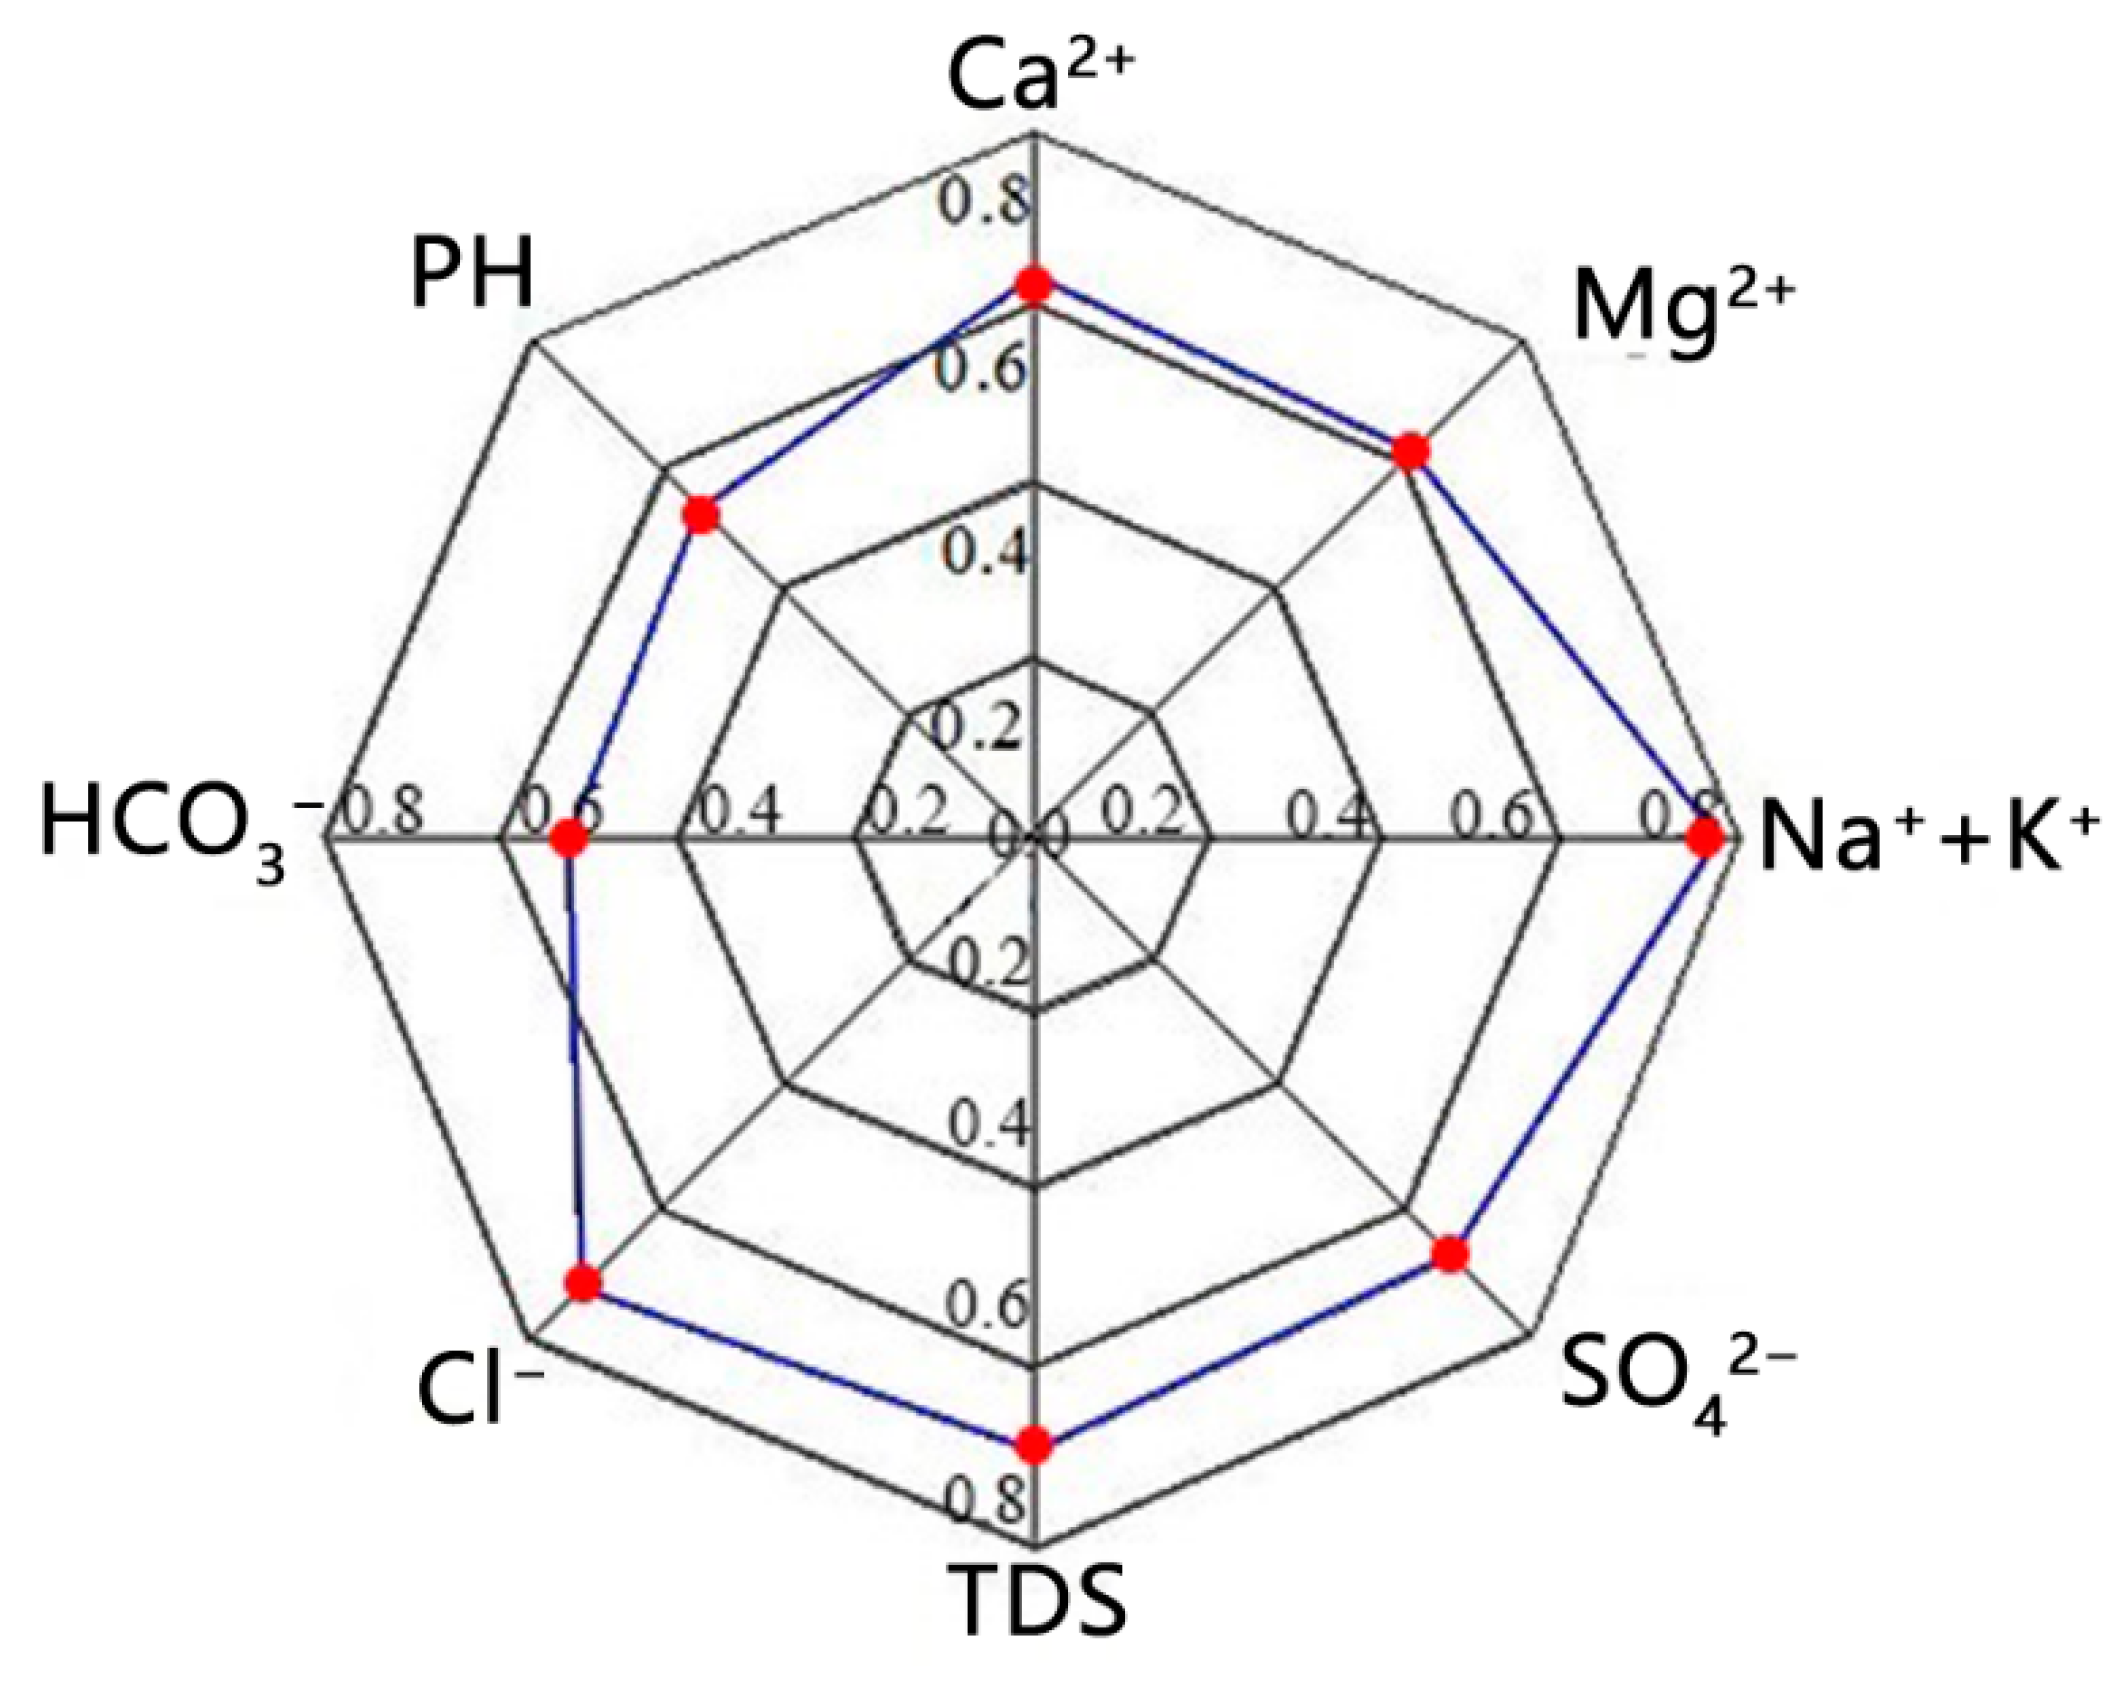
The results are represented by a radar map. A radar map can clearly show the correlation between groundwater factors and salt ions in soil. The more peripheral the value is, the stronger the correlation is. The calculation result in Figure 12 shows that the correlation degree between surface soil salinity and groundwater correlation is high and presents a non-consistency characteristic, thereby showing that the accumulated salt in the surface soil has a direct relationship with underground water quality. Groundwater irrigation directly affects soil salinity characteristics. The value of correlation indicates that each component has a different response to the relationship between soil salt content and underground water quantity.
On the basis of the order of the correlation degree value, the result indicates that the contribution of components in irrigation water quality to soil salt accumulation is Na++K+, Cl−, salinity, SO42−, Ca2+, Mg2+, pH, and HCO3− from large to small. The correlation degrees of Na+ + K+, Cl−, mineralization, SO42−, Ca2+, and Mg2+ are >0.6, indicating that these ions within irrigation water are mostly stored in the topsoil. The correlation degrees of pH and HCO3− are less than 0.6, indicating the low representativeness and low response of surface soil salt accumulation. HCO3− is the alkaline component in underground water. The minimum contribution of irrigation water to soil salt accumulation shows that the soil type is saline sodic rather than alkalized.
(b) Correlation of soil salinity at different depths and groundwater
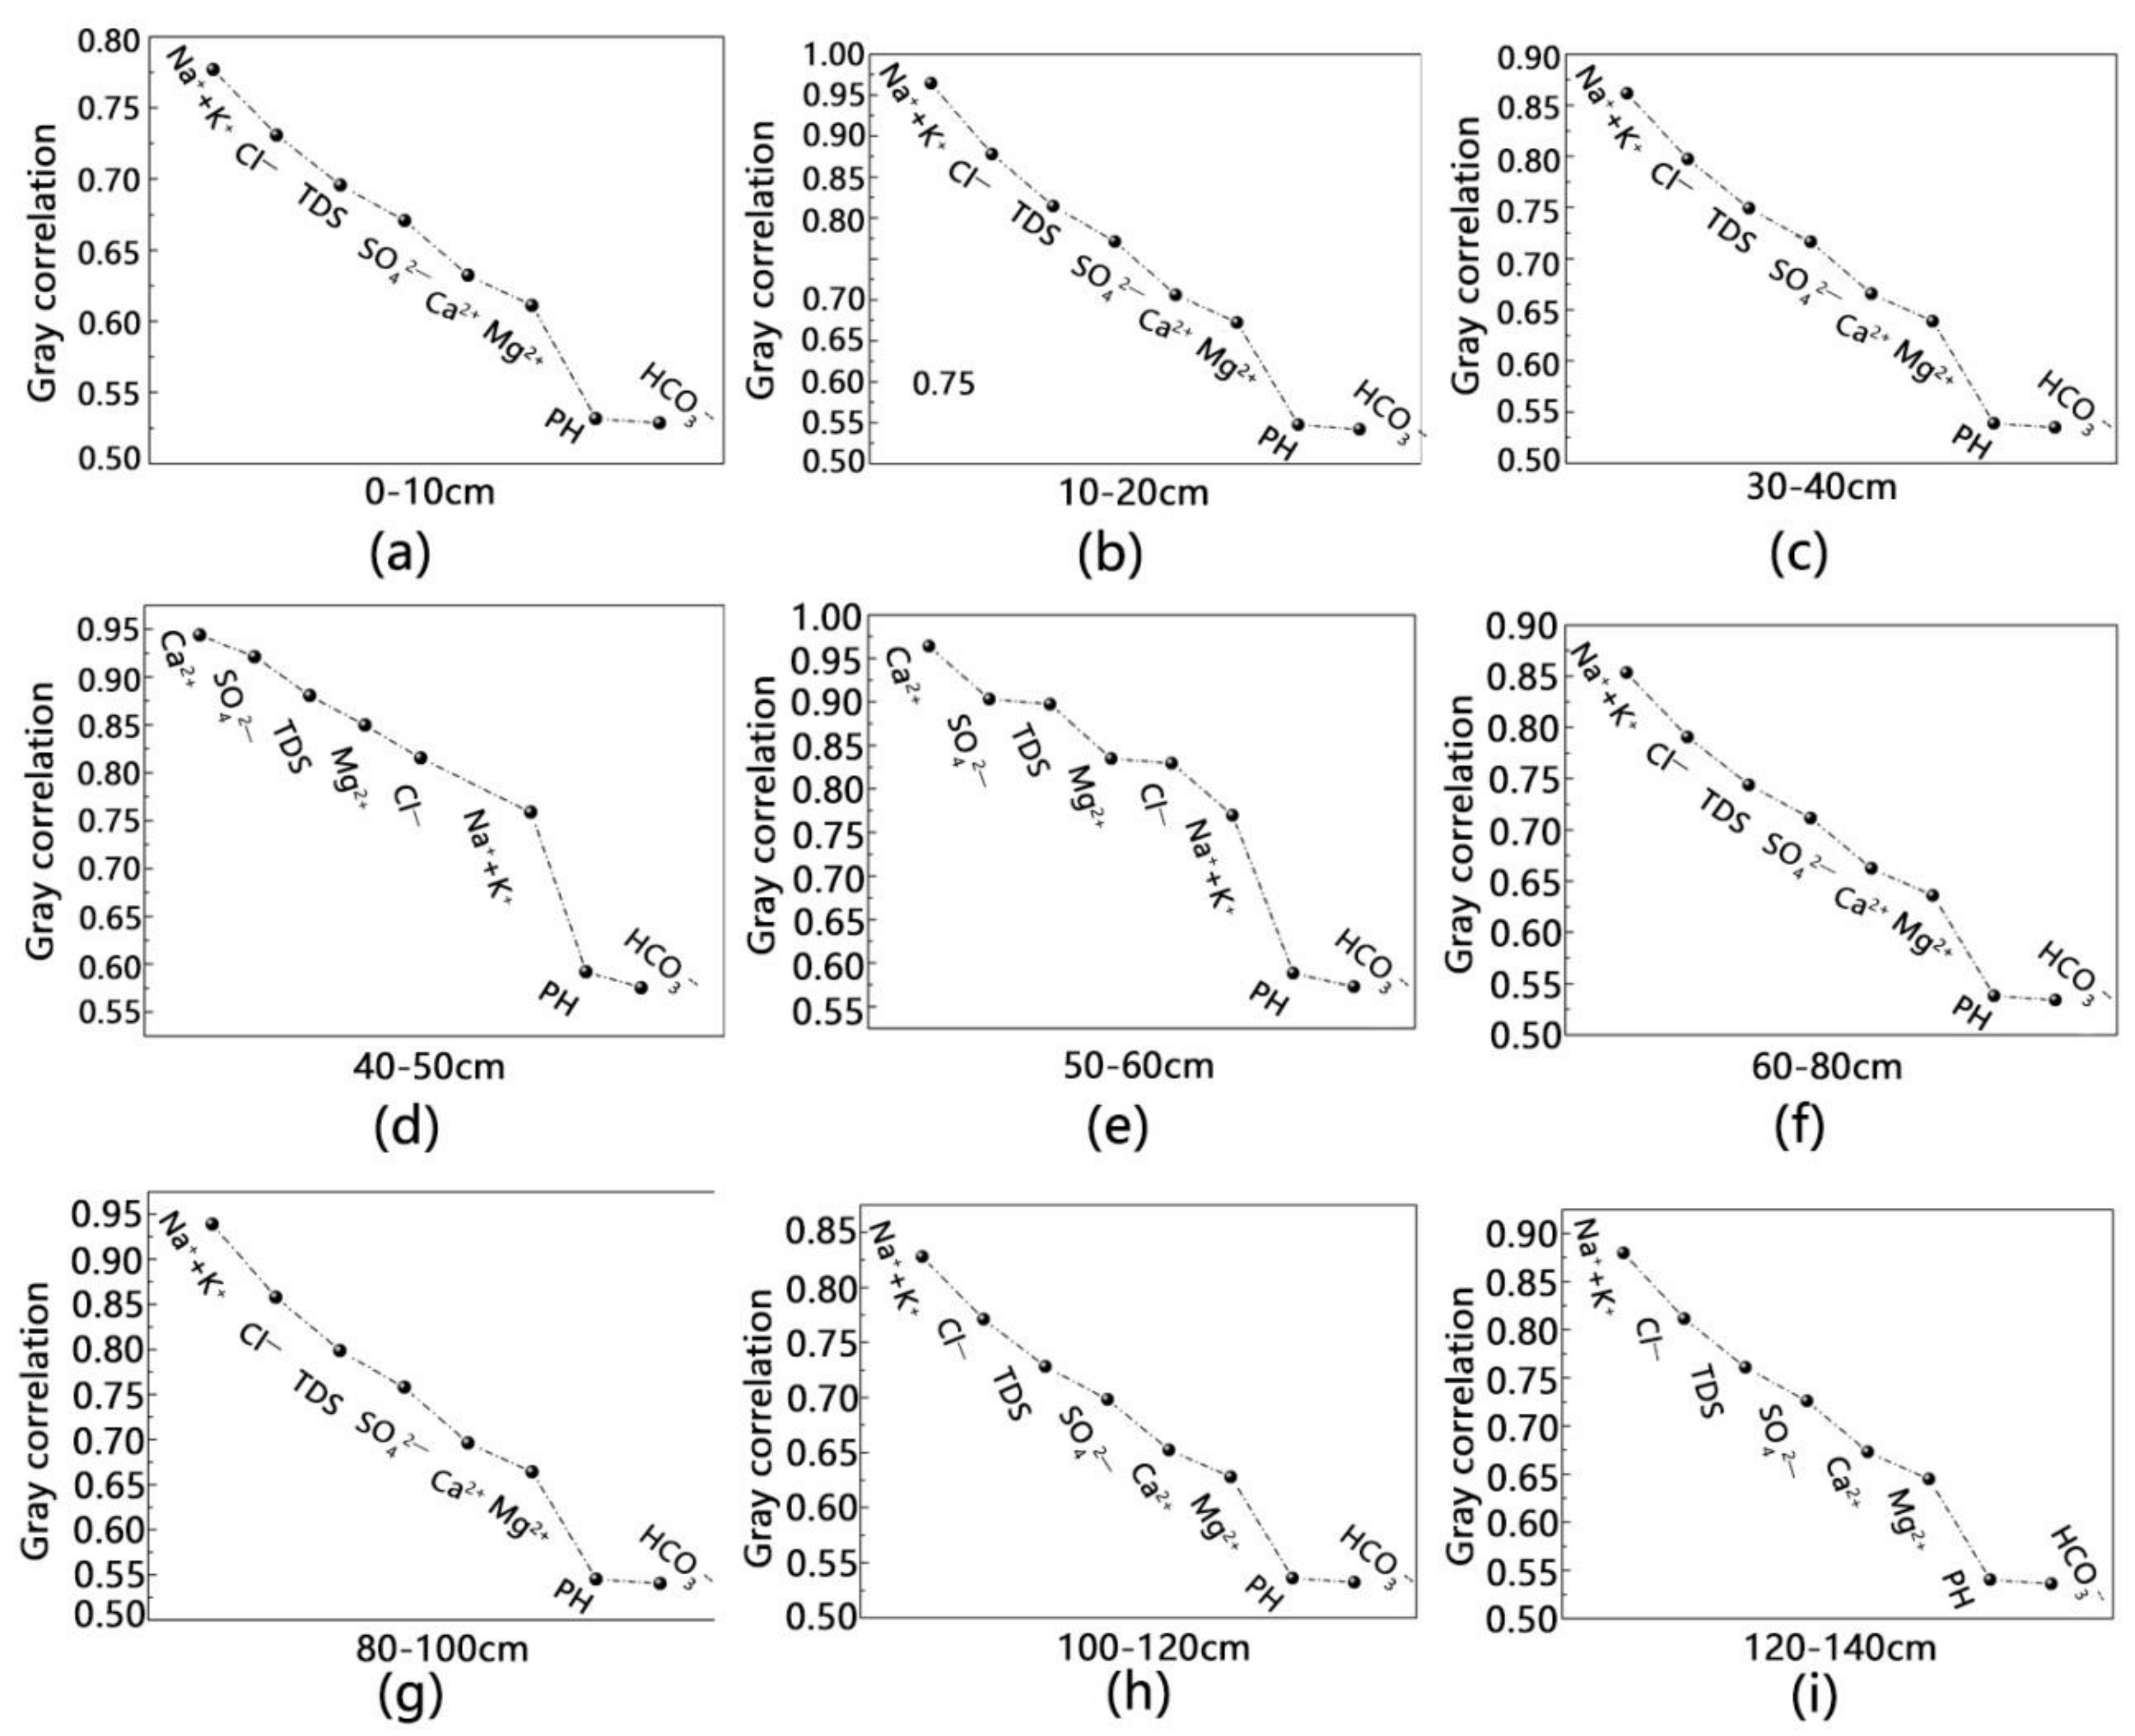
In the study area, soil salinity is influenced by processes of salt leaching due to flood irrigation and evaporation. The soil salinization status was unaffected by groundwater level change when the level below the buried depth of groundwater. Therefore, the correlation degree between salt and irrigation water in the soil profile was analyzed from the perspective of irrigation water quality, and the correlation degree was sorted to determine the influence of the change in irrigation water quality on soil salt. The calculation results are shown in Figure 13.
The results showed that the correlation degree between soil salt and irrigation water quality differed at the different depths. The correlation degree in the 0–40 cm soil layers from large to small was Na+ + K+, Cl−, salinity of water, SO42−, Ca2+, Mg2+, pH, and HCO3− in sequence. When the soil depth ranged from 40 cm to 60 cm, the correlation degree changed dramatically. In this layer, the dominant position of Na+ + K+ and Cl− gradually moved downward, and SO42−, Ca2+, and Mg2+ gradually moved upward from the original inferior position and became the main influencing factors of correlation degree. The correlation degree was stable when the soil depth was greater than 60 cm.
4. Conclusions
This study investigated the relationship between groundwater and soil salinity in Yaoba Oasis. The characteristics of groundwater were analyzed in different periods, and gray correlation analysis was conducted to illustrate the variation in surface soil salinity with groundwater. The contributions of this study are summarized as follows:
(a) The fresh water area with low TDS was usually HCO3− or SO42−-type water, and salt water mostly consisted of Cl− and SO42−. The analysis result indicated a gradual change of groundwater TDS and chemical types showed along the groundwater flow from northeast to southwest. The chemical types and components of groundwater and soil were stable to a certain extent, and the variation trends were similar from northeast to southwest.
(b) The spatial distribution of the main ions in the groundwater during winter irrigation in November was basically consistent with that during spring irrigation in June. However, the spatial distribution of TDS differed in the two seasons. The area of groundwater TDS < 1000 mg/L (fresh water) in the oasis decreased in winter, whereas the area of TDS > 3000 mg/L (salt water) increased. The area with an extremely high TDS value in the original Taosu Lake in the southwest decreased.
(c) The soil salinization of Yaoba Oasis was mainly composed of weak and medium salinization, which were serious (salinity rate up to 72.7%) with remarkable salinity surface accumulation. Compared with research on different time phase in the area, the spatial variability of soil salinization had a relatively large value in this study. Soil salinity changed remarkably in seasons, and the values in spring were greater than those in autumn. The salinity gradually accumulated with the increase in depth. However, the salt content of the 0–10 cm soil layer in spring was generally higher than that of the 10–60 cm layer.
(d) The variation coefficient of total soil salinity in the soil layers with depths of 0–10 cm and 10–60 cm was relatively large, which indicated strong spatial variability. The salt accumulation and desalination processes of soil soluble salt in the irrigation area simultaneously existed which resulted in a higher value of soil salt ions or total salt content in the 0–10 cm soil layer than in the 10–60 cm soil layer.
(e) The salt component and content of surface soil had a high gray correlation with groundwater, and the correlation degree of groundwater salt content with surface soil salt content was in the order of Na+ + K+ > Cl− > water salt content > SO42− > Ca2+ > Mg2+ > HCO3−.
Soil salinization usually occurs in two forms. One is the process of soil salinity accumulation in geological history called residual salinity accumulation. The other is the modern process of salt accumulation, in which the accumulated salts remain in the soil because of the dry climate and scarce rainfall. The latter is affected by surface water and groundwater, and salt accumulates in the upper soil due to strong surface evaporation. The preceding analysis shows that the formation of soil salinization mainly belongs to residual salinization. The groundwater in the area is buried deep, the climate is dry, and rainfall is scarce. Soil salinization is caused by the potential residual salt in the soil and the influence of human activities outside (mainly irrigation).
- Influence of irrigation: Farming and animal husbandry mainly use water from deep wells due to the climate characteristics of this area. When deep well irrigation is used frequently, a large amount of residual salt in the soil becomes active; with the strong evaporation of the soil, the accumulation of soil salinization reaches the surface.
- Influence of irrigation water (groundwater) quality: The irrigation water of the study area is mainly supplied by groundwater from Helan Mountain and Tengger Desert. The parent material of the soil in the west of this area is lacustrine sediments; therefore, the soil contains considerable soluble alkali metals (mainly sodium). In this way, bivalent cations (mainly Ca2+ ions) in groundwater are exchanged with sodium in the soil in the recharge process, resulting in many soluble Na+ ions in groundwater in this area. The deep water quality worsens, and alkalinity increases. In this way, when the groundwater that contains high sodium ions is used for irrigation, alkalization occurs. The above discussion indicates that soil salinization in this region is closely related to groundwater quality.
This study conducted an in situ observation of Yaoba Oasis in Northwest China. The variation relationship between groundwater TDS and hydro-chemical characteristic with salinity may be affected by many factors, such as landform, lithology, burial conditions, and human activities (irrigation). Although the observed data are limited, the results of this study can provide a scientific basis for the sustainable development of oasis agriculture and effective prevention of soil salinization. Future studies should focus on the quantitative calculation of coupled water and solute transport in the vadose by using a numerical simulation method.
Author Contributions
G.C. and Y.L. equally contributed to this study and were responsible for the original concept and experimental design. C.Z. conducted the experiments and gave valuable suggestions. J.S. provided the concepts to improve the quality of the study. Y.L. and Z.L. gave numerous comments for the improvement and revision of this paper.
Funding
This study was supported by the National Natural Science Foundation of China (41630634 and 61701396) and the Natural Science Foundation of Shaan Xi Province (2017JQ4006).
Acknowledgments
The authors are grateful to the editor-in-chief, associate editor, and reviewers for their insightful comments and suggestions.
Conflicts of Interest
The authors declare no conflict of interest.
References
- Nachshon, U. Cropland soil salinization and associated hydrology: Trends, processes and examples. Water 2018, 10, 1030. [Google Scholar]
- Shokrikuehni, S.M.S.; Norouzi Rad, M.; Webb, C.; Shokri, N. Impact of type of salt and ambient conditions on saline water evaporation from porous media. Adv. Water Resour. 2017, 105, 154–161. [Google Scholar] [CrossRef]
- Mau, Y.; Porporato, A. A dynamical system approach to soil salinity and sodicity. Adv. Water Resour. 2015, 83, 68–76. [Google Scholar] [CrossRef] [Green Version]
- Douaoui, A.E.K.; Nicolas, H.; Walter, C. Detecting salinity hazards within a semiarid context by means of combining soil and remote-sensing data. Geoderma 2017, 134, 217–230. [Google Scholar] [CrossRef]
- Geris, J.; Tetzlaff, D.; Mcdonnell, J.; Soulsby, C. The relative role of soil type and tree cover on water storage and transmission in northern headwater catchments. Hydrol. Process. 2015, 29, 1844–1860. [Google Scholar] [CrossRef]
- Song, Y.G.; Guo, Z.; Lu, Y.; Yan, D.; Liao, Z.; Liu, H.; Cui, Y. Pixel-level spatiotemporal analyses of vegetation fractional coverage variation and its influential factors in a desert steppe: A case study in Inner Mongolia, China. Water 2017, 9, 478. [Google Scholar] [CrossRef]
- Chen, Y.; Li, W.; Xu, C.; Ye, Z.; Chen, Y. Desert riparian vegetation and groundwater in the lower reaches of the tarim river basin. Environ. Earth Sci. 2015, 73, 547–558. [Google Scholar] [CrossRef]
- Gu, F.X.; Zhang, Y.D.; Chu, Y.; Shi, Q.D.; Pan, X.L. Primary analysis on groundwater, soil moisture and salinity in fukang oasis of southern junggar basin. Chin. Geogr. Sci. 2002, 12, 333–338. [Google Scholar] [CrossRef]
- Qian, J.; Wang, L.; Ma, L.; Lu, Y.H.; Zhao, W.; Zhang, Y. Multivariate statistical analysis of water chemistry in evaluating groundwater geochemical evolution and aquifer connectivity near a large coal mine, Anhui, China. Environ. Earth Sci. 2016, 75, 747. [Google Scholar] [CrossRef]
- Golshan, M.; Colombani, N.; Mastrocicco, M. Assessing aquifer salinization with multiple techniques along the southern caspian sea shore (Iran). Water 2018, 10, 348. [Google Scholar] [CrossRef]
- Rietz, D.N.; Haynes, R.J. Effects of irrigation-induced salinity and sodicity on soil microbial activity. Soil Biol. Biochem. 2003, 35, 845–854. [Google Scholar] [CrossRef] [Green Version]
- Xu, X.; Huang, G.; Sun, C.; Pereira, L.S.; Ramos, T.B.; Huang, Q.; Hao, Y. Assessing the effects of water table depth on water use, soil salinity and wheat yield: Searching for a target depth for irrigated areas in the upper yellow river basin. Agric. Water Manag. 2013, 125, 46–60. [Google Scholar] [CrossRef]
- Wang, Y.; Jiao, J.J. Origin of groundwater salinity and hydrogeochemical processes in the confined quaternary aquifer of the pearl river delta, China. J. Hydrol. 2012, 438–439, 112–124. [Google Scholar] [CrossRef]
- Bing, L.; Zhao, W.; Chang, X.; Li, S.; Zhang, Z.; Du, M. Water requirements and stability of oasis ecosystem in arid region, China. Environ. Earth Sci. 2010, 59, 1235. [Google Scholar]
- Zhou, H.; Zhao, W.; Zhang, G. Varying water utilization of haloxylon ammodendron plantations in a desert-oasis ecotone. Hydrol. Process. 2016, 31, 825–835. [Google Scholar] [CrossRef]
- Sun, Z.; Ma, R.; Wang, Y.; Hu, Y.; Sun, L. Hydrogeological and hydrogeochemical control of groundwater salinity in an arid inland basin: Dunhuang basin, northwestern China. Hydrol. Process. 2016, 30, 1884–1902. [Google Scholar] [CrossRef]
- Eziz, M.; Yimit, H.; Mamat, Z.; Ning, X.U. The response of soil salinization to characters of groundwater in ili river basin. J. China Hydrol. 2012, 32, 14–20. [Google Scholar]
- Sai, J.; Lu, Y.; Wang, Z.; He, M. Characteristics of soil salinization in yaoba oasis of inner mongolia autonomous region. Bull. Soil Water Conserv. 2017, 5, 152–156. [Google Scholar]
- Bin, L.I.; Shi, H.B.; Yan, J.W.; Zhen, L.I.; Zhang, J.G.; Zhou, J. Relation between groundwater depth and soil water and salt after water saving reform in salinization irrigation district. J. Soil Water Conserv. 2014, 28, 167–172. [Google Scholar]
- Deng, B.S.; Halik, W.; Dang, J.H.; Zhang, Y.P.; Xuan, J.W. Coupled analysis of spatio-temporal variability of groundwater depth and soil salinity in keriya oasis. Arid. Land Geogr. 2015, 38, 599–607. [Google Scholar]
- Cao, J.R.; Xu, X.; Yu, H.; Liu, Y.J. Analysis for driving forces and ecological risk assessment of soil salinization in the yellow river delta. Adv. Mar. Sci. 2014, 32, 508–516. [Google Scholar]
- Wu, L.; Skaggs, T.H.; Shouse, P.J.; Ayars, J.E. State space analysis of soil water and salinity regimes in a loam soil underlain by shallow groundwater. Soil Sci. Soc. Am. J. 2001, 65, 1065–1074. [Google Scholar] [CrossRef]
- Liu, S.F.; Fang, Z.G.; Lin, Y. Study on a new definition of degree of grey incidence. J. Grey Syst. 2006, 9, 115–122. [Google Scholar]
- Fan, X.; Pedroli, B.; Liu, G.; Liu, Q.; Liu, H.; Shu, L. Soil salinity development in the yellow river delta in relation to groundwater dynamics. Land Degrad. Dev. 2012, 23, 175–189. [Google Scholar] [CrossRef]
- Qureshi, A.S.; Ahmad, W.; Ahmad, A.F.A. Optimum groundwater table depth and irrigation schedules for controlling soil salinity in central Iraq. Irrig. Drain. 2013, 62, 414–424. [Google Scholar] [CrossRef]
- Hui, B.; He, P.; Zhang, Y. Cyclic freeze–thaw as a mechanism for water and salt migration in soil. Environ. Earth Sci. 2015, 74, 675–681. [Google Scholar] [Green Version]
- Xia, J.; Zhang, S.; Zhao, X.; Liu, J.; Chen, Y. Effects of different groundwater depths on the distribution characteristics of soil- tamarix water contents and salinity under saline mineralization conditions. Catena 2016, 142, 166–176. [Google Scholar] [CrossRef]
- Abliz, A.; Tiyip, T.; Ghulam, A.; Halik, Ü.; Ding, J.L.; Sawut, M.; Zhang, F.; Nurmemet, I.; Abliz, A. Effects of shallow groundwater table and salinity on soil salt dynamics in the keriya oasis, northwestern China. Environ. Earth Sci. 2016, 75, 260. [Google Scholar] [CrossRef]
- Haj-Amor, Z.; Tóth, T.; Ibrahimi, M.K.; Bouri, S. Effects of excessive irrigation of date palm on soil salinization, shallow groundwater properties, and water use in a saharan oasis. Environ. Earth Sci. 2017, 76, 590. [Google Scholar] [CrossRef]
- Wichelns, D.; Qadir, M. Achieving sustainable irrigation requires effective management of salts, soil salinity, and shallow groundwater. Agric. Water Manag. 2015, 157, 31–38. [Google Scholar] [CrossRef]
- Xu, J.; Li, W.; Zhang, L.; Hong, Y.; Bi, X.; Yang, Y. Statistical analysis of groundwater chemistry of the tarim river lower reaches, northwest China. Environ. Earth Sci. 2012, 65, 1807–1820. [Google Scholar] [CrossRef]
- Libutti, A.; Cammerino, A.R.B.; Monteleone, M. Risk assessment of soil salinization due to tomato cultivation in mediterranean climate conditions. Water 2018, 10, 1503. [Google Scholar] [CrossRef]
- Zhenzhen, L.; Yang, J.; Liu, G.; Jinbiao, L.I.; Liu, H.; Bing, L.I. Relationship between soil salinization and groundwater characteristics in the yellow river delta. Acta Pedol. Sin. 2017, 54, 1377–1385. [Google Scholar]
- Seeboonruang, U. Relationship between groundwater properties and soil salinity at the;lower nam kam river basin in Thailand. Environ. Earth Sci. 2013, 69, 1803–1812. [Google Scholar] [CrossRef]
- Li, Y.; Lu, Y.D.; Li, H.J.; Wang, J.K.; Jiang, L. Groundwater dynamic characteristics and the influence on vegetation variation in the yaoba oasis. Ground Water 2012, 4, 030. [Google Scholar]
- Zheng, C.; Lu, Y.; Guo, X.; Li, H.; Sai, J.; Liu, X. Application of hydrus-1d model for research on irrigation infiltration characteristics in arid oasis of northwest China. Environ. Earth Sci. 2017, 76, 785. [Google Scholar] [CrossRef]
- Li, X.G.; Xia, W.; Lu, Y.D. Optimising the allocation of groundwater carrying capacity in a data-scarce region. Water SA 2010, 36, 451–460. [Google Scholar] [CrossRef]
- Yu, P.; Xu, H.; Liu, S.; Mu, Q.; Zhang, Q.; An, H.; Fu, J. Spatial distribution pattern changes of oasis soil types in manasi river basin, arid northwestern China. Catena 2011, 87, 253–259. [Google Scholar] [CrossRef]
- Wen, X.; Diao, M.; Wang, D.; Meng, G. Hydrochemical characteristics and salinization processes of groundwater in the shallow aquifer of eastern laizhou bay, China. Hydrological Processes 2012, 26, 2322–2332. [Google Scholar] [CrossRef]
- Visconti, F.; de Paz, J.M. Prediction of the soil saturated paste extract salinity from extractable ions, cation exchange capacity, and anion exclusion. Soil Res. 2012, 50, 536. [Google Scholar] [CrossRef]
- Noguchi, S.; Tsuboyama, Y.; Sidle, R.C.; Hosoda, I. Subsurface runoff characteristics from a forest hillslope soil profile including macropores, hitachi ohta, Japan. Hydrol. Process. 2010, 15, 2131–2149. [Google Scholar] [CrossRef]
- Deng, L.J.; Liu, L. Analysis on groundwater chemical composition based on gray relation. Ground Water 2009, 2, 17–19. [Google Scholar]
- Chao-Ming, L.I. Analysis relationship between every meteorological factor and evaporation with gray relation in shajingzi irrigation region. Ground Water 2009, 32, 98–100. [Google Scholar]
- Wei, G. Grey relational analysis model for dynamic hybrid multiple attribute decision making. Knowl.-Based Syst. 2011, 24, 672–679. [Google Scholar] [CrossRef]
- Foufoula-Georgiou, E.; Takbiri, Z.; Czuba, J.A.; Schwenk, J. The change of nature and the nature of change in agricultural landscapes: Hydrologic regime shifts modulate ecological transitions. Water Resour. Res. 2015, 51, 6649–6671. [Google Scholar] [CrossRef] [Green Version]
Figure 1.
Location map of the study area: (a) map showing the location of the study area in China; (b) map showing the location of Yaoba Oasis; and (c) map showing the land use and distribution in the study area.
Figure 1.
Location map of the study area: (a) map showing the location of the study area in China; (b) map showing the location of Yaoba Oasis; and (c) map showing the land use and distribution in the study area.

Figure 2.
Schematic of the geological section.

Figure 3.
Collection of soil and groundwater samples: (a) groundwater samples, (b) surface soil samples, and (c) profile soil samples. (13 June 2016, by Guoqing Cui).
Figure 3.
Collection of soil and groundwater samples: (a) groundwater samples, (b) surface soil samples, and (c) profile soil samples. (13 June 2016, by Guoqing Cui).

Figure 4.
Contour map of groundwater TDS in different seasons: (a) spring in 2018 and (b) autumn in 2018.
Figure 4.
Contour map of groundwater TDS in different seasons: (a) spring in 2018 and (b) autumn in 2018.

Figure 5.
Piper trilinear diagram of water chemical type for the three different areas of the region: (a) entire area, (b) east area, (c) middle area, and (d) west area.
Figure 5.
Piper trilinear diagram of water chemical type for the three different areas of the region: (a) entire area, (b) east area, (c) middle area, and (d) west area.

Figure 6.
Contour maps of the main components of groundwater: (a) Na+ + K+ (mg/L), (b) Mg2+ (mg/L), (c) Ca2+ (mg/L), (d) SO42− (mg/L), (e) Cl− (mg/L) and (f) HCO3− (mg/L).
Figure 6.
Contour maps of the main components of groundwater: (a) Na+ + K+ (mg/L), (b) Mg2+ (mg/L), (c) Ca2+ (mg/L), (d) SO42− (mg/L), (e) Cl− (mg/L) and (f) HCO3− (mg/L).

Figure 7.
Total salt content at different sampling depths.

Figure 8.
Tree map of soil salinity clustering analysis.

Figure 9.
Soil salinity degree of the study area.

Figure 10.
Component content of soil profiles: (a) 0–10 cm and (b) 10–60 cm.

Figure 11.
Groundwater component content.

Figure 12.
Gray correlation image between soil salinity content and groundwater.

Figure 13.
Gray correlation between soil salinity content at different depths and groundwater: (a) 0–10 cm, (b) 10–20 cm, (c) 30–40 cm, (d) 40–50 cm, (e) 50–60 cm, (f) 60–80 cm, (g) 80–100 cm, (h) 100–120 cm, and (i) 120–140 cm.
Figure 13.
Gray correlation between soil salinity content at different depths and groundwater: (a) 0–10 cm, (b) 10–20 cm, (c) 30–40 cm, (d) 40–50 cm, (e) 50–60 cm, (f) 60–80 cm, (g) 80–100 cm, (h) 100–120 cm, and (i) 120–140 cm.


Table 1.
Statistics of groundwater characteristics.
| Time | Statistics | EC (mS/cm) | pH | Content of Main Ions (mg/L) | ||||||
|---|---|---|---|---|---|---|---|---|---|---|
| K+ + Na+ | Ca2+ | Mg2+ | Cl− | SO42− | HCO3− | TDS | ||||
| Jun. | Min | 0.74 | 6.81 | 92.50 | 25.10 | 39.50 | 70.90 | 138.10 | 158.70 | 581.40 |
| Max | 5.79 | 7.99 | 1740.10 | 217.90 | 302.40 | 1241.00 | 2443.50 | 158.70 | 5845.60 | |
| Mean | 2.14 | 7.71 | 326.59 | 94.27 | 125.26 | 385.84 | 623.19 | 257.31 | 1683.81 | |
| SD | 1.03 | 0.17 | 239.39 | 42.22 | 59.75 | 251.28 | 389.20 | 55.23 | 939.03 | |
| CV (%) | 48.16 | 2.18 | 73.30 | 44.78 | 47.70 | 65.13 | 62.45 | 21.46 | 55.77 | |
| Nov. | Min | 0.44 | 7.09 | 90.10 | 35.10 | 42.50 | 53.20 | 192.10 | 128.10 | 580.80 |
| Max | 4.34 | 8.12 | 942.50 | 240.50 | 282.60 | 1134.60 | 1464.90 | 488.20 | 3860.90 | |
| Mean | 2.09 | 7.72 | 392.76 | 118.01 | 137.76 | 452.20 | 766.74 | 254.46 | 1994.70 | |
| SD | 0.22 | 1.27 | 206.01 | 60.27 | 71.14 | 309.06 | 368.08 | 68.66 | 955.71 | |
| CV (%) | 60.61 | 2.90 | 52.45 | 51.07 | 51.64 | 68.35 | 48.01 | 26.98 | 47.91 | |
Table 2.
Statistical table of salinization soil classification.
| Class | Non-Salinization | Weak Salinization | Medium Salinization | Strong Salinization |
|---|---|---|---|---|
| Salt content (g/kg) | <1 | 1–2 | 2–4 | >4 |
| Number of samples | 12 | 24 | 5 | 3 |
| Percent (%) | 27.3 | 54.5 | 11.4 | 6.8 |
Table 3.
Statistical characteristics of soil salinity at different depths.
| Depth/cm | pH | Total Salt Content/% | CO32− | HCO3− | Cl− | SO42− | Ca2+ | Mg2+ | K+ | Na+ | |
|---|---|---|---|---|---|---|---|---|---|---|---|
| 0–10 | Mean | 8.39 | 0.9 | 0.02 | 0.34 | 7.69 | 3.56 | 3.79 | 1.32 | 0.10 | 10.86 |
| Max | 8.6 | 2.23 | 0.06 | 0.4 | 18.75 | 16.42 | 12.95 | 4.52 | 0.25 | 34.41 | |
| Min | 7.9 | 0.03 | 0 | 0.26 | 0.12 | 0.05 | 0.1 | 0.14 | 0.01 | 0.13 | |
| Std. | 0.29 | 1.13 | 0.03 | 0.06 | 10.03 | 7.19 | 6.14 | 2.14 | 0.1 | 15.33 | |
| CV | 0.03 | 1.27 | 1.05 | 0.18 | 1.3 | 2.02 | 1.62 | 1.62 | 1.04 | 1.41 | |
| 10–30 | Mean | 8.52 | 0.71 | 0.08 | 0.38 | 4.94 | 5.26 | 2.6 | 0.46 | 0.08 | 8.18 |
| Max | 9.25 | 2.36 | 0.29 | 0.8 | 12.3 | 22.19 | 11.9 | 1.1 | 0.31 | 24.35 | |
| Min | 8.1 | 0.02 | 0 | 0.24 | 0.18 | 0 | 0.1 | 0.07 | 0 | 0.16 | |
| Std. | 0.43 | 1 | 0.12 | 0.24 | 6.12 | 9.56 | 5.2 | 0.48 | 0.15 | 11 | |
| CV | 0.05 | 1.42 | 1.39 | 0.61 | 1.24 | 82 | 2 | 1.06 | 1.92 | 1.34 | |
| 30–60 | Mean | 8.6 | 0.63 | 0.18 | 0.41 | 5.84 | 3.35 | 2.97 | 0.6 | 0.05 | 7.26 |
| Max | 9.15 | 1.48 | 0.84 | 0.77 | 14.17 | 10.3 | 11.11 | 1.78 | 0.12 | 21 | |
| Min | 8.4 | 0.04 | 0 | 0.22 | 0.3 | 0 | 0.14 | 0.1 | 0 | 0.33 | |
| Std. | 0.31 | 0.73 | 0.37 | 0.22 | 6.84 | 4.6 | 5.43 | 0.8 | 0.O5 | 9.11 | |
| CV | 0.04 | 1.17 | 2 | 0.53 | 1.17 | 1.37 | 1.83 | 33 | 1.21 | 1.25 | |
| 60–90 | Mean | 8.62 | 0.89 | 0.l9 | 0.5 | 6.88 | 4.48 | 1.08 | 0.44 | 0.09 | l2.28 |
| Max | 9.4 | 2.66 | 0.86 | 0.79 | 19.66 | 20.24 | 3.94 | 0.5 | 0.31 | 37.4 | |
| Min | 8.35 | 0.06 | 0 | 0.3 | 0.31 | 0 | 0.09 | 0.35 | 0 | 0.43 | |
| Std. | 0.44 | l.10 | 0.38 | 0.19 | 8.57 | 8.82 | 1.91 | 0.07 | 0.15 | 16.09 | |
| CV | 0.05 | 1.25 | 1.93 | 0.37 | 1.25 | 1.97 | 1.76 | 0.l5 | 1.77 | 1.31 | |
| 90–120 | Mean | 8.86 | 0.84 | 0.25 | 0.41 | 7.03 | 5.6 | 2.89 | 0.28 | 0.02 | 9.93 |
| Max | 9.65 | 2.95 | 1.06 | 0.6 | 24.49 | 21.46 | 12.4 | 0.5 | 0.03 | 33.33 | |
| Min | 8.35 | 0.05 | 0 | 0.28 | 0.l5 | 0 | 0.05 | 0.09 | 0.01 | 0.27 | |
| Std. | 0.5 | 1.21 | 0.46 | 0.13 | 10.04 | 8.96 | 5.36 | 0.2 | 0.01 | 13.64 | |
| CV | 0.06 | l.44 | 1.81 | 0.32 | 1.43 | I.60 | 1.86 | 0.72 | 0.55 | 1.37 | |
| 120–140 | Mean | 8.67 | 0.83 | 0.06 | 0.5 | 6.57 | 5.1 | 1.75 | 0.58 | 0.12 | 12.02 |
| Max | 8.95 | 2.61 | 0.29 | 0.8 | 19.78 | 17.91 | 4.9 | 1.17 | 0.41 | 39.14 | |
| Min | 8.35 | 0.08 | 0 | 0.28 | 0.28 | 0.36 | 0.11 | 0.25 | 0.01 | 0.6 | |
| Std. | 0.25 | 1.05 | 0.13 | 0.27 | 8.02 | 7.31 | 2.21 | 0.41 | 0.19 | 16.14 | |
| CV | 0.03 | 1.26 | 1.98 | 0.55 | 1.22 | 1.43 | 1.26 | 0.71 | 1.57 | 1.34 | |
© 2019 by the authors. Licensee MDPI, Basel, Switzerland. This article is an open access article distributed under the terms and conditions of the Creative Commons Attribution (CC BY) license (http://creativecommons.org/licenses/by/4.0/).
Share and Cite
MDPI and ACS Style
Cui, G.; Lu, Y.; Zheng, C.; Liu, Z.; Sai, J. Relationship between Soil Salinization and Groundwater Hydration in Yaoba Oasis, Northwest China. Water 2019, 11, 175. https://doi.org/10.3390/w11010175
AMA Style
Cui G, Lu Y, Zheng C, Liu Z, Sai J. Relationship between Soil Salinization and Groundwater Hydration in Yaoba Oasis, Northwest China. Water. 2019; 11(1):175. https://doi.org/10.3390/w11010175
Chicago/Turabian StyleCui, Guoqing, Yudong Lu, Ce Zheng, Zhiheng Liu, and Jiamei Sai. 2019. "Relationship between Soil Salinization and Groundwater Hydration in Yaoba Oasis, Northwest China" Water 11, no. 1: 175. https://doi.org/10.3390/w11010175
Note that from the first issue of 2016, this journal uses article numbers instead of page numbers. See further details here.