Atmospheric Rivers over the Arctic: Lagrangian Characterisation of Their Moisture Sources
by
 , , , and
Marta Vázquez
1,* ,
,
Iago Algarra
1,
Jorge Eiras-Barca
1,
Alexandre M. Ramos
2,
Raquel Nieto
1 and
and
Luis Gimeno
1 1
Environmental Physics Laboratory (EPhysLab), Facultade de Ciencias, Universidad de Vigo, Ourense 32004, Spain
2
Instituto Dom Luiz, Universidade de Lisboa, 1749-016 Lisboa, Portugal
*
Author to whom correspondence should be addressed.
Water 2019, 11(1), 41; https://doi.org/10.3390/w11010041
Submission received: 5 September 2018
/
Revised: 14 December 2018
/
Accepted: 19 December 2018
/
Published: 26 December 2018
(This article belongs to the Special Issue Selected Papers from the 1st International Electronic Conference on the Hydrological Cycle (ChyCle-2017))
Abstract
:In recent years, the Arctic has become a subject of special interest due to the drastic effect of climate change over the region. Despite that there are several mechanisms that influence the Arctic region; some recent studies have suggested significant influences of moisture transport over the observed loss of sea ice. Moisture transport can affect the region in different ways: direct precipitation over the region, radiative effect from the cloud cover and through the release of latent heat. Atmospheric rivers (ARs) represent one of the main events involved in moisture transport from the tropics to the mid-latitudes and despite having been shown especially relevant on the northward advection, their effect over the Arctic has not been deeply investigated. The aim of this work was to establish the groundwork for future studies about the effect of ARs linked to moisture transport over the Arctic region. For this purpose, an automated algorithm was used to identify regions of maximum AR occurrence over the Arctic. This was done by analysing the number of AR detections every month over a band of 10° of latitude centred on 60° N. The Lagrangian model FLEXPART was used to find the areas where the ARs take their moisture to the Arctic. Using this model, the anomalous moisture contribution to these baroclinic structures was analysed taking into account only the dates of AR occurrence. From the results, it appears that the main moisture sources for AR events extend over the North Atlantic and North Pacific oceans; moreover, the local input of moisture over the region of maximum AR occurrence seems to be especially relevant. In general terms, moisture comes from major evaporative areas over the western part of the oceanic regions in the band between 30° and 40° N for most months in the year, showing a continental origin in the summer months. This behaviour agrees with the climatological moisture transport into the Arctic determined in previous studies. However, in special association with AR events, an intensification of local moisture uptake is observed over the area of maximum AR activity and nearby. The study of the origin of this moisture and associated anomalies for Arctic ARs is an important step in the analysis of the effect of these structures on the Arctic environment.
1. Introduction
Important changes have been observed in the Arctic region in recent decades, many of them being related to climate change in particular for example, [1,2]. On this topic, the change in sea ice extent that has occurred in recent years is especially relevant showing a downward trend in the last few decades. This decrease has occurred in all seasons [3,4,5,6] and has been more pronounced in late summer [7,8], when reaches its minimum annual value. The possible causes of the decrease in sea ice extent are several and are triggered by feedback processes: increased temperatures, changing wind patterns and atmospheric moisture transport for example, [9,10,11]. Moreover, the changes in moisture transport from lower latitudes have been suggested to have an important influence over the Arctic region [12,13,14].
Multiple mechanisms are responsible for global moisture transport, Atmospheric Rivers (ARs) being one of the most important. ARs are usually associated with transient eddies and have been shown to dominate the transport of poleward moisture [15]. The transient moisture transport associated with the occurrence of extreme events has been estimated to contribute to the total poleward moisture transport across 60° N around 36–38% in winter and 32% in summer [16,17]. ARs are long and narrow corridors which transport water vapour along meridians from the tropics to the extra-tropics. Despite covering only about 10% of the Earth’s circumference, these atmospheric structures account for over 80–90% of the total poleward water vapour transport at mid-latitudes [18,19] and are also associated with extreme precipitation events [20,21,22,23]. A mini review of the general characteristics of ARs was conducted by Gimeno et al. [24].
According to Sorterberg and Walsh [25], the interannual variability of moisture transport toward the Arctic is mainly triggered by the variability of cyclone activity over Greenland and the Eastern Siberia Sea. This cyclone activity also leads the AR activity in these latitudes. Despite that its formation may be independent of the genesis and development of cyclones, cyclone activity may still have an influence on ARs development [18,26]. Several studies have suggested the influence of cyclones and ARs on the extent of sea ice across the Arctic region. Hegyi and Taylor [27] have demonstrated that episodic Arctic ARs actively contribute to the evolution of Arctic sea ice during the ice growth season. Moreover, Komatsu et al. [28] investigated the influence of Siberian ARs entering the Arctic and noted an amplification of warming over the region in summer. The effects of enhanced moisture transport can be diverse. On the one hand, enhanced moisture transport may produce increased down-welling longwave fluxes, warming the Arctic and affecting the sea ice extent for example, [29]. On the other hand, precipitation can have different effects on the sea ice depending on the type of precipitation and its intensity [30].
Despite the importance of ARs in moisture transport and of their influence on Arctic warming for example, [31] and on the extent of sea ice [27,28], their influences on the region have not yet been deeply investigated in relation to the terms pointed out here. Some studies have investigated the moisture sources for ARs from a Eulerian [32] or a Lagrangian point of view for different regions in Europe for example, [33,34,35], North America [36,37,38] and South Africa [39]; however, as far as we know, no such studies have been performed for the Arctic region. The aim of this work was to take the first step in a more complete analysis of the evolution of ARs moving toward the Arctic and their influence over the region. To this end, the regions near the Arctic most affected by ARs were identified to determine the origins of the moisture associated with these ARs throughout the period 1997–2014.
2. Materials and Methods
2.1. Area of Maximum Occurrence of Atmospheric Rivers to the Arctic
In order to investigate the incidence of ARs over the Arctic region, the ARs database developed by Guan and Waliser [19] was used. This database provides the locations of the central axes of ARs on a global scale with horizontal resolution of 2.5° × 2.5° through the year with a time step of 6 h (00, 06, 12, 18 UTC). AR detection is based on computing of the vertically integrated horizontal water vapour transport (IVT) from 1000 to 300 hPa, taking into account the specific humidity and wind field retrieved from the ECMWF Interim reanalysis (ERA-Interim) [40]. In each grid cell, the 85th percentile was applied as a threshold with a fixed lower limit of 100 kg·m−1s−1 (for polar regions). Once the threshold was applied, the coherence on the IVT direction was analysed by discarding those regions in which more than half of the grid cells showed deviations of more than 45° from the mean IVT and in those that did not have an appreciated poleward component. Further details can be found at Guan and Waliser [19]. From this procedure, a set of ARs was detected.
From the previous database, the regions of maximum occurrence of ARs were identified for every season of the year for the period 1997–2014. Only ARs reaching the Arctic region were taken into account. Thus, a 10° latitudinal band centred on 60° N all around the Arctic was selected to identify the areas of maximum occurrence. In order to define this area seasonally, the total number of AR events occurring between 55° and 65° N were calculated for every longitude. The 75th percentile was calculated for every longitudinal series to objectively define the maximum values of the field. So, the areas of maximum AR entrance into the Arctic was defined as those regions where the ARs frequency was greater than this value. The boxes defined for those longitudinal areas and between 55° and 65° N are hereinafter described as the ‘ARs pathway boxes’ to the Arctic.
2.2. Moisture Sources
In order to identify the source regions of moisture associated with the AR pathway boxes, the outputs of the FLEXPART v9.0 model [41] run in backward mode was used. ERA-Interim reanalysis data at 1° horizontal resolution was used to feed FLEXPART the initial and boundary conditions commonly used [41,42]. In our model configuration, the complete atmosphere is divided into the maximum number (about 2 million) of air parcels (or particles) which are dispersed following the 3-D wind field. For every air parcel, the specific humidity (q, measured in g/kg) and the position of the grid cell is stored every 6 h and moisture changes can be expressed as
in which e and p represent moisture increases and decreases, m is the mass of the particle expressed in kg and t is the time. If (e − p) for all the particles at every grid position is considered, the total surface freshwater flux (E − P) can be obtained as follows.
where (E) and (P) are the rates of evaporation and precipitation per unit area, respectively; A is the area of the grid cell and K is the total number of particles in the atmospheric column. This methodology developed by Stohl and James [42,43] allows tracking of trajectories backward and forward in time. Forward tracking from source areas allows the study of moisture losses (regions where precipitation exceed evaporation) along the trajectories and then the identification of sinks of moisture ). In addition, backward tracking from a specific area allows identification of those regions where particles gained moisture (evaporation exceed precipitation) before reaching the area of interest. In our case, in other words, moisture sources were indicated by (). This methodology has been widely used in moisture transport analysis over different areas and has been associated with different precipitation systems [33,44,45].
In this study, the backward methodology mentioned above was applied in order to find those regions where there is anomalous moisture available to be taken up by the ARs reaching the Arctic. The same procedure employed by Ramos et al. [33,39] was applied. Following this, backward trajectories were tracked for 10 days at 6 h intervals (40 time steps) for every AR event identified across the area of maximum AR occurrence every month. This period of 10 days is considered the average time of water vapour residence in the atmosphere [46] and for which Lagrangian trajectories can be considered relatively accurate [41].
With the purpose of computing the moisture uptake associated with ARs events, only positive values of were retained at each and every time step. The procedure used to obtain the area of anomalous moisture uptake is the following:
- (a)
- Considering every case of AR occurrence at 6 h intervals (taking into account the 10 day backward trajectories), the moisture uptake () is calculated individually for every case.
- (b)
- The ‘climatology’ for the corresponding ARs cases is obtained, taking into account the moisture uptake for the corresponding time step over the entire period 1997–2014.
In this work, an AR case was defined as every one of the times at which an AR occurred within a 6 h interval. For example, if an AR took place from 00:00 UTC to 18:00 UTC on 15 September 1999, 4 AR cases would be considered (00, 06, 12 and 18 UTC). The climatology was calculated considering only the dates of ARs occurrence but included the entire 18-year period taken into account in this study (1997–2014). For instance, if an AR case was detected on 15 September 1999 at 12:00 UTC over the complete ARs pathway boxes previously defined, the climatology would consider the 15 September at 12:00 for every year within the period 1997–2014. This procedure was carried out for the sake of saving computing resources, by avoiding dates when AR activity was negligible.
The area of anomalous moisture uptake for every individual AR case was calculated by the difference between the (a) AR-case moisture uptake and (b) ‘climatological’ moisture uptake.
Once the anomalous moisture uptake was calculated for every case, the total amount associated with AR events was calculated by adding in the positive anomalies in moisture uptake for every individual case. Thus, we obtained those areas where the ARs gain more moisture along their trajectories. This result will be denoted hereinafter as . In the same way as for the moisture uptake anomalies, the total moisture uptake associated with ARs cases was obtained by adding the moisture sources (0 values) for all the cases identified. These results are denoted as .
3. Results
3.1. Maximum Areas of AR Occurrence in the Arctic Region
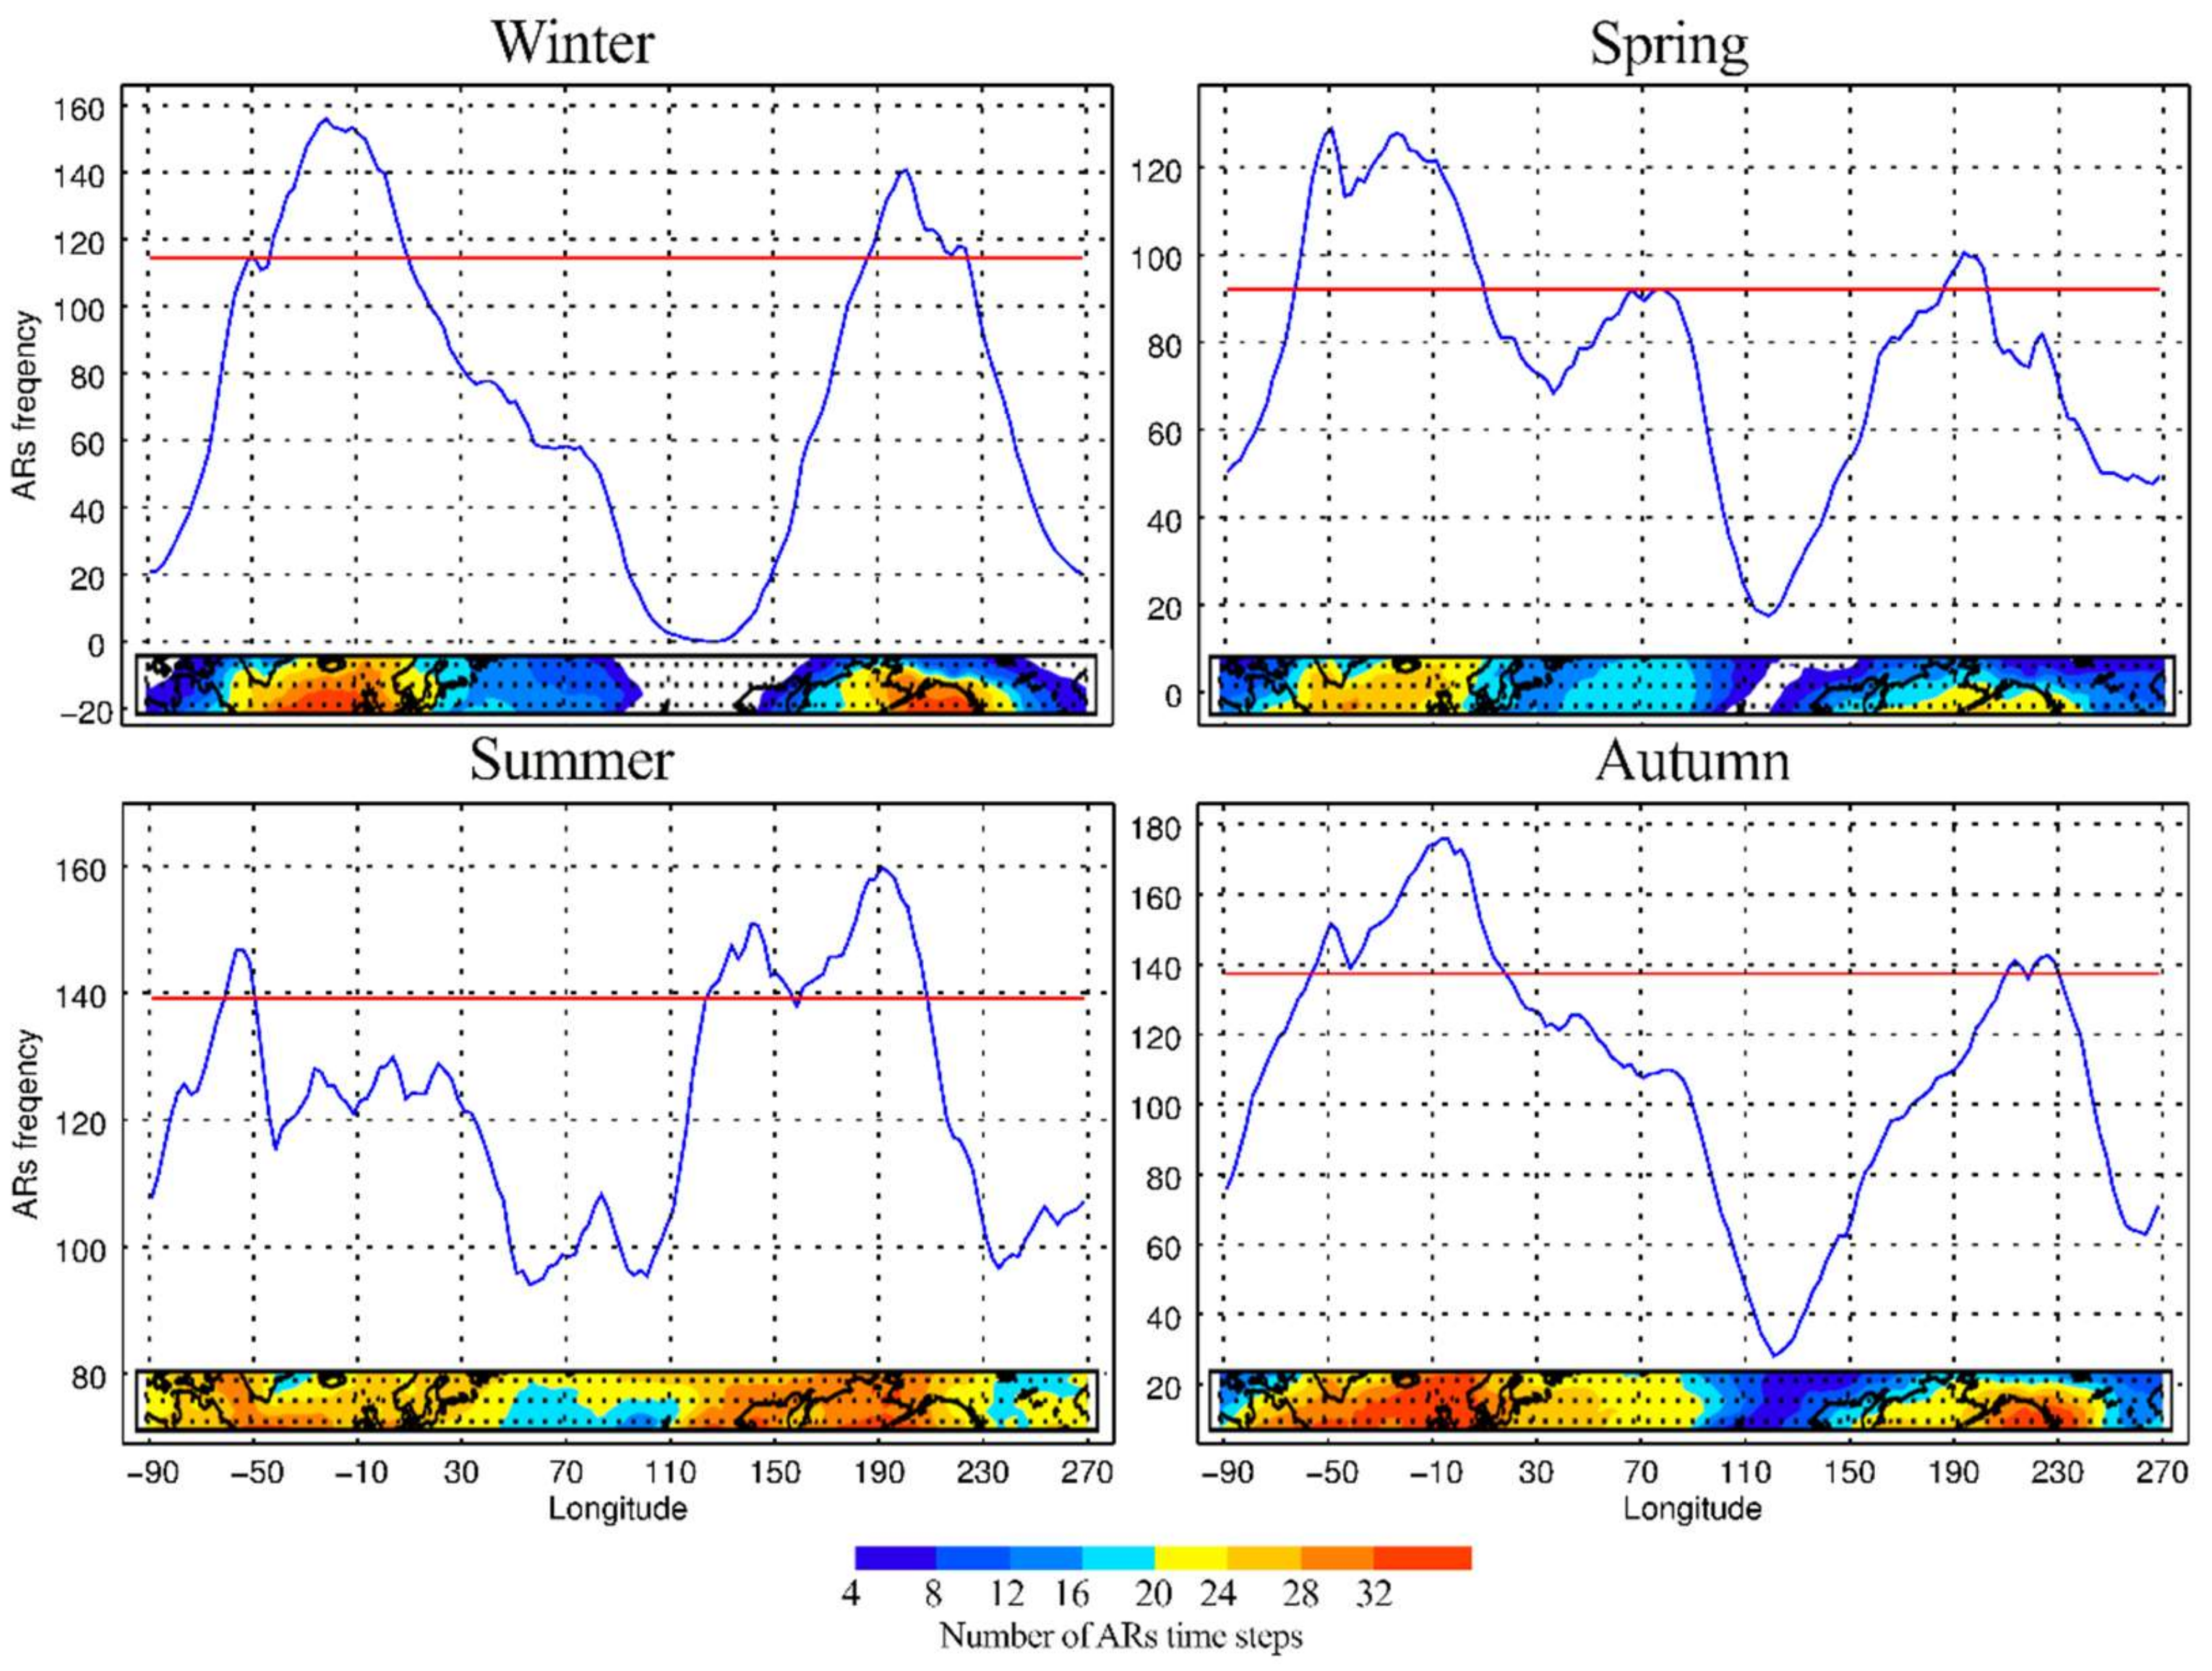
In order to define the areas of maximum AR occurrence, Figure 1 shows the number of ARs for each longitude from 55° to 65° N (line plot) and their geographical distribution for every season (colour band map). On these figures, blue lines represent the longitudinal variability in the number of ARs and the horizontal red line represents the value of its 75th percentile. Embedded at the bottom for every month, the AR frequency that appears represents every grid point over the longitudinal band previously defined. On this plot, reddish colours represent higher occurrence and bluish colours represent lower AR frequency.
In general, the regions of major occurrence are located mainly over the Atlantic sector (from 80° W to 60° E) and the Pacific sector (from 120° to 240° E). The maximum AR activity on the edge of the Arctic occurs in autumn for the Atlantic sector and in summer for the Pacific sector (coloured map); however, minimal activity takes place in spring for both sectors.
For the Atlantic sector, most of the ARs that reach the Arctic region cross 60° N over the Norwegian Sea on a band between 50° W and 15° E for every season. Moreover, the Davis Strait is an important pathway for the ARs entering the Arctic. This region is the main entrance area in summer and shows high AR occurrence in spring and autumn too. Despite it was not defined as an ARs pathway region from the methodology applied, some entrance occurs over Europe in autumn, being especially relevant in October (see Supplementary Materials, Figure S1).
For the Pacific sector, three different regions of AR activity can be defined: the Gulf of Alaska, the Bering Sea and North Asia. In winter and autumn most of the ARs enter the Arctic across the Gulf of Alaska, between 190° and 240° E approximately. However, in the remaining seasons, AR pathway is displaced westward into the Bering Sea. This is especially relevant in summer when the ARs pathway box expands from 127° to 210° E including continental areas over Siberia, the complete Bering Sea and part of the Gulf of Alaska. In general terms the Pacific ARs pathway boxes show lower extension than Atlantic ones, being summer the only exception.
It is important to highlight the summer situation, not only for the higher Pacific box extension but also for the homogeneity on the AR occurrence. In this season more than 20 ARs time steps are identified at some grid point of the complete longitudinal band. Moreover, it shows high intraseasonal variability in this season (see Supplementary Materials, Figure S1). June show the lower AR occurrence, not only referred to summer but also to the whole year; however, in July and August, the occurrence highly increases especially over the Pacific sector in August. Important intraseasonal variability also occurs in autumn. The number of ARs time steps identified per longitude decreased from 20 to 73 in September to 2 to 56 in November. Moreover, the Atlantic pathway showed an important variability on its location.
3.2. Climatology for the Moisture Sources
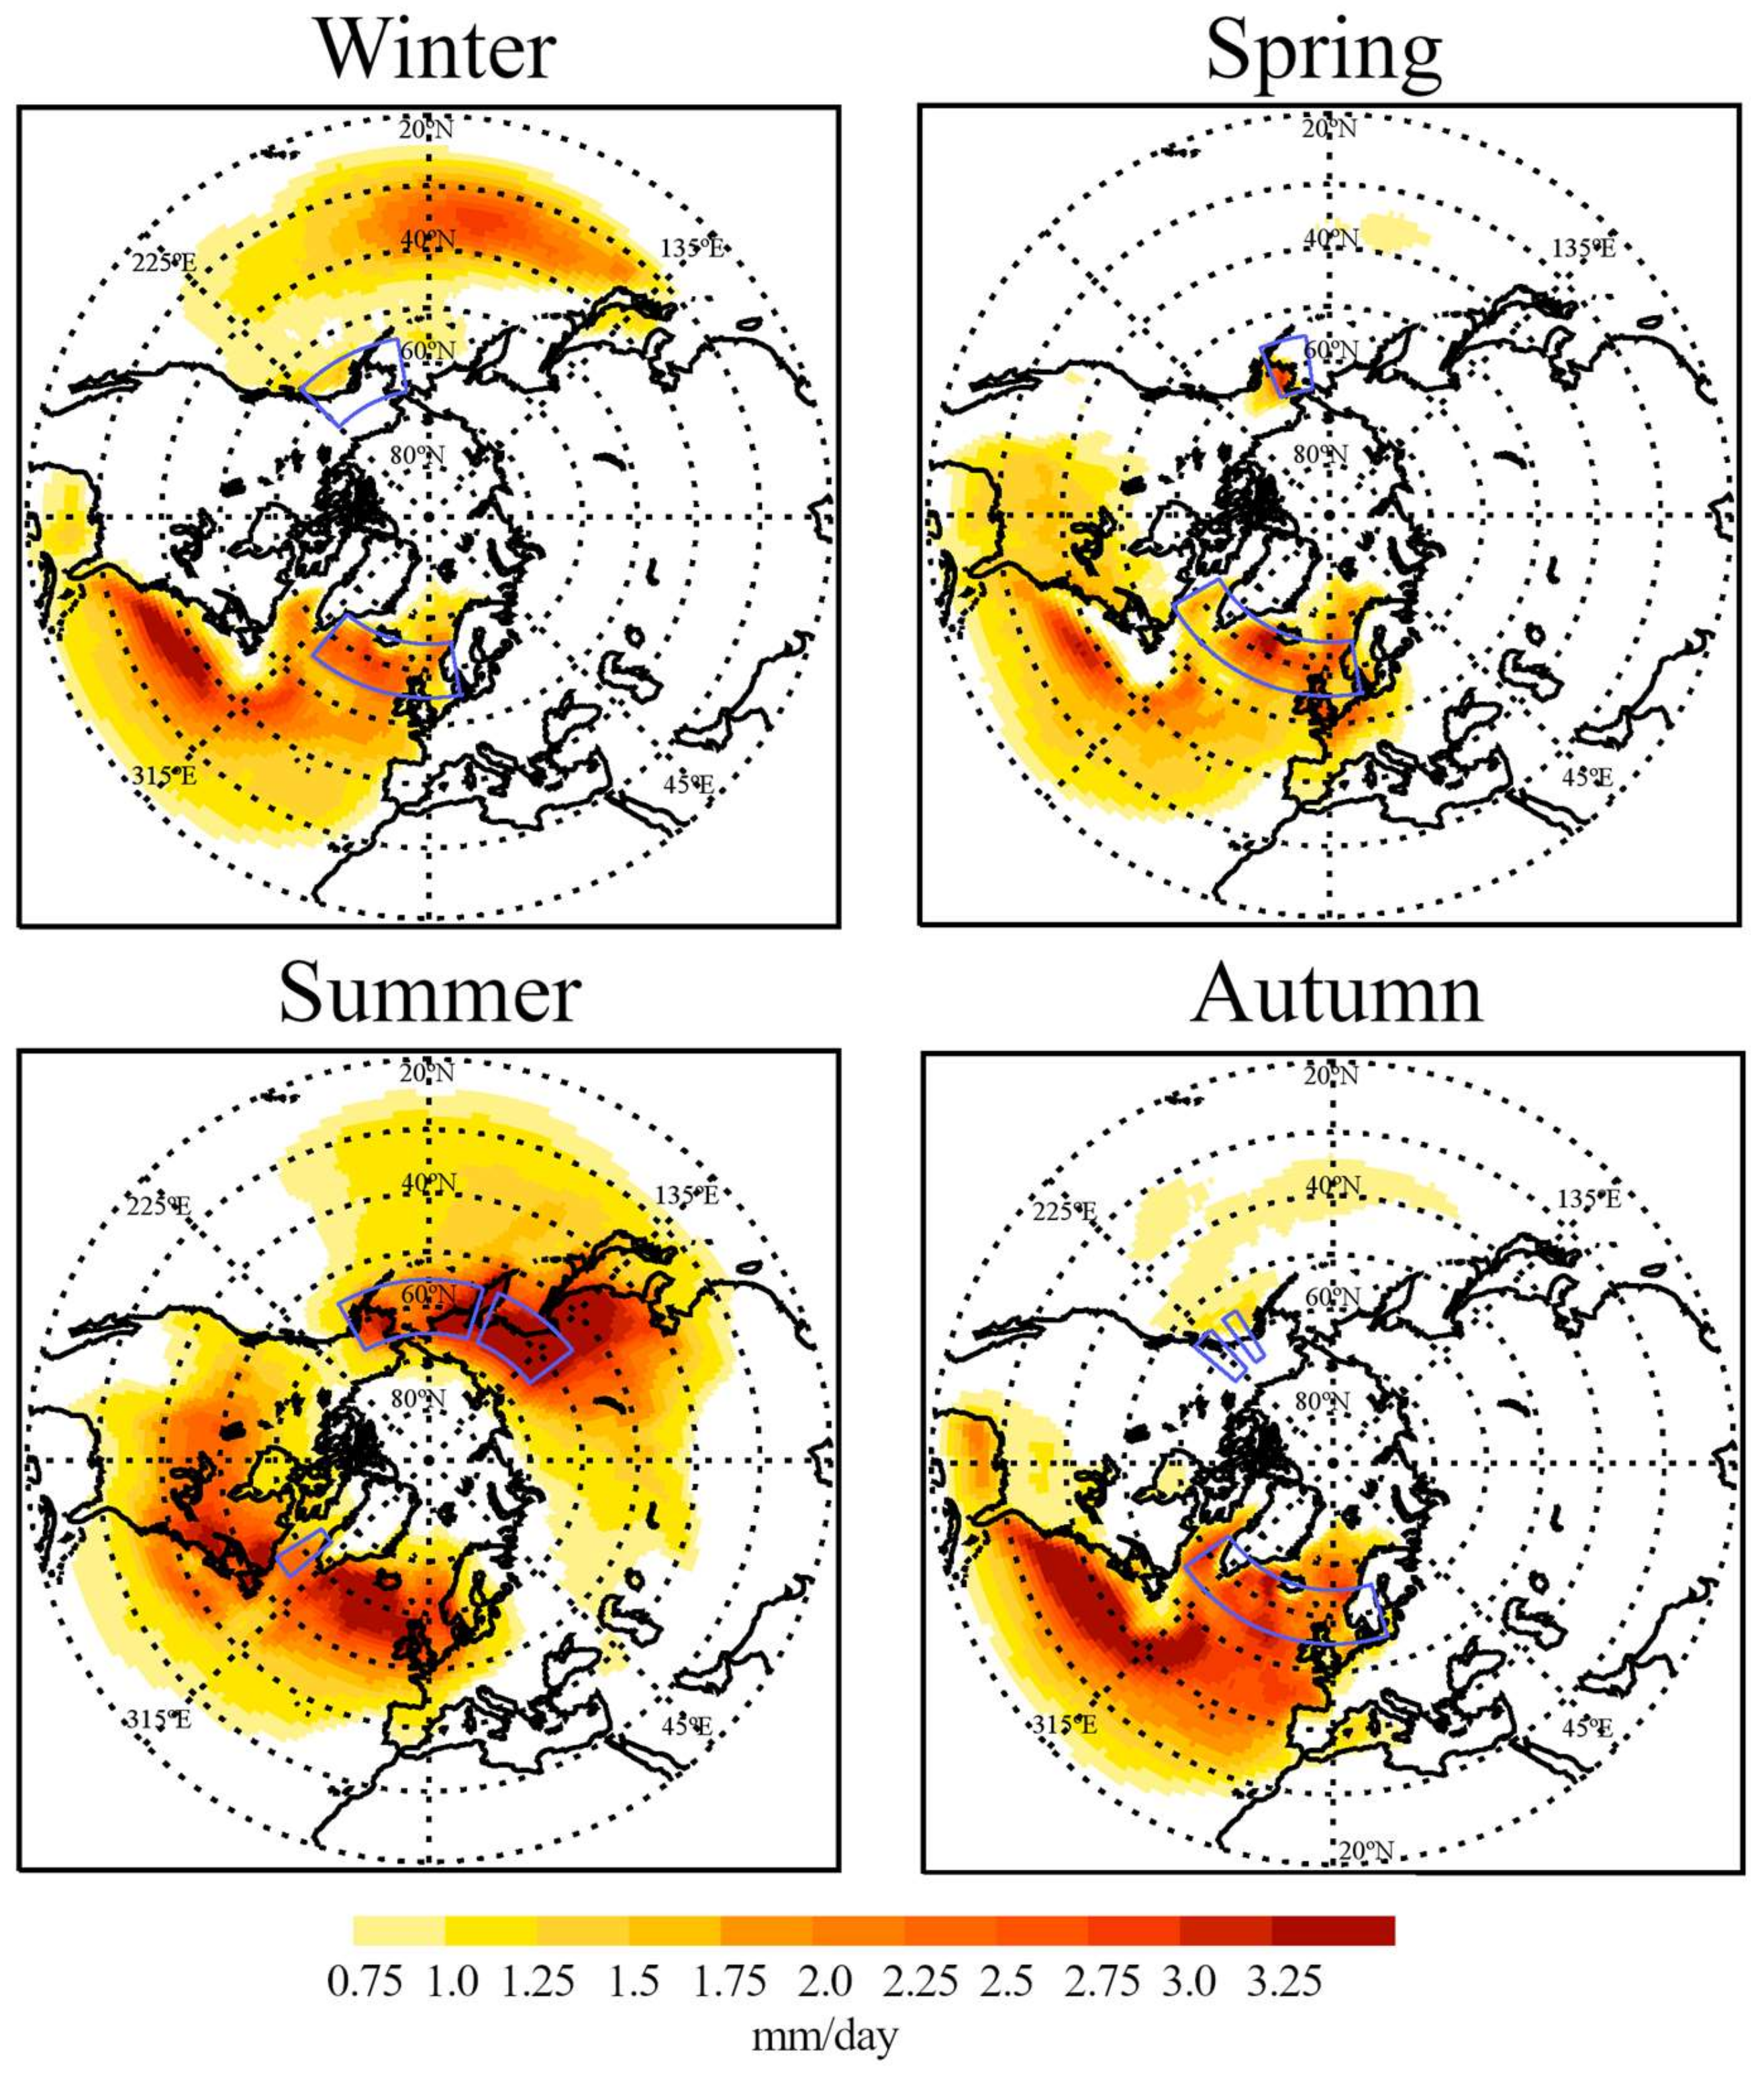
Once the areas of the AR pathways into the Arctic were defined for every month, it was possible to analyse their sources of moisture. For this purpose, Figure 2 shows the climatological sources, those regions with values, for every season for the entire period 1997–2014.
For the Atlantic sector, most of the moisture uptake occurs over the North Atlantic, the Labrador Sea and the Norwegian Sea. For all the season with the exception of summer, shows important moisture uptake over the western Atlantic Ocean between 30° and 40° N. These sources expand north-eastward toward the Arctic. The moisture uptake over this area is especially intense in autumn, being the main moisture source for the Atlantic pathway box. Intense moisture uptake also occurs over the northern part of the ocean, the Davis Strait and the Norwegian Sea with values higher than 2 mm/day over most of these areas. Finally, for this season, some continental moisture uptake occurs over the east coast of the United States, however this continental contribution has lower intensity than the oceanic contribution. A maximum of also occurs over the pathway area in winter and spring expanding toward the Norwegian Sea. In spring some values appear over continental areas in the eastern part of North America and over Europe, showing higher values over the British Isles and northern Europe coast. In summer, continental moisture uptake highly increase referred to the previous season, especially over North America and the Scandinavian Peninsula. Concerning North America, the maximum occurs in areas over the Quebec Peninsula and the north-eastern part of the United States, however some moisture contribution appears from almost all of North America. Major moisture uptake in the oceanic areas is also found during this season, being located eastward of the ARs pathway box mainly to the east of Greenland and around 70°.
For the Pacific sector, the moisture sources are located mainly over the Pacific Ocean and eastern Asia. In winter, moisture uptake regions expand along the ocean from the western North Pacific to the Gulf of Alaska, with maximum located westward on the band between 30° and 40° N. In summer, however, the highest values of are located over continental areas. These areas show a remarkably intense moisture uptake with values higher than 3 mm/day over western Alaska and eastern Eurasia. In general, some moisture contribution to the ARs pathway box is observed over most of northern Eurasia. Moisture uptake is also observed over oceanic areas south of 50° N in the western Pacific; however, it shows values lower than 1.5 mm/day for most of the area. Higher values appear on northern latitudes over the Bering Sea and the Sea of Okhotsk. In spring and autumn, shows low values and extension. In spring, a small area with values lower than 1 mm/day appears over western Pacific between 30° and 40° N. Higher moisture uptake occurs over continental areas in western Alaska, coinciding with the position of the ARs pathway box. Finally, in autumn some moisture contribution to the box occurs over the Gulf of Alaska and a small area crossing the Pacific Ocean from west to east.
3.3. Anomalous Moisture Uptake
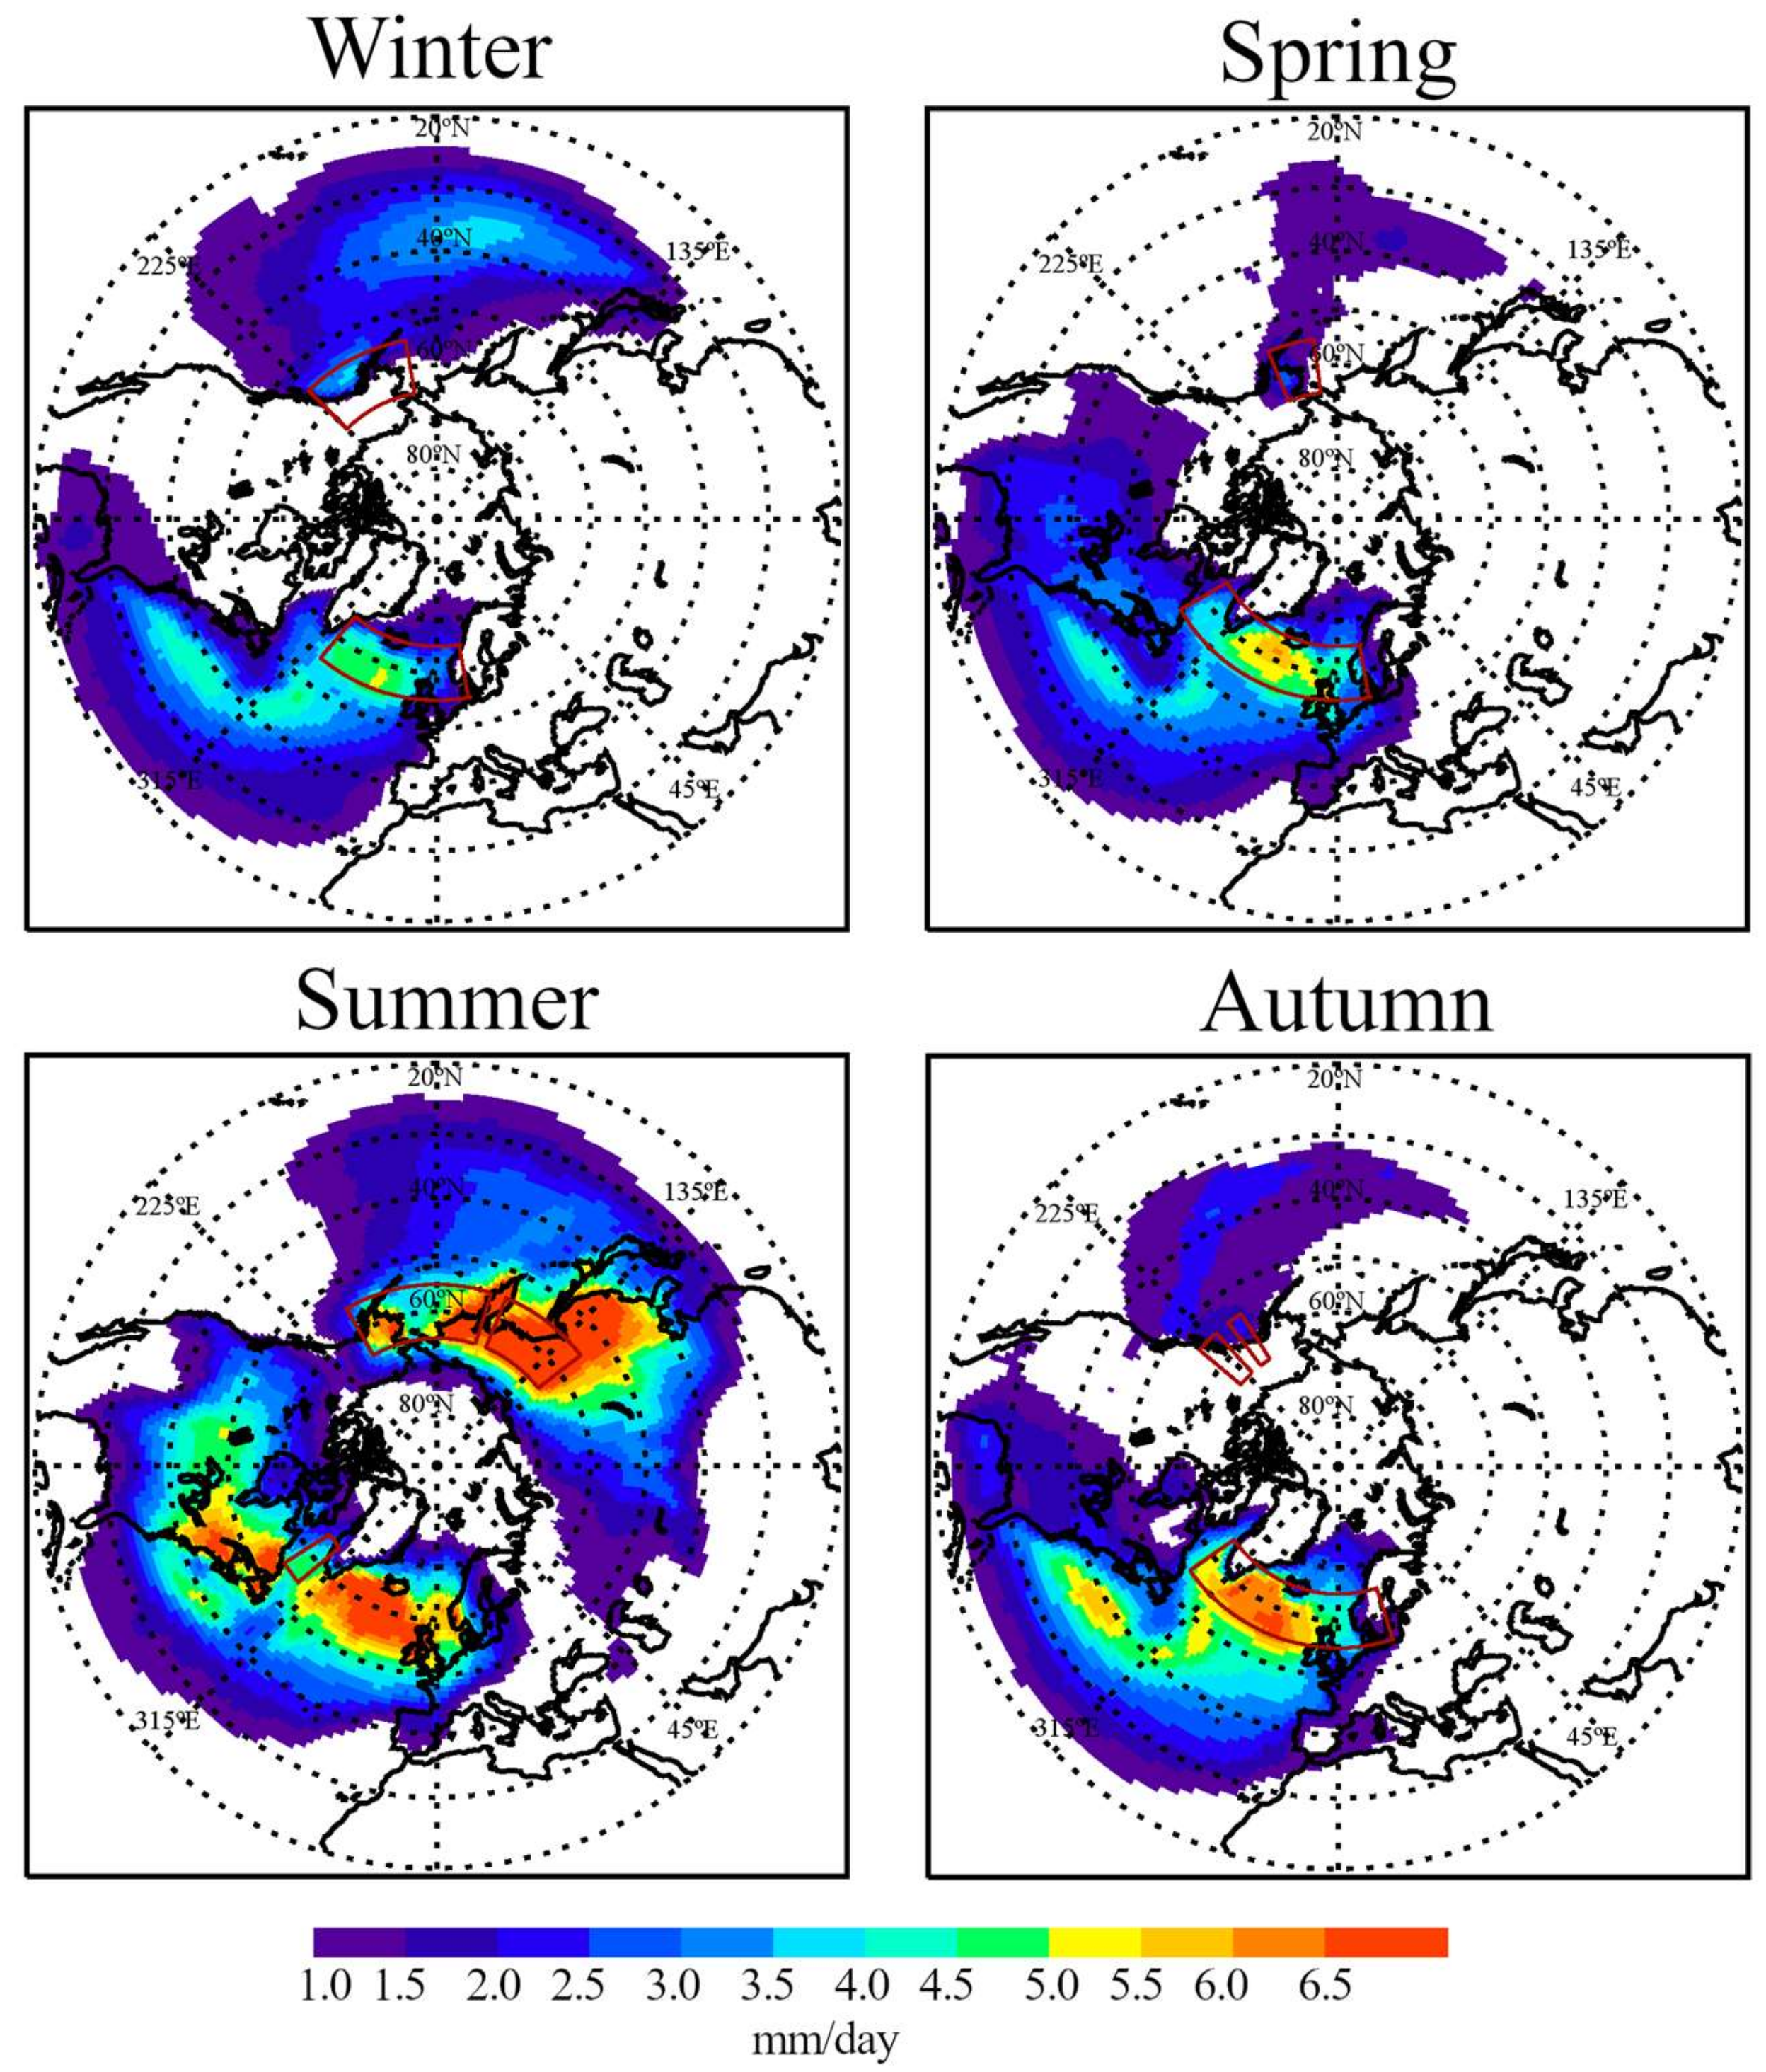
The climatological moisture sources for the AR pathway boxes (taking into count not only the ARs time steps) show where the moisture that feeds that region comes from, however the mechanism for the anomalous moisture uptake to the AR events can be different. In order to address which of those sources are specifically associated with AR events, Figure 3 shows anomalies in the moisture uptake for the AR events referring to the complete climatology for every season ().
In general positive anomaly values are found over the main ‘climatological’ sources, reinforcing them, for Arctic AR events (Figure 2). However, some differences should be addressed.
Concerning the Atlantic sector in winter, positive anomalies of moisture uptake associated with AR events appear over most of the North Atlantic Ocean and the Gulf of Mexico, coinciding with the AR climatological sources (Figure 2). However, the maximum increase in moisture uptake occurs over the oceanic AR pathway box (from the area to the east of the southern coast of Greenland and the western British Isles coast). The anomaly is weaker over the southern part of the North Atlantic Ocean, where the maximum moisture uptake is observed for the AR events climatology. In spring the situation is quite similar, however, the intensification of the moisture uptake over the ARs pathway box is higher and it expands into the Norwegian Sea and the Davis Strait. In summer, anomalous and climatological AR sources have a similar distribution. Higher values on for this season appear over the Quebec Peninsula and the northern Atlantic Ocean around 60° N. Finally, in autumn, the same pattern as for the winter and spring occurs. The highest increase of moisture uptake occurs over the pathway box. For these months some increase over continental areas of North America is also observed.
For the Pacific sector, in winter, despite that the main AR source is located over the North Pacific; this region shows similar increase in moisture uptake as that in the AR pathway box over the Gulf of Alaska. Moreover, positive anomalies occur over most of the ocean north of 30° N. In summer months, continental values show similar distribution as that of the climatological AR sources. Oceanic areas show lower anomalies than in the continental areas for these months. Finally, in spring and autumn, show the lower values. In spring, positive anomalies appear over the central part of the northern Pacific Ocean and expand westward between 30° and 40° N. In autumn the area showing the maximum positive anomaly expands south-westward from the Gulf of Alaska into the Pacific Ocean. In general, for spring and autumn, the shows a higher extension that the climatological ARs’ source areas.
3.4. A Case of Study
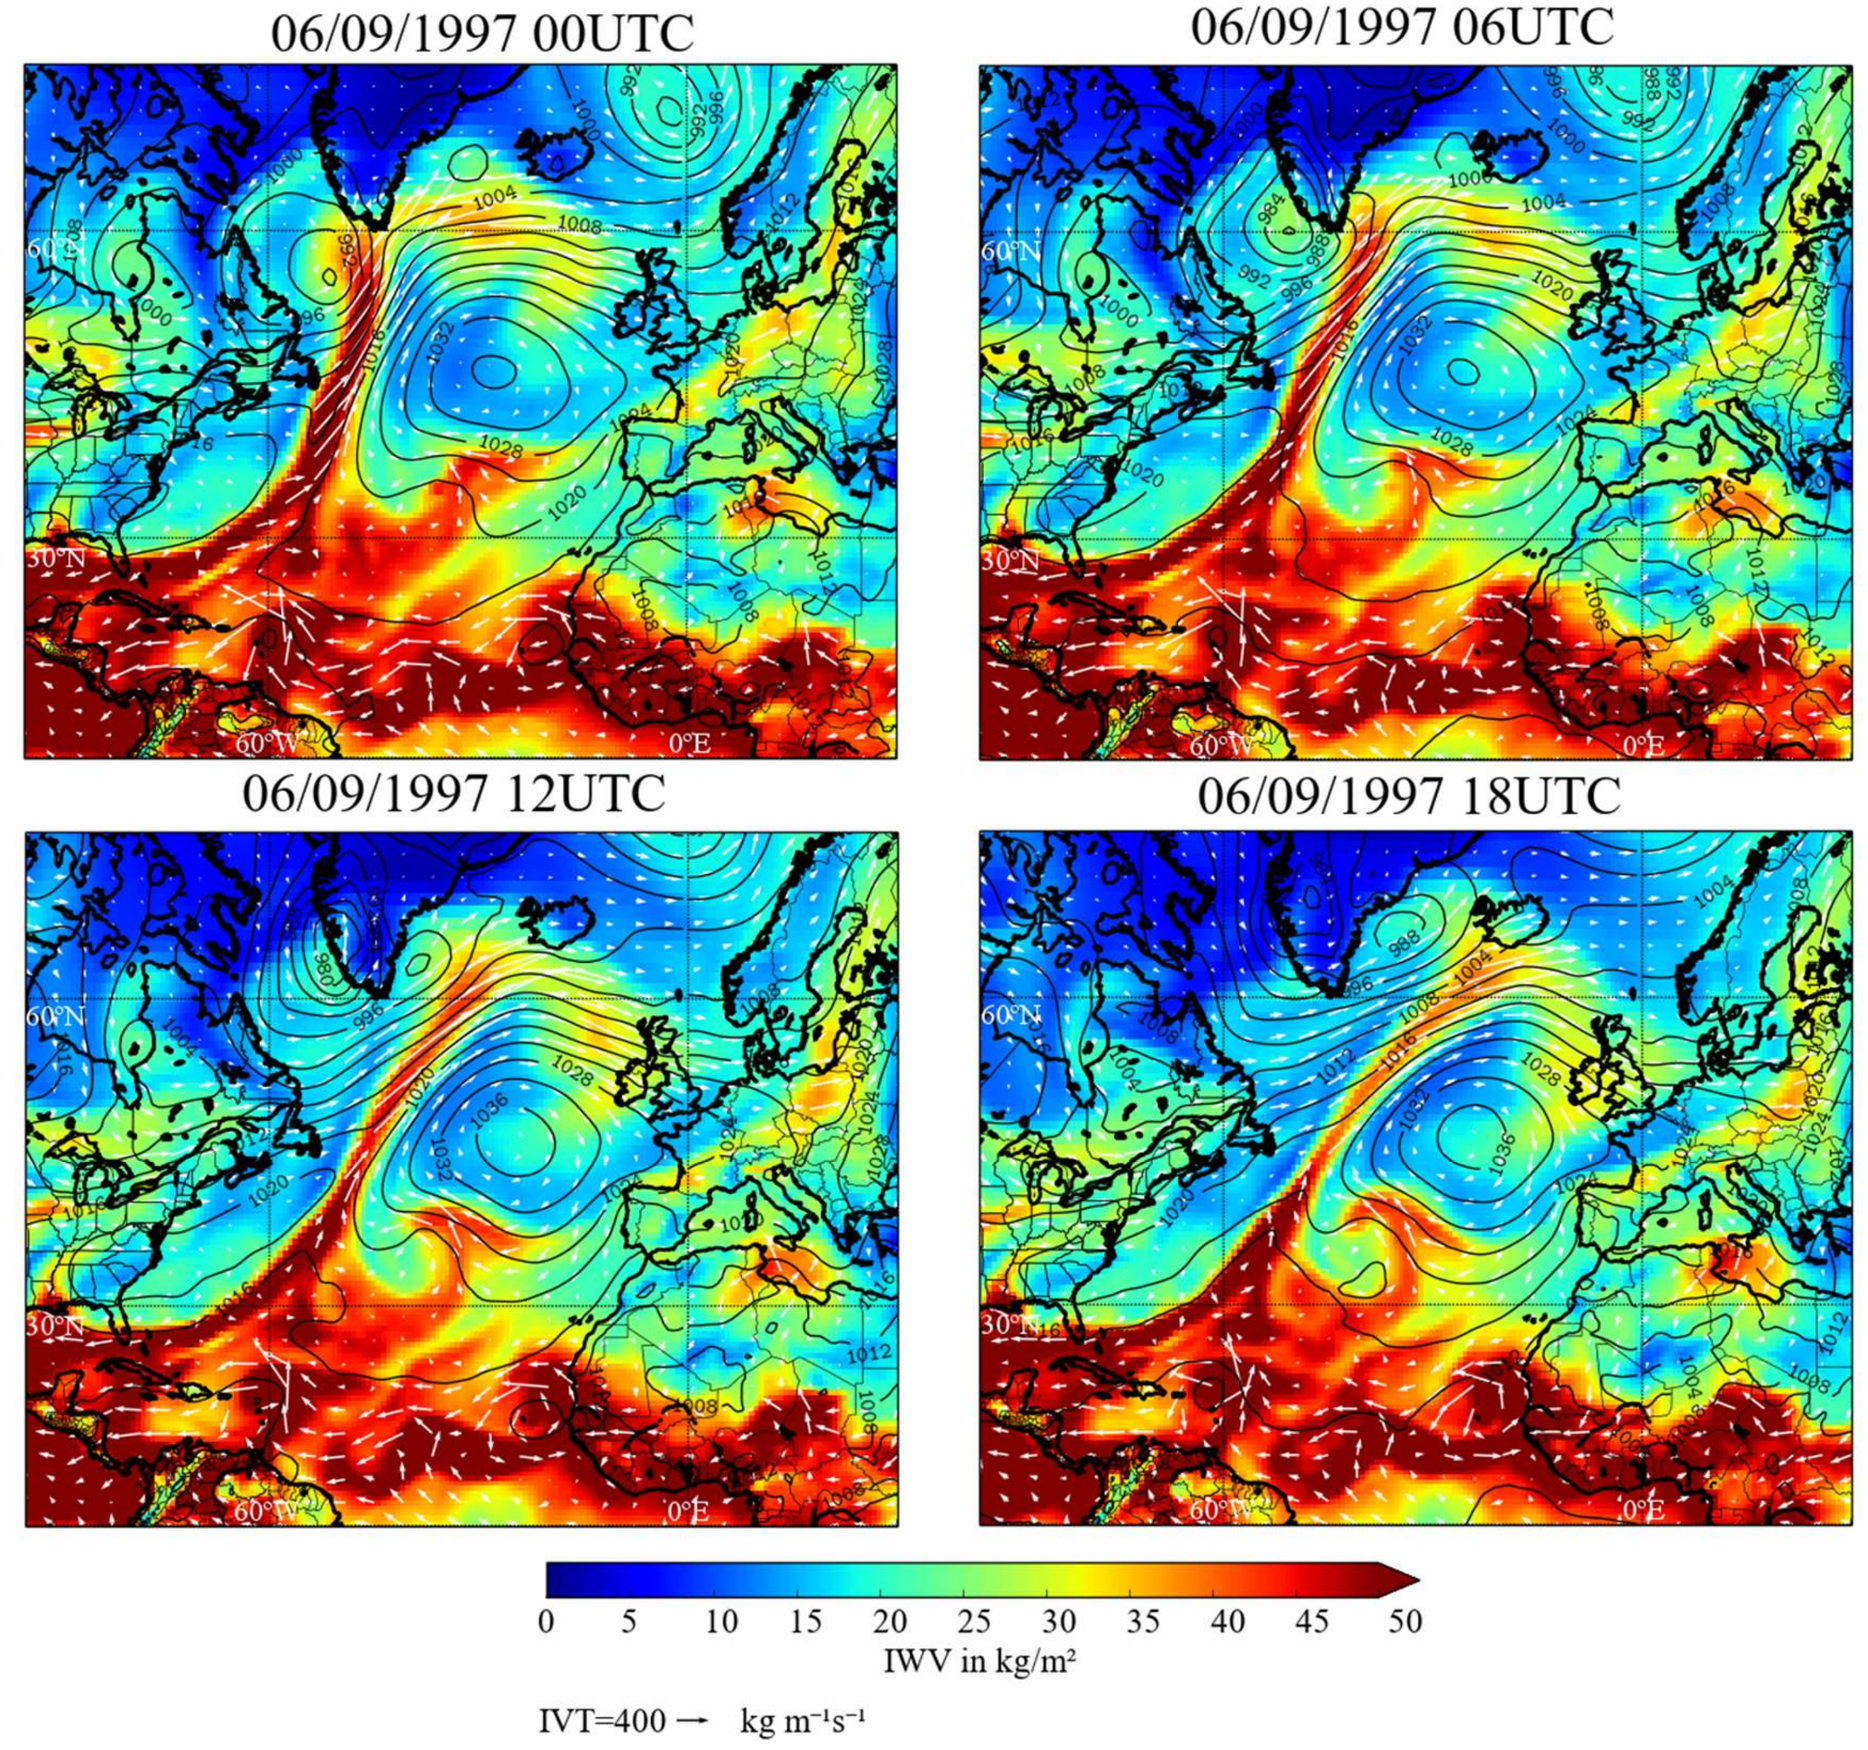
To exemplify the described phenomena, we have analysed a case study of an AR reaching the Arctic during 6 September 1997 within the Atlantic AR pathway box. This AR shows the maximum spatially integrated vapour transport (IVT) activity in fall (when the ARs entrance is maxima over this area) during the completely studied period. Figure 4 shows the integrated column of water vapour (IWV) together with IVT for the case of study. Figure 4a–d show a well-defined AR and the four 6 h time steps highlight its evolution and illustrate the transient process which leads the advective transport from (sub)tropical latitudes to the Arctic. At 00 UTC, the AR reaches the southern coast of Greenland, displacing eastward in the following time steps and reaching the Iceland coast at 18 UTC.
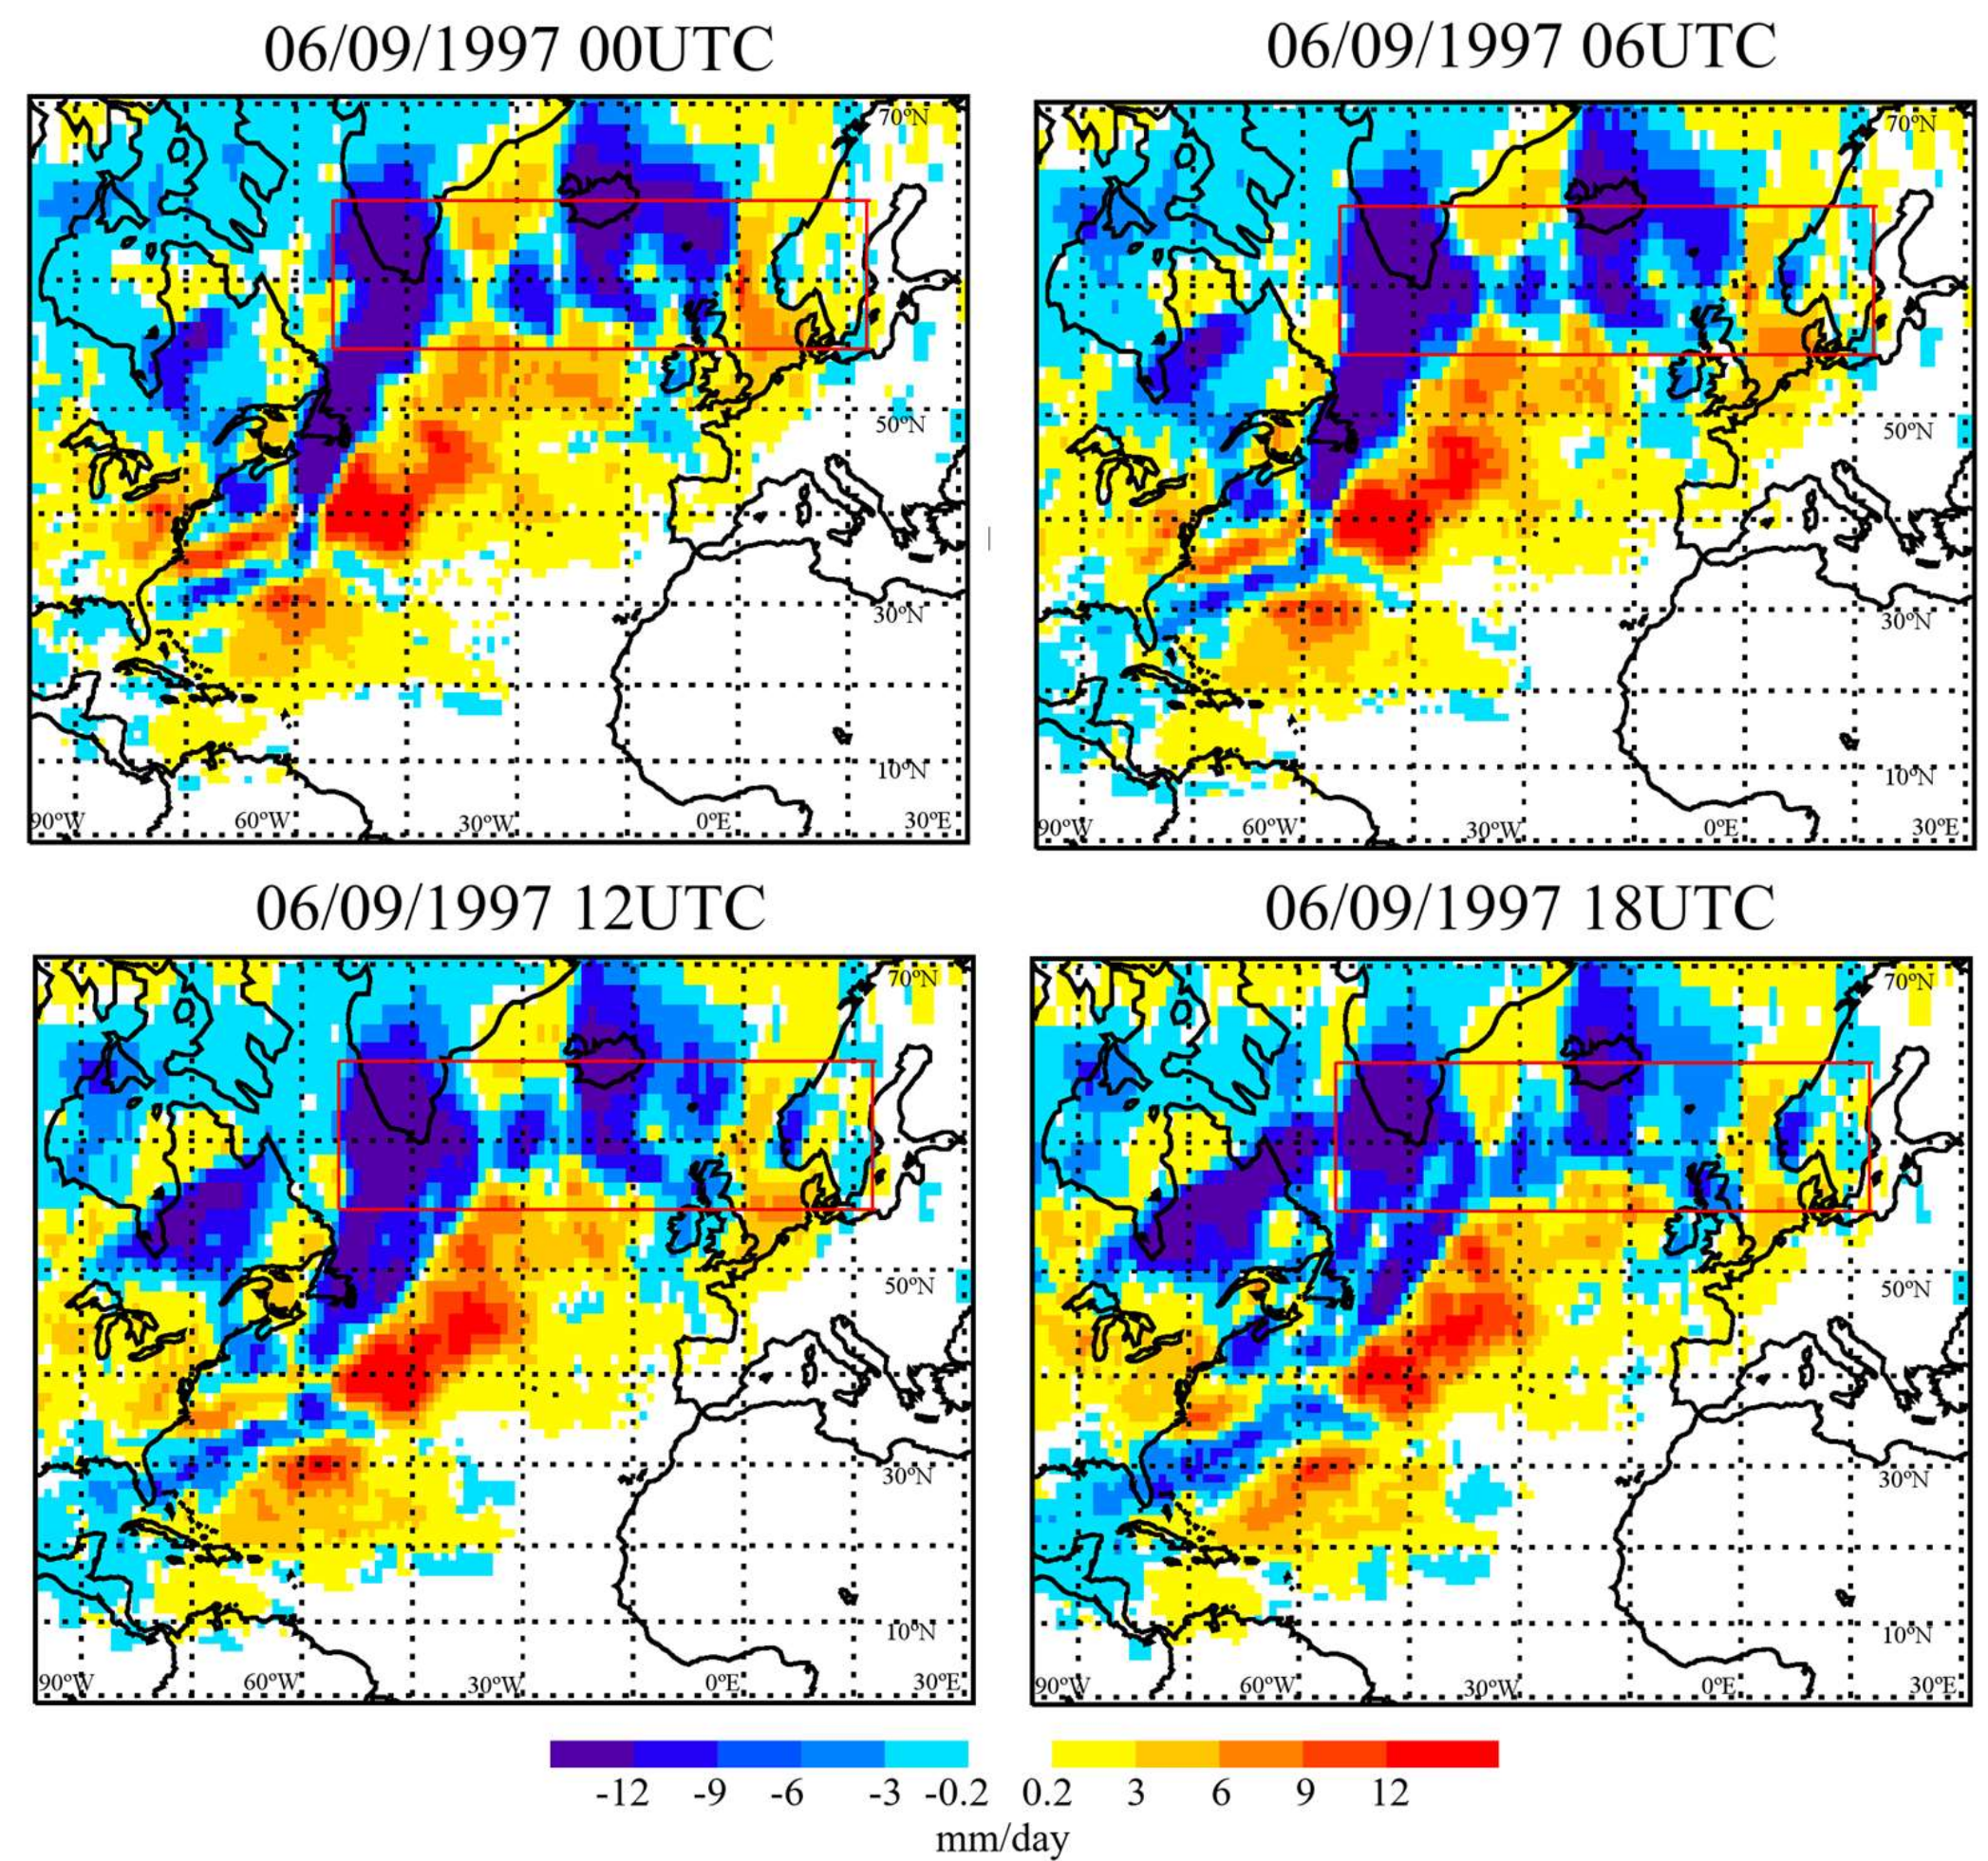
Figure 5 shows the budget E-P for every time-step stated in Figure 4. Negative values of E-P are located in regions of maximum IVT. Referred to moisture uptakes, they occur at both sides of the AR and mostly coincide with high-pressure centres (black isolines on Figure 4). On the right side, important moisture uptakes can be found over the North Atlantic in coincidence with a high-pressure area. The same occurs near to the US West Coast. Despite the maximum moisture uptake can be found at lower latitudes, the AR continues to gain moisture as it moves towards the Arctic, with moisture uptakes over the pathway box.
4. Discussion
In the present work, the area of maximum occurrence of the ARs reaching the Arctic (crossing the latitudinal band of 60° N) was located for every season. From the results, two different sectors of AR occurrence were defined: the Atlantic and the Pacific. In general terms, these areas are coincident with regions of extreme moisture intrusion over the Arctic found in previous studies [15,17]. Referring to the Atlantic sector, most of the ARs reach the Arctic region by crossing the Norwegian Sea. This is the most common way in the storm tracks into the Arctic [25] and their occurrence has been suggested to influence the Arctic Sea ice lost north of Eurasia [11,47,48]. Despite the general path followed by ARs, in late spring and summer (Figure 1 and Supplementary Materials, Figure S1), the AR activity moves westward occurring mainly over the Davis Strait. This seasonality in the AR pathway area is consistent with the previous study conducted by Liu and Barnes [16]. In the latter work, the relation between ARs and Rossby Wave Breaking (RWB) was analysed as they appeared in both the Davis Strait and the Norwegian Sea. In these areas, the maximum extreme moisture events were associated with cyclonic (C) and anticyclonic (A), RWB over the Davis Strait and the Norwegian Sea respectively. Despite from our results a relation between the ARs moisture uptake and RWB cannot be addressed, the seasonality of the CRWB and ARWB found previous work is consistent with the seasonality observed in the present work, occurring the highest moisture uptake over the Davis Strait in autumn coinciding with the strongest CRWB related transport. Referring to the Pacific sector, seasonal variability of the AR pathway areas can also be addressed, they are located over the Gulf of Alaska in winter (Figure 1), late summer and early autumn (see Supplementary Materials, Figure S1); and over the Bering Sea in summer in August (see Supplementary Materials, Figure S1). These findings are also consistent with those described by Liu and Barnes [16]. In summer, an important AR entrance into the Arctic is observed to occur over continental areas in North Asia and Komatsu et al. [28] documented the existence of Siberian ARs reaching the Arctic in this season. The highest number of ARs entering the Arctic across the North Pacific region coincides with the previous results of Kamae et al. [49]. This work addressed the northward shift of the North Pacific AR peak occurrence area and found that in summer, ARs are most frequent over far eastern Eurasia.
Having analysed the moisture sources for the maximum AR areas of occurrence identified, it can be asserted that most of the moisture comes from the Pacific and the Atlantic Ocean for the respective sectors. Moreover, in general, important moisture support occurs over the AR pathway area itself, especially for the Atlantic sector. In summer the moisture taken up has mainly continental origins, being especially relevant over eastern Asia for the Pacific sector. This variability in the oceanic and continental origins seems to be related to the general moisture transport into the Arctic previously investigated by Vázquez et al. [50]. In summer, continental areas are more evaporative [51] and supply a greater amount of moisture to the Arctic region in general [50,52]. The main oceanic regions of moisture uptake are located along the paths of the global western boundary currents, where the strongest increase in evaporation was observed in the last decades [53]. These regions have been determined to be the main moisture sources for the Arctic system, especially in winter [50]. This suggests that these climatological moisture sources also have great influence on the transport of moisture by ARs and probably on their development. These oceanic areas were previously proposed as the path of winter ARs [15] and in general, were the most common path for Arctic cyclones [25]. Moreover, they are the most evaporative oceanic areas in the Northern Hemisphere [54] for this season.
Focusing attention on the anomalous moisture sources where the ARs take moisture up, it can be observed that the more important ones occur near the band of 60° N, northward to the climatological sources of moisture. This fact suggests that, despite climatological sources being crucial to the development of the ARs, enhanced continuous moisture uptake along the path of the ARs should exist along the northern transition of ARs into the Arctic. As suggested by previous studies, despite the tropical origin of ARs, most of them also incorporate mid-latitude sources and convergences of local vapour along their paths [55]. Over eastern Eurasia, where higher increases in moisture supply were found in summer, the precipitable water flux is much more intense in this season [52]. Sorteberg and Walsh [25] found a westward shift on the cyclone track that crosses the Bering Strait in this season, crossing the continental areas of far eastern Eurasia. This shift could affect not only the cyclone track but also the AR poleward path and increased moisture uptake over these continental areas. Moreover, Dufour et al. [56] associated most of the meridional moisture transport across 70° N to transient eddies, especially in winter. However, from the analysis of the case of study it can be addressed that the anomalous moisture uptake is not coincident with the maximum IVT value of the AR and it occurs on the edges of the AR pathway, being also important the increase of moisture uptake at the end of the path (over the AR pathway box). This result agreed with the finding of Ramos et al. [33].
5. Conclusions
To conclude, we investigated the main entrance paths for the ARs reaching the Arctic region using a systematic methodology. Moreover, the Lagrangian model FLEXPART was used to analyse the areas of maximum moisture uptake associated with the occurrence of Arctic ARs. From the results, two main sectors can be defined as AR entrance paths, the Atlantic sector and the Pacific sector. Most of the moisture taken up on the ARs trajectories comes from the Atlantic Ocean and the Pacific Ocean respectively; however, important continental moisture sources appear over North America and Eurasia, especially in the summer months. Southern moisture sources coincide in general terms with climatological evaporative areas proven to have an influence on poleward moisture transport toward the Arctic. However, an increase on northern moisture uptake specifically associated with the occurrence of Arctic ARs was observed. This increase is especially relevant over the main pathway area along 60° N.
This work has taken the initial step toward analysis of the origin of moisture transported by Arctic ARs. Further analysis should be performed in order to characterise the influence of ARs on Arctic moisture transport and to understand the evolution of ARs toward the Arctic. The forward Lagrangian analysis from AR sources could be carried out to investigate the effectiveness of the poleward moisture transport from these meteorological structures. If positive trends are found in evaporation over the oceanic sources that influence major occurrences of ARs or in major transport of moisture that precipitates over the Arctic, these results could eventually lead to reasons for the further loss of sea ice extent during the last decades. These analyses would be the subject of future work.
Supplementary Materials
The following are available online at https://www.mdpi.com/2073-4441/11/1/41/s1, Figure S1. AR frequency over the area between 55° and 65° N over the period 1997–2014: The blue line represents the number of ARs for every longitude and the box embedded in the plot shows the spatial distribution of the ARs. Reddish colors represent areas with higher AR frequency and bluish colors those with lower. The red lines depict the 75th percentile of the distribution.
Author Contributions
Conceptualisation, R.N. and L.G.; Methodology, R.N. and A.M.R.; Software, M.V., I.A. and R.N.; Formal Analysis, M.V., I.A. and R.N.; Writing-Original Draft Preparation, M.V. and J.E.B.; Writing-Review & Editing, I.A., A.M.R., R.N and L.G.; Visualisation, M.V., I.A.; Supervision, R.N. and L.G.; Project Administration, L.G. and R.N.; Funding Acquisition, L.G. and R.N.
Funding
This research was funded by the Spanish Government within the EVOCAR (CGL2015-65141-R) project, which is also funded by FEDER. Alexandre M. Ramos was also supported by a FCT postdoctoral grant (FCT/DFRH/SFRH/BPD/84328/2012). This work was partially supported by Xunta de Galicia under Project ED431C 2017/64-GRC ‘Programa de Consolidación e Estruturación de Unidades de Investigación Competitivas (Grupos de Referencia Competitiva).’ Marta Vázquez and Jorge Eiras-Barca were also supported by Xunta de Galicia under grant ED481B 2018.
Acknowledgments
We acknowledge Bin Guan for providing the AR data.
Conflicts of Interest
The authors declare no conflict of interest. The funders had no role in the design of the study; in the collection, analyses or interpretation of data; in the writing of the manuscript or in the decision to publish the results.
References
- Pithan, F.; Mauritsen, T. Arctic amplification dominated by temperature feedbacks in contemporary climate models. Nat. Geosci. 2014, 7, 181–184. [Google Scholar] [CrossRef]
- Stroeve, J.; Holland, M.M.; Meier, W.; Scambos, T.; Serreze, M. Arctic sea ice decline: Faster than forecast. Geophys. Res. Lett. 2007, 34. [Google Scholar] [CrossRef] [Green Version]
- Cavalieri, D.J.; Parkinson, C.L. Arctic sea ice variability and trends, 1979–2010. Cryosphere 2012, 6, 881–889. [Google Scholar] [CrossRef] [Green Version]
- Comiso, J.C.; Hall, D.K. Climate trends in the Arctic as observed from space. WIREs Clim. Chang. 2014, 5, 389–409. [Google Scholar] [CrossRef] [PubMed] [Green Version]
- Comiso, J.C.; Parkinson, C.L.; Gersten, R.; Stock, L. Accelerated decline in the Arctic sea ice cover. Geophys. Res. Lett. 2008, 35, L01703. [Google Scholar] [CrossRef]
- Parkinson, C.L.; DiGirolamo, N.E. New visualizations highlight new information on the contrasting Arctic and Antarctic sea-ice trends since the late 1970s. Remote Sens. Environ. 2016, 183, 198–204. [Google Scholar] [CrossRef]
- Stroeve, J.C.; Kattsov, V.; Barrett, A.; Serreze, M.; Pavlova, T.; Holland, M.; Meier, W.N. Trends in Arctic sea ice extent from CMIP5, CMIP3, and observations. Geophys. Res. Lett. 2012, 39, L16502. [Google Scholar] [CrossRef]
- Serreze, M.C.; Holland, M.M.; Stroeve, J. Perspectives on the Arctic’s Shrinking Sea-Ice Cover. Science 2007, 315, 1533–1536. [Google Scholar] [CrossRef]
- Comiso, J.C. A rapidly declining perennial sea ice cover in the Arctic. Geophys. Res. Lett. 2002, 29, 17. [Google Scholar] [CrossRef]
- Proshutinsky, A.Y.; Johnson, M.A. Two circulation regimes of the wind-driven Arctic Ocean. J. Geophys. Res. Oceans 1997, 102, 12493–12514. [Google Scholar] [CrossRef] [Green Version]
- Parkinson, C.L.; Comiso, J.C. On the 2012 record low Arctic sea ice cover: Combined impact of preconditioning and an August storm. Geophys. Res. Lett. 2013, 40, 1356–1361. [Google Scholar] [CrossRef] [Green Version]
- Mortin, J.; Svensson, G.; Graversen, R.G.; Kapsch, M.L.; Stroeve, J.C.; Boisvert, L.N. Melt onset over Arctic sea ice controlled by atmospheric moisture transport. Geophys. Res. Lett. 2016, 43, 6636–6642. [Google Scholar] [CrossRef] [Green Version]
- Zhang, X.; He, J.; Zhang, J.; Polyakov, I.; Gerdes, R.; Inoue, J.; Wu, P. Enhanced poleward moisture transport and amplified northern high-latitude wetting trend. Nat. Clim. Chang. 2012, 3, 47–51. [Google Scholar] [CrossRef]
- Simmond, I.; Keay, K. Extraordinay September Arctic sea ice reductions and their relationship with storm behavior over 1979–2008. Geophys. Res. Lett. 2009, 36, L19715. [Google Scholar] [CrossRef]
- Newman, M.; Kiladis, G.N.; Weickmann, K.M.; Ralph, F.M.; Sardeshmukh, P.D. Relative Contributions of Synoptic and Low-Frequency Eddies to Time-Mean Atmospheric Moisture Transport, Including the Role of Atmospheric Rivers. J. Clim. 2012, 25, 7341–7361. [Google Scholar] [CrossRef]
- Liu, C.; Barnes, E.A. Extreme moisture transport into the Arctic linked to Rossby wave breaking. J. Geophys. Res. Atmos. 2015, 120, 3774–3788. [Google Scholar] [CrossRef] [Green Version]
- Woods, C.; Caballero, R.; Svensson, G. Large-scale circulation associated with moisture intrusions into the Arctic during winter. Geophys. Res. Lett. 2013, 40, 4717–4721. [Google Scholar] [CrossRef] [Green Version]
- Zhu, Y.; Newell, R.E. A proposed algorithm for moisture fluxes from atmospheric rivers. Mon. Weather Rev. 1998, 126, 725–735. [Google Scholar] [CrossRef]
- Guan, B.; Waliser, D.E. Detection of atmospheric rivers: Evaluation and application of an algorithm for global studies. J. Geophys. Res. Atmos. 2015, 120, 12514–12535. [Google Scholar] [CrossRef]
- Gimeno, L.; Dominguez, F.; Nieto, R.; Trigo, R.; Drumond, A.; Reason, C.J.C.; Taschetto, A.S.; Ramos, A.M.; Kumar, R.; Marengo, J. Major mechanisms of atmospheric moisture transport and their role in extreme precipitation events. Annu. Rev. Environ. Resour. 2016, 41, 117–141. [Google Scholar] [CrossRef]
- Ralph, F.M.; Neiman, P.J.; Wick, G.A.; Gutman, S.I.; Dettinger, M.D.; Cayan, D.R.; White, A.B. Flooding in California’s Russian River: Role of atmospheric river. Geophys. Res. Lett. 2006, 33, L13801. [Google Scholar] [CrossRef]
- Lavers, D.A.; Villarini, G. The nexus between atmospheric rivers and extreme precipitation across Europe. Geophys. Res. Lett. 2013, 40, 3259–3264. [Google Scholar] [CrossRef] [Green Version]
- Leung, L.R.; Qian, Y. Atmospheric rivers induced heavy precipitation and flooding in the western U.S. simulated by the WRF regional climate model. Geophys. Res. Lett. 2009, 36, L03820. [Google Scholar] [CrossRef]
- Gimeno, L.; Nieto, R.; Vázquez, M.; Laver, D.A. Atmospheir river: A mini-review. Front. Earth Sci. 2014, 2, 2.1–2.6. [Google Scholar] [CrossRef]
- Sorteberg, A.; Walsh, J.E. Seasonal cyclone variability at 70°N and its impact on moisture transport into the Arctic. Tellus A 2008, 60, 570–586. [Google Scholar] [CrossRef]
- Eiras-Barca, J.; Ramos, A.M.; Pinto, J.G.; Trigo, R.M.; Liberato, M.L.R.; Miguez-Macho, G. The concurrence of atmospheric rivers and explosive cyclogenesis in the North Atlantic and North Pacific basins. Earth Syst. Dyn. 2018, 9, 91–102. [Google Scholar] [CrossRef]
- Hegyi, B.M.; Taylor, P.C. The Unprecedented 2016–2017 Arctic Sea Ice Growth Season: The Crucial Role of Atmospheric Rivers and Longwave Fluxes. Geophys. Res. Lett. 2018, 45, 5204–5212. [Google Scholar] [CrossRef]
- Komatsu, K.K.; Alexeev, V.A.; Repina, I.A.; Tachibana, Y. Poleward upgliding Siberian atmospheric rivers over sea ice heat up Arctic upper air. Sci. Rep. 2018, 8, 2872. [Google Scholar] [CrossRef]
- Woods, C.; Caballero, R. The role of moist intrusions in winter Arctic warming and sea ice decline. J. Clim. 2016, 29, 4473–4485. [Google Scholar] [CrossRef]
- Vihma, T.; Screen, J.; Tjernström, M.; Newton, B.; Zhang, X.; Popova, V.; Deser, C.; Holland, M.; Prowse, T. The atmospheric role in the Arctic water cycle: A review on processes, past and future changes, and their impacts. J. Geophys. Res. Biogeosci. 2016, 121, 586–620. [Google Scholar] [CrossRef] [Green Version]
- Baggett, C.; Lee, S.; Feldstein, S. An Investigation of the Presence of Atmospheric Rivers over the North Pacific during Planetary-Scale Wave Life Cycles and Their Role in Arctic Warming. J. Atmos. Sci. 2016, 73, 4329–4347. [Google Scholar] [CrossRef]
- Eiras-Barca, J.; Dominguez, F.; Hu, H.; Garaboa-Paz, D.; Miguez-Macho, G. Evaluation of the moisture sources in two extreme landfalling atmospheric river events using an Eulerian WRF tracers tool. Earth Syst. Dyn. 2017, 8, 1247–1261. [Google Scholar] [CrossRef] [Green Version]
- Ramos, A.M.; Nieto, R.; Tomé, R.; Gimeno, L.; Trigo, R.M.; Liberato, M.L.R.; Lavers, D.A. Atmospheric rivers moisture sources from a Lagrangian perspective. Earth Syst. Dyn. 2016, 7, 371–384. [Google Scholar] [CrossRef]
- Liberato, M.L.R.; Ramos, A.M.; Trigo, R.M.; Trigo, I.F.; Durán-Quesada, A.M.; Nieto, R.; Gimeno, L. Moisture Sources and Large-Scale Dynamics Associated With a Flash Flood Event. In Lagrangian Modeling of the Atmosphere; Lin, J., Brunner, D., Gerbig, C., Stohl, A., Luhar, A., Webley, P., Eds.; American Geophysical Union: Washington, DC, USA, 2012. [Google Scholar]
- Sodemann, H.; Stohl, A. Moisture Origin and Meridional Transport in Atmospheric Rivers and Their Association with Multiple Cyclones. Mon. Weather Rev. 2013, 141, 2850–2868. [Google Scholar] [CrossRef]
- Moore, B.J.; Neiman, P.J.; Ralph, F.M.; Barthold, F.E. Physical processes associated with heavy flooding rainfall in Nashville, Tennessee, and vicinity during 1–2 May 2010: The role of an atmospheric river and mesoscale convective systems. Mon. Weather Rev. 2012, 140, 358–378. [Google Scholar] [CrossRef]
- Rutz, J.J.; Steenburgh, W.J.; Ralph, F.M. The Inland Penetration of Atmospheric Rivers over Western North America: A Lagrangian Analysis. Mon. Weather Rev. 2015, 143, 1924–1944. [Google Scholar] [CrossRef]
- Ryoo, J.-M.; Waliser, D.E.; Waugh, D.W.; Wong, S.; Fetzer, E.J.; Fung, I. Classification of atmospheric river events on the U. S. West Coast using a trajectory model. J. Geophys. Res. Atmos. 2015, 120, 3007–3028. [Google Scholar] [CrossRef]
- Ramos, A.M.; Blamey, R.C.; Algarra, I.; Nieto, R.; Gimeno, L.; Tomé, R.; Reason, C.J.; Trigo, R.M. From Amazonia to southern Africa: Atmospheric moisture transport through Low Level Jets and Atmospheric Rivers. Ann. N. Y. Acad. Sci. 2018. [Google Scholar] [CrossRef]
- Dee, D.P.; Uppala, S.M.; Simmons, A.J.; Berrisford, P.; Poli, P.; Kobayashi, S.; Andrae, U.; Balmaseda, M.A.; Balsamo, G.; Bauer, P.; et al. The ERA-Interim reanalysis: Configuration and performance of the data assimilation system. Q. J. R. Meteorol. Soc. 2011, 137, 553–597. [Google Scholar] [CrossRef]
- Stohl, A.; Forster, C.; Frank, A.; Seibert, P.; Wotawa, G. Technical note: The Lagrangian particle dispersion model FLEXPART version 6.2. Atmos. Chem. Phys. 2005, 5, 2461–2474. [Google Scholar] [CrossRef]
- Stohl, A.; James, P.A. A Lagrangian Analysis of the Atmospheric Branch of the GlobalWater Cycle. Part I: Method Description, Validation, and Demonstration for the August 2002 Flooding in Central Europe. J. Hydrometeorol. 2004, 5, 656–678. [Google Scholar]
- Stohl, A.; James, P.A. A Lagrangian Analysis of the Atmospheric Branch of the GlobalWater Cycle. Part II: Moisture Transports between Earth’s Ocean Basins and River Catchments. J. Hydrometeorol. 2005, 6, 961–984. [Google Scholar]
- Sorí, R.; Marengo, J.; Nieto, R.; Drumond, A.; Gimeno, L. The Atmospheric Branch of the Hydrological Cycle over the Negro and Madeira River Basins in the Amazon Region. Water 2018, 10, 738. [Google Scholar] [CrossRef]
- Stojanovic, M.; Drumond, A.; Nieto, R.; Gimeno, L. Variations in Moisture Supply from the Mediterranean Sea during Meteorological Drought Episodes over Central Europe. Atmosphere 2018, 9, 278. [Google Scholar] [CrossRef]
- Numagati, A. Origin and recycling processes of precipitation water over the Eurasian continent: Experiments using an atmospheric general circulation model. J. Geophys. Res. 1999, 104, 1957–1972. [Google Scholar] [CrossRef]
- Zhang, J.; Lindsay, R.; Schweiger, A.; Steele, M. The impact of an intense summer cyclone on 2012 Arctic sea ice retreat. Geophys. Res. Lett. 2013, 40, 720–726. [Google Scholar] [CrossRef] [Green Version]
- Simmonds, I.; Rudeva, I. The great Arctic cyclone of August 2012. Geophys. Res. Lett. 2012, 39. [Google Scholar] [CrossRef] [Green Version]
- Kamae, Y.; Mei, W.; Xie, S.P.; Naoi, M.; Ueda, H. Atmospheric rivers over the Northwestern Pacific: Climatology and interannual variability. J. Clim. 2017. [Google Scholar] [CrossRef]
- Vázquez, M.; Nieto, R.; Drumond, A.; Gimeno, L. Moisture transport into the Arctic: Source-receptor relationships and the roles of atmospheric circulation and evaporation. J. Geophys. Res. Atmos. 2016, 121. [Google Scholar] [CrossRef]
- Jakobson, E.; Vihma, T. Atmospheric moisture budget in the Arctic based on the ERA-40 reanalysis. Int. J. Climatol. 2010, 30, 2175–2194. [Google Scholar] [CrossRef]
- Groves, D.; Francis, J. Variability of the Arctic atmospheric moisture budget from TOVS satellite data. J. Geophys. Res. 2002, 107, 4785. [Google Scholar] [CrossRef]
- Yu, L. Global variations in oceanic evaporation (1958–2005): The role of the changing wind speed. J. Clim. 2007, 20, 5376–5390. [Google Scholar] [CrossRef]
- Gimeno, L.; Stohl, A.; Trigo, R.M.; Dominguez, F.; Yoshimura, K.; Yu, L.; Drumond, A.; Durán-Quesada, A.M.; Nieto, R. Oceanic and terrestrial sources of continental precipitation. Rev. Geophys. 2012, 50, RG4003. [Google Scholar] [CrossRef]
- Dettinger, M.; Ralph, F.M.; Lavers, D. Setting the stage for a global science of atmospheric rivers. Eos 2015, 96. [Google Scholar] [CrossRef]
- Dufour, A.; Zolina, O.; Gulev, S.K. Atmospheric Moisture Transport to the Arctic: Assessment of Reanalyses and Analysis of Transport Components. J. Clim. 2016, 29, 5061–5081. [Google Scholar] [CrossRef]
Figure 1.
AR frequency over the area between 55° and 65° N over the period 1997–2014: The blue line represents the number of ARs for every longitude and the box embedded in the plot shows the spatial distribution of the ARs. Reddish colours represent areas with higher AR frequency and bluish colours those with lower. The red lines depict the 75th percentile of the distribution.

Figure 2.
Climatological moisture sources ( regions) throughout the period 1997–2014 for the regions of maximum AR occurrence represented by blue boxes. Scale in mm/day.
Figure 2.
Climatological moisture sources ( regions) throughout the period 1997–2014 for the regions of maximum AR occurrence represented by blue boxes. Scale in mm/day.

Figure 3.
Anomalies for AR moisture uptake () calculated for those days when an AR event was identified over the AR pathway regions (red boxes) and referring to the climatological value over the period 1997–2014. Scale in mm/day.
Figure 3.
Anomalies for AR moisture uptake () calculated for those days when an AR event was identified over the AR pathway regions (red boxes) and referring to the climatological value over the period 1997–2014. Scale in mm/day.

Figure 4.
Integrated Water vapour column (IWV) and IVT for the AR event occurred on 6 September 1997. Black isolines represent the Mean Sea Level Pressure in hPa.
Figure 4.
Integrated Water vapour column (IWV) and IVT for the AR event occurred on 6 September 1997. Black isolines represent the Mean Sea Level Pressure in hPa.

Figure 5.
Total (E-P) values calculated for the 6 September 1997 (at every time step). The red box represents the ARs pathway box for the season. Scale in mm/day.
Figure 5.
Total (E-P) values calculated for the 6 September 1997 (at every time step). The red box represents the ARs pathway box for the season. Scale in mm/day.

© 2018 by the authors. Licensee MDPI, Basel, Switzerland. This article is an open access article distributed under the terms and conditions of the Creative Commons Attribution (CC BY) license (http://creativecommons.org/licenses/by/4.0/).
Share and Cite
MDPI and ACS Style
Vázquez, M.; Algarra, I.; Eiras-Barca, J.; Ramos, A.M.; Nieto, R.; Gimeno, L. Atmospheric Rivers over the Arctic: Lagrangian Characterisation of Their Moisture Sources. Water 2019, 11, 41. https://doi.org/10.3390/w11010041
AMA Style
Vázquez M, Algarra I, Eiras-Barca J, Ramos AM, Nieto R, Gimeno L. Atmospheric Rivers over the Arctic: Lagrangian Characterisation of Their Moisture Sources. Water. 2019; 11(1):41. https://doi.org/10.3390/w11010041
Chicago/Turabian StyleVázquez, Marta, Iago Algarra, Jorge Eiras-Barca, Alexandre M. Ramos, Raquel Nieto, and Luis Gimeno. 2019. "Atmospheric Rivers over the Arctic: Lagrangian Characterisation of Their Moisture Sources" Water 11, no. 1: 41. https://doi.org/10.3390/w11010041
Note that from the first issue of 2016, this journal uses article numbers instead of page numbers. See further details here.