Evaluation of Normalized Difference Water Index as a Tool for Monitoring Pasture Seasonal and Inter-Annual Variability in a Mediterranean Agro-Silvo-Pastoral System


Abstract
:
1. Introduction
2. Materials and Methods
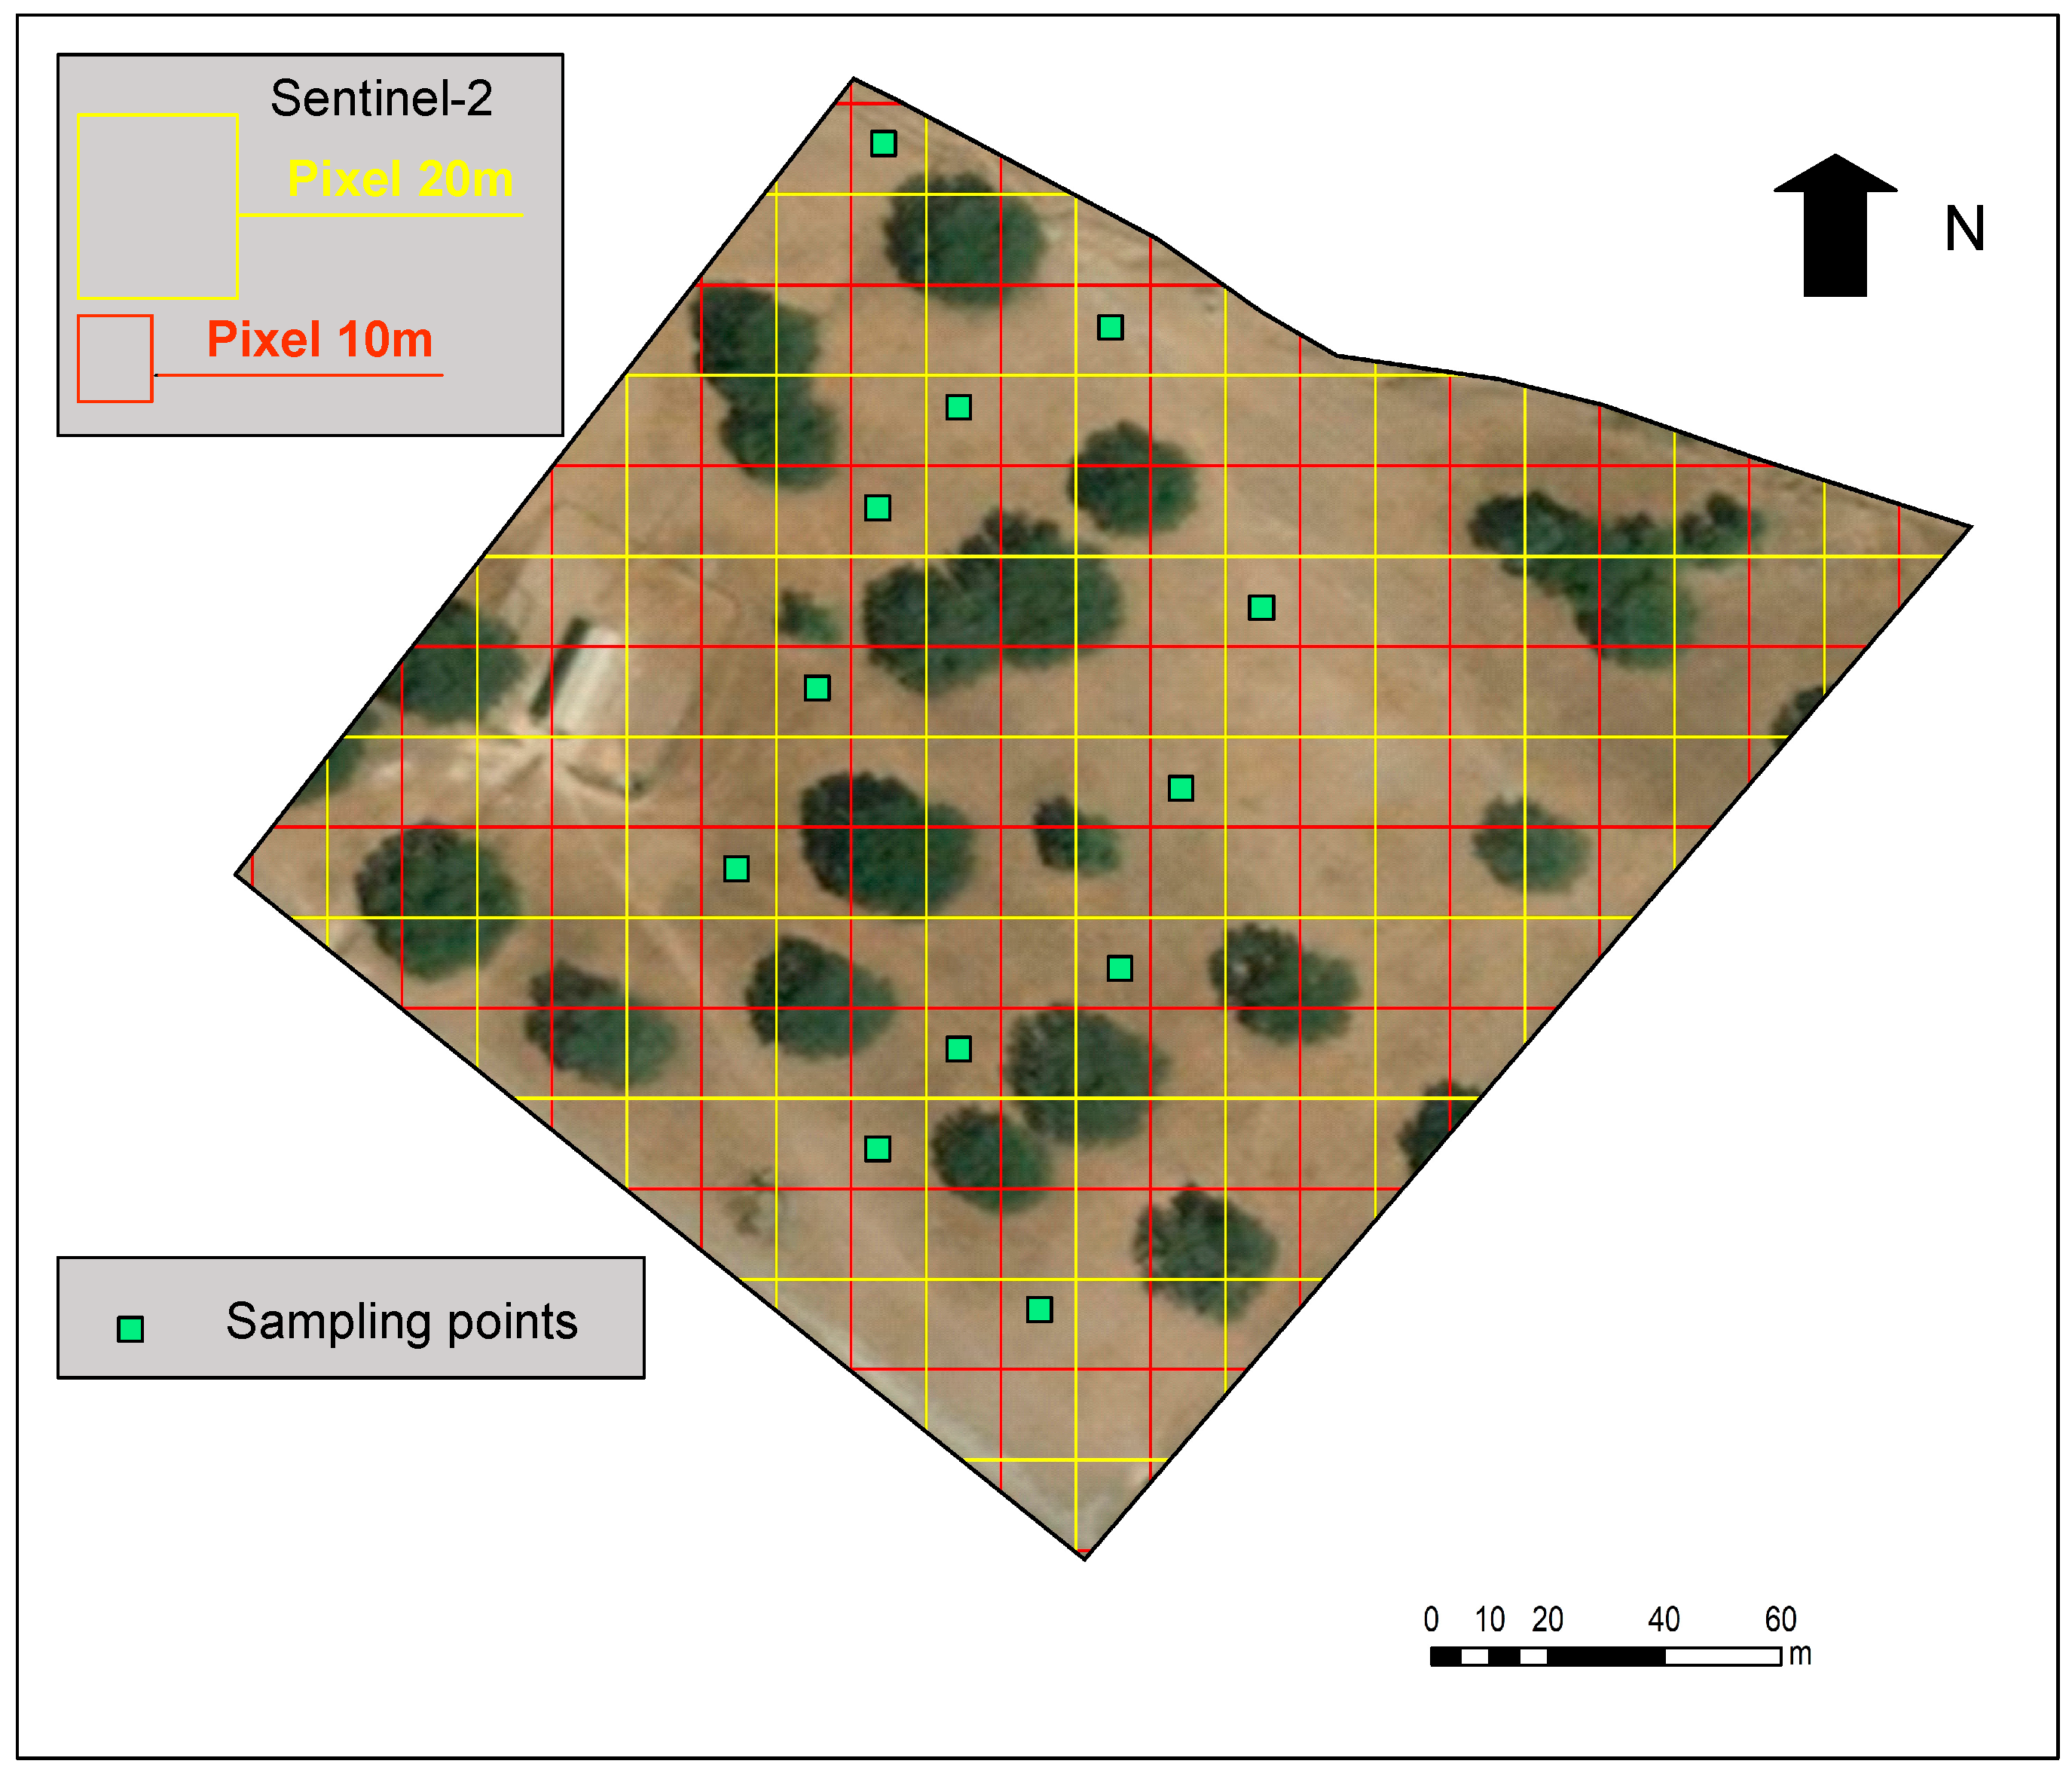
2.1. Study Area
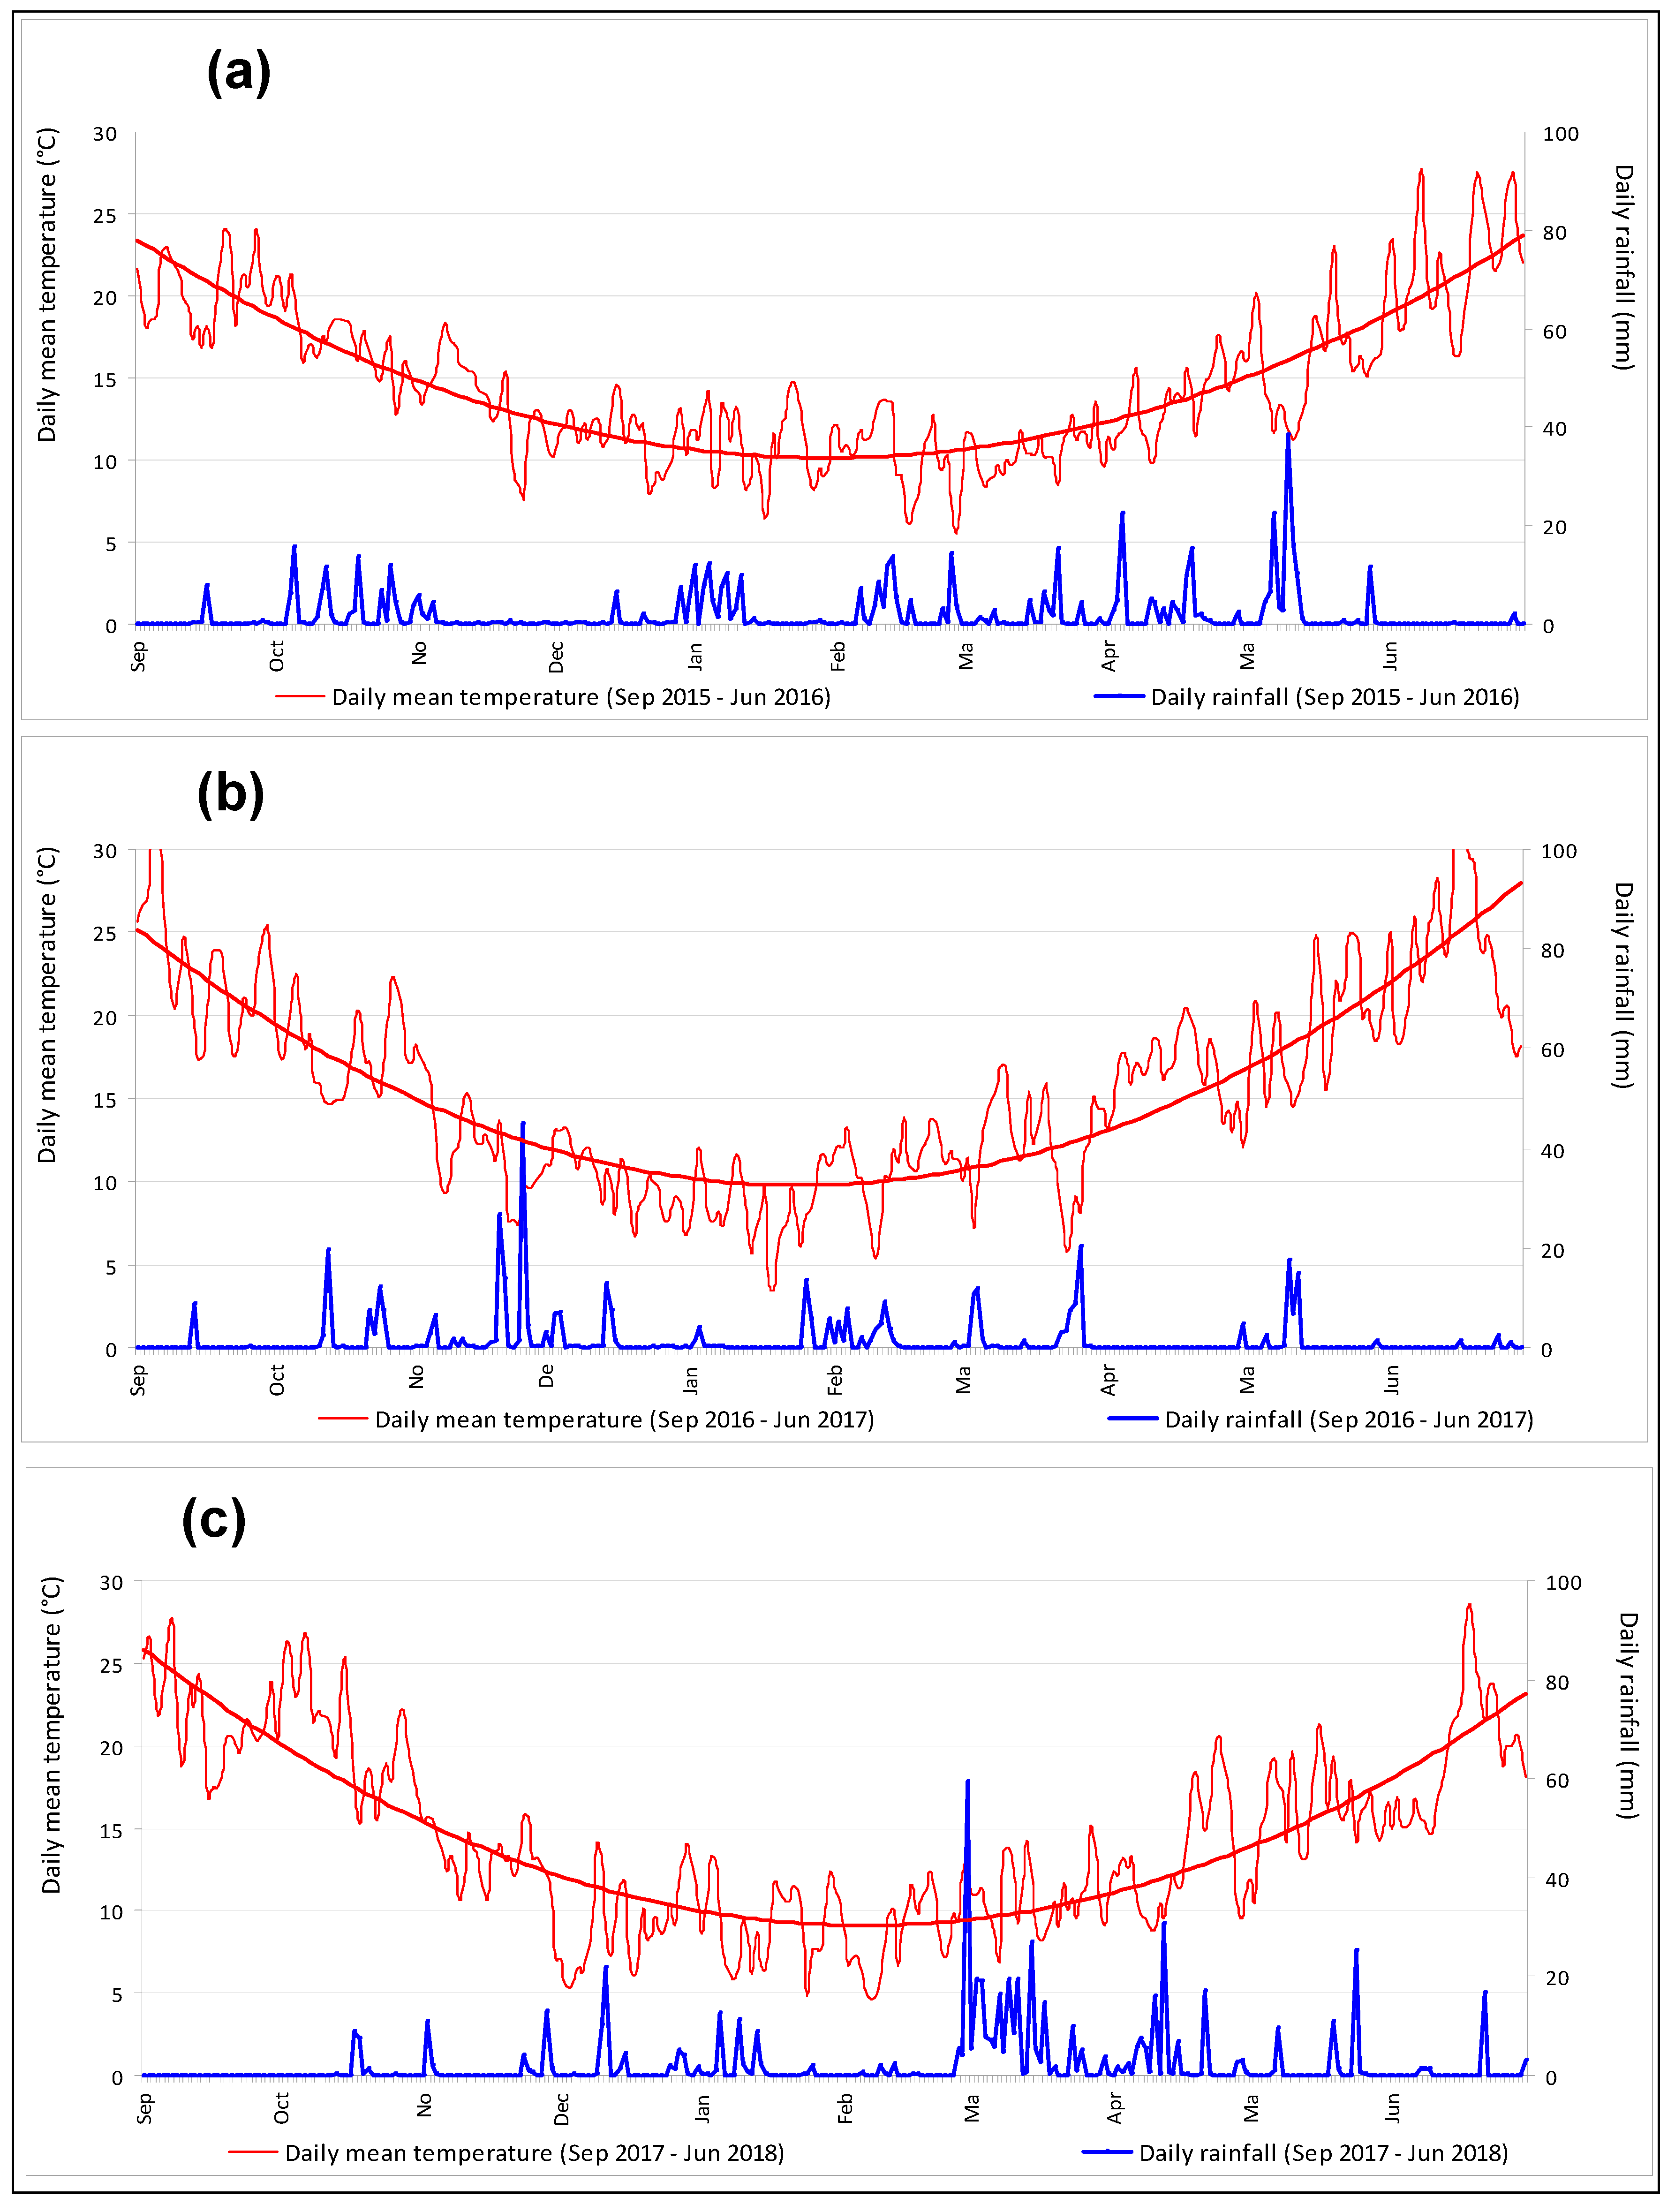
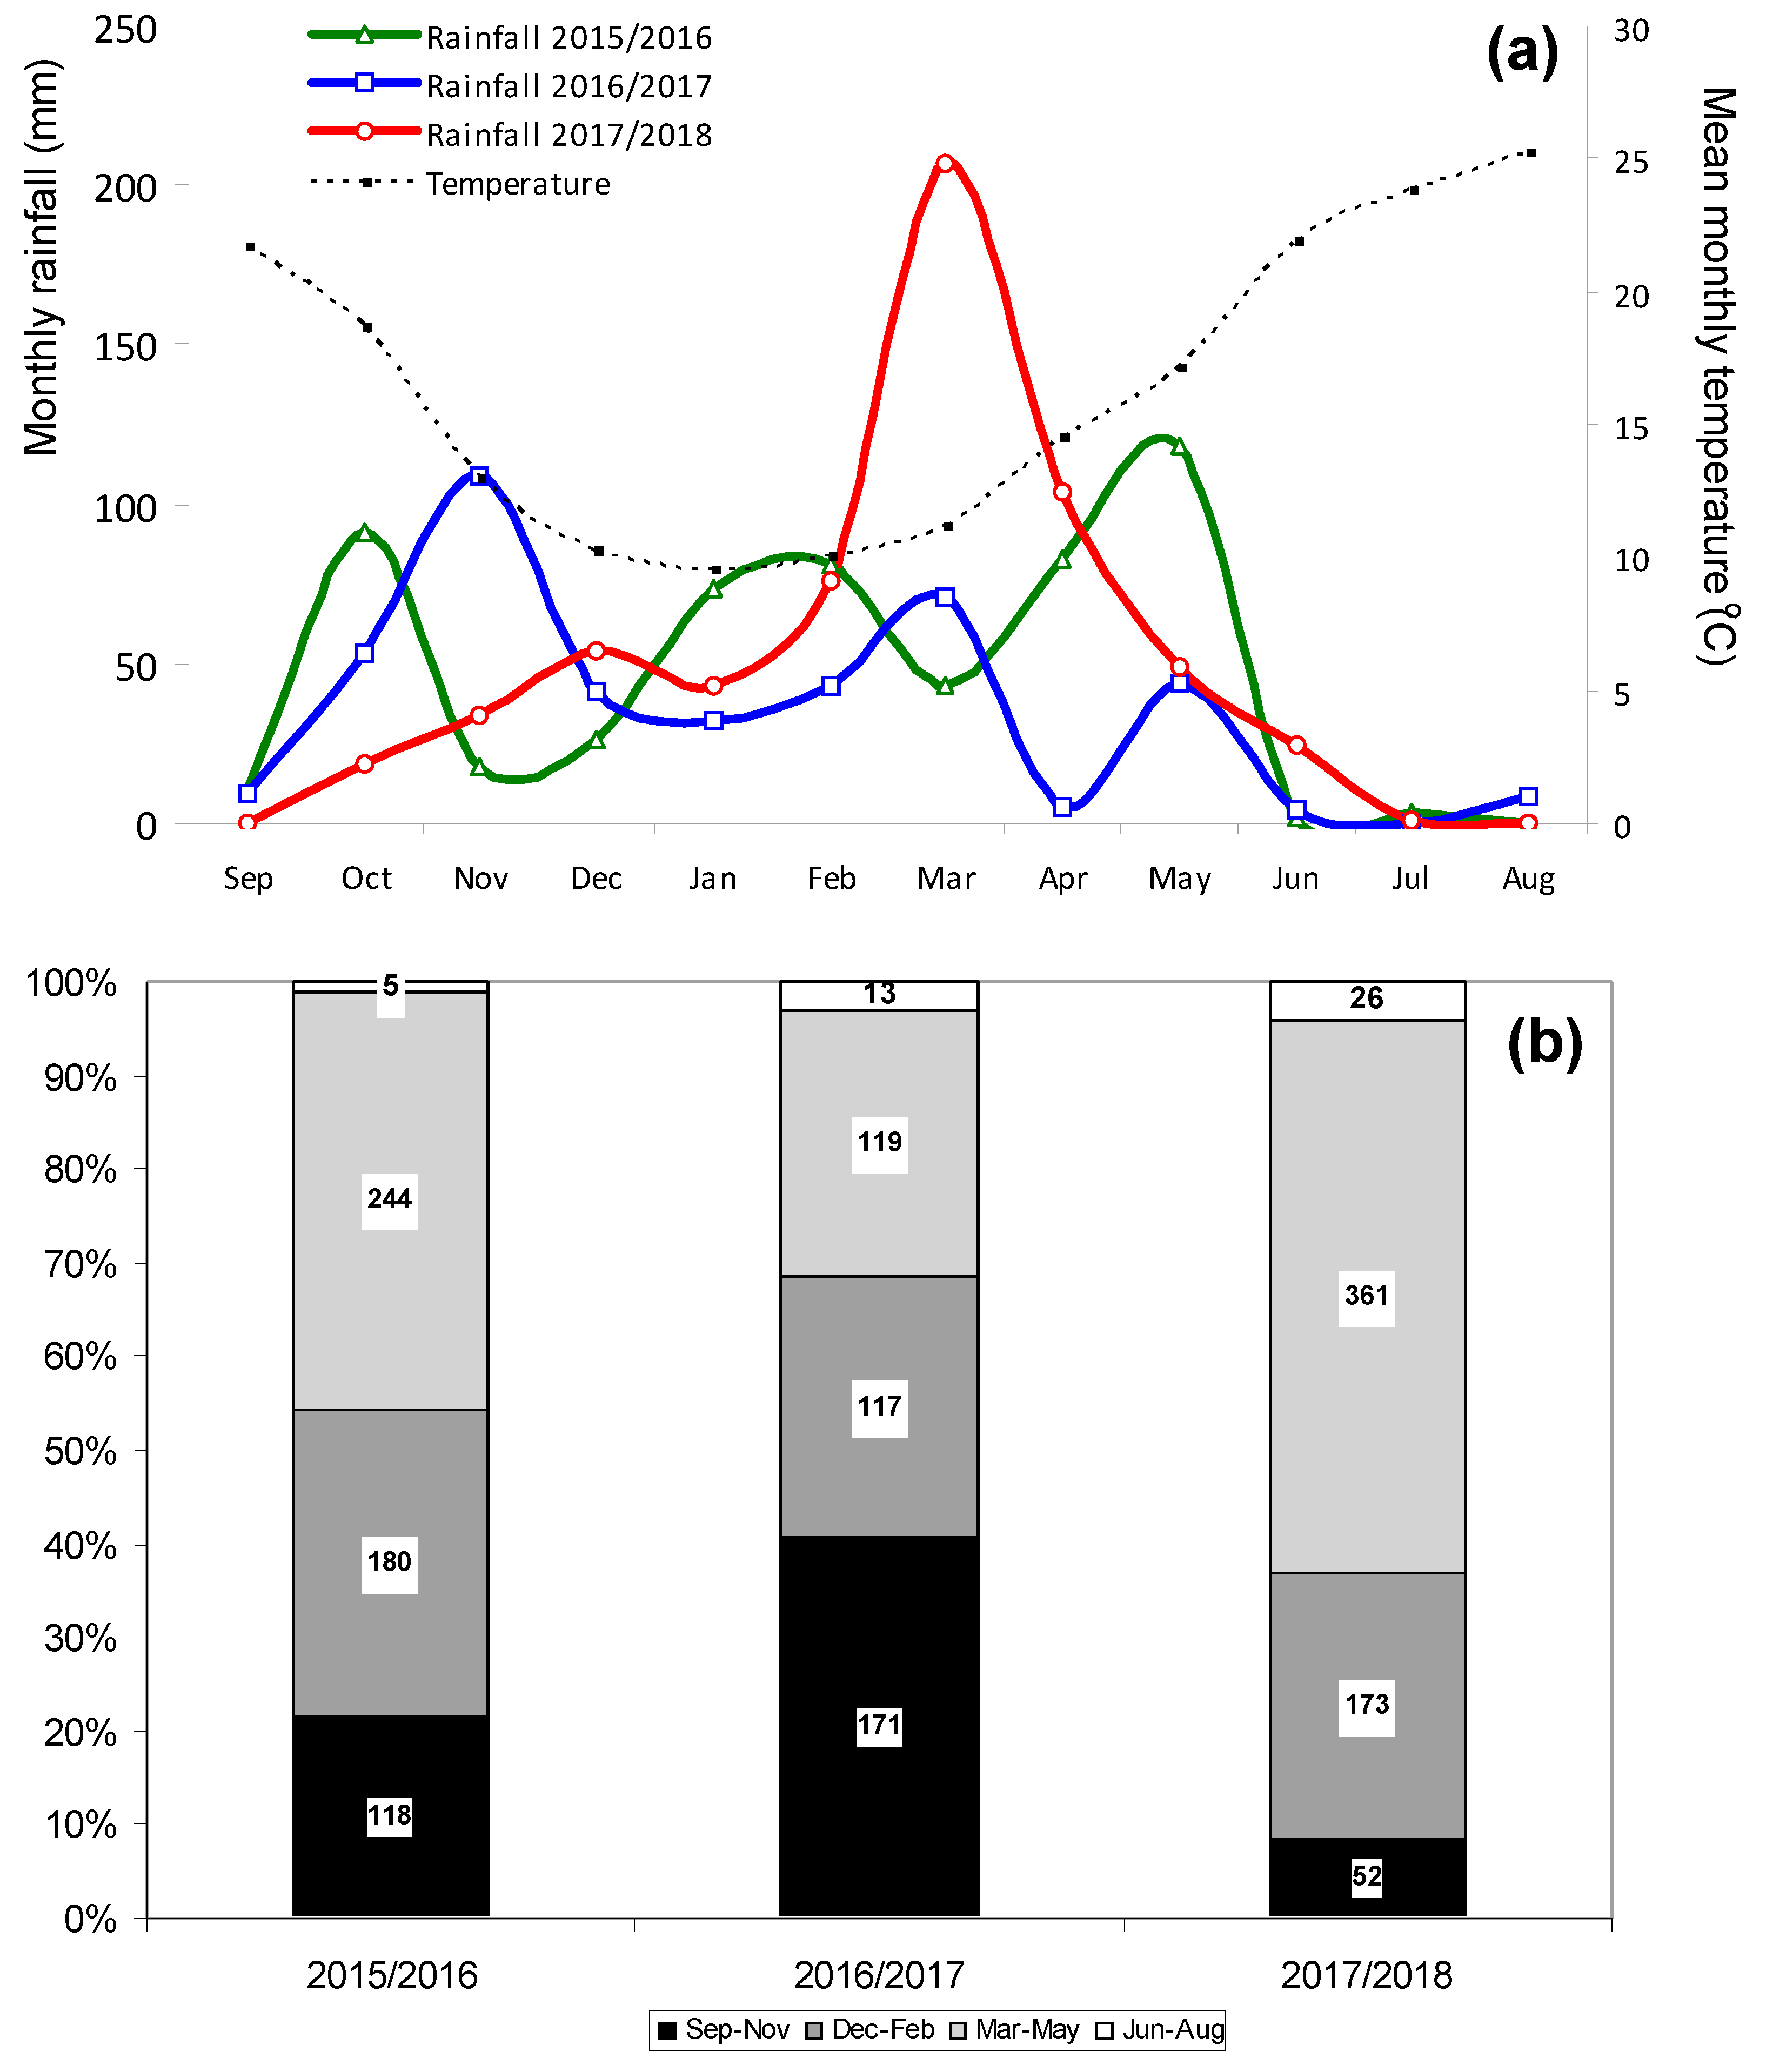
2.2. Climate
2.3. Pasture and Soil Monitoring
2.3.1. Measurements of Soil Moisture Content (SMC) and Pasture Surface Temperature (Tir)
2.3.2. Pasture Sample Collection and Analysis
2.3.3. Vegetation Multispectral Measurements by Remote Sensing
2.4. Statistical Analysis of the Data
3. Results and Discussion
3.1. Evolution of Soil Moisture Content (SMC) and Pasture Surface Temperature (Tir)
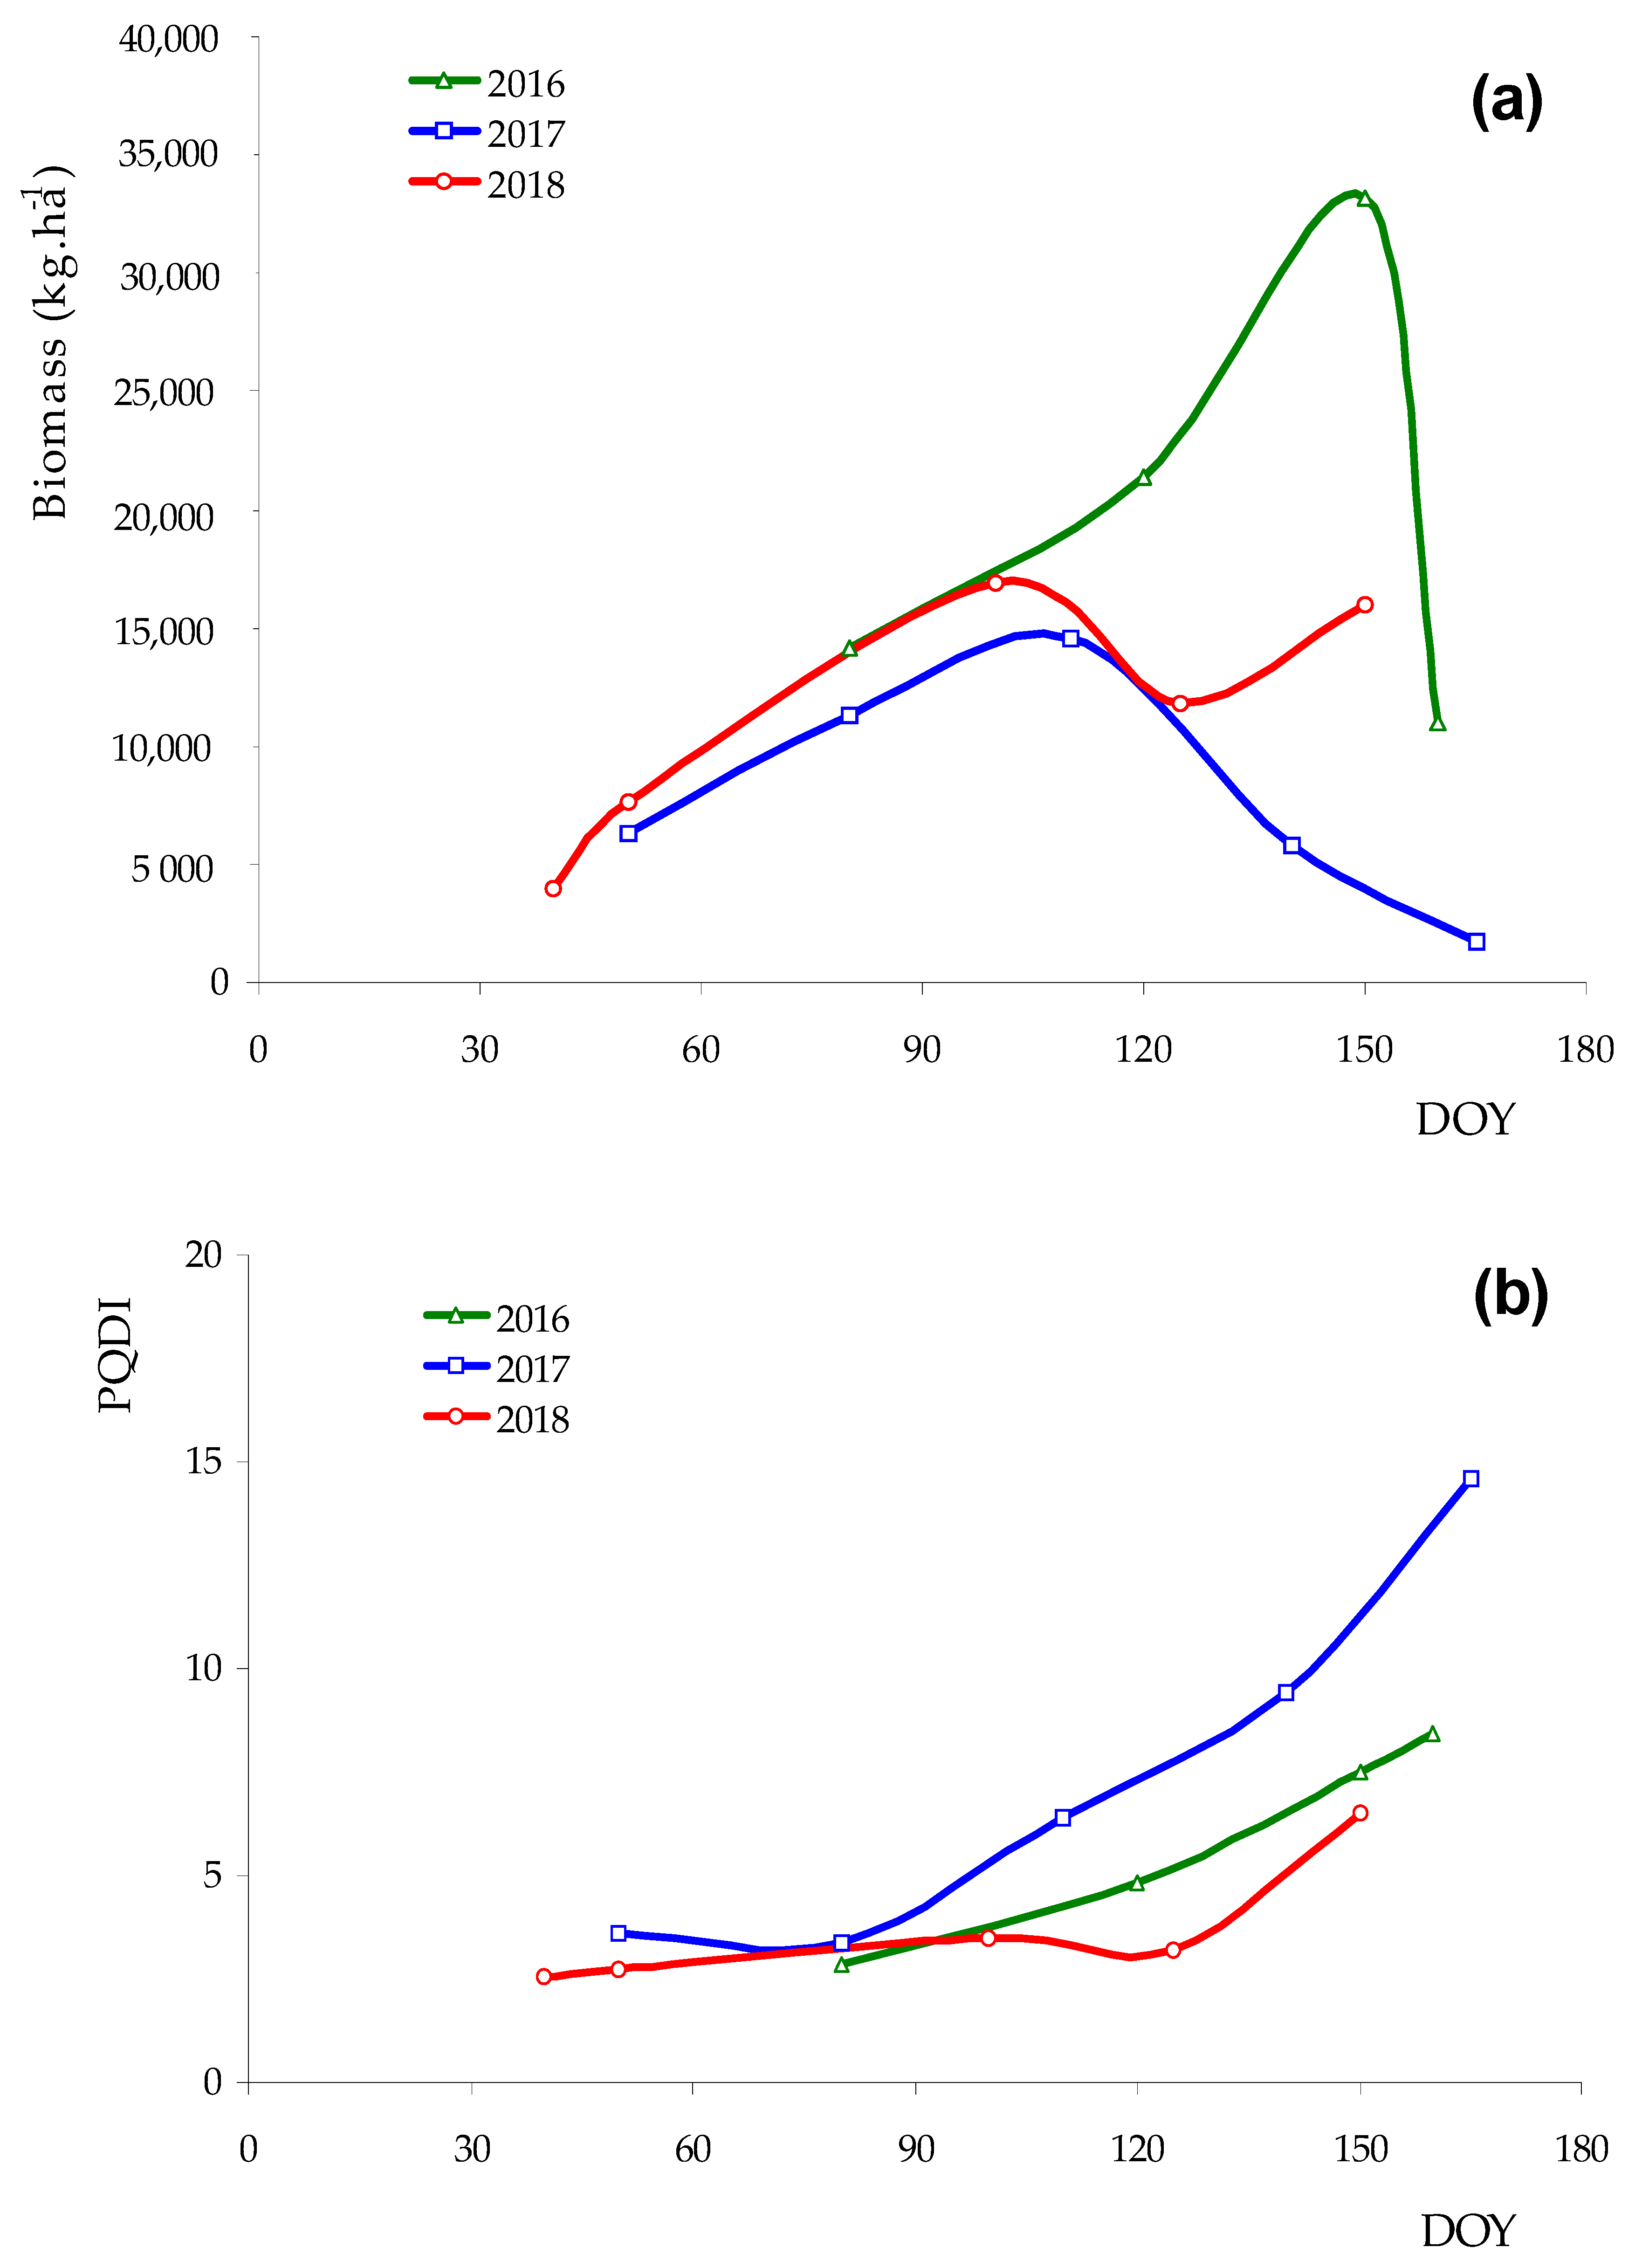
3.2. Evolution of Pasture Parameter Patterns Throughout the Vegetative Cycle
3.3. Satellite-Derived Normalized Difference Water Index (NDWI) and Normalized Difference Vegetation Index (NDVI) Time Series
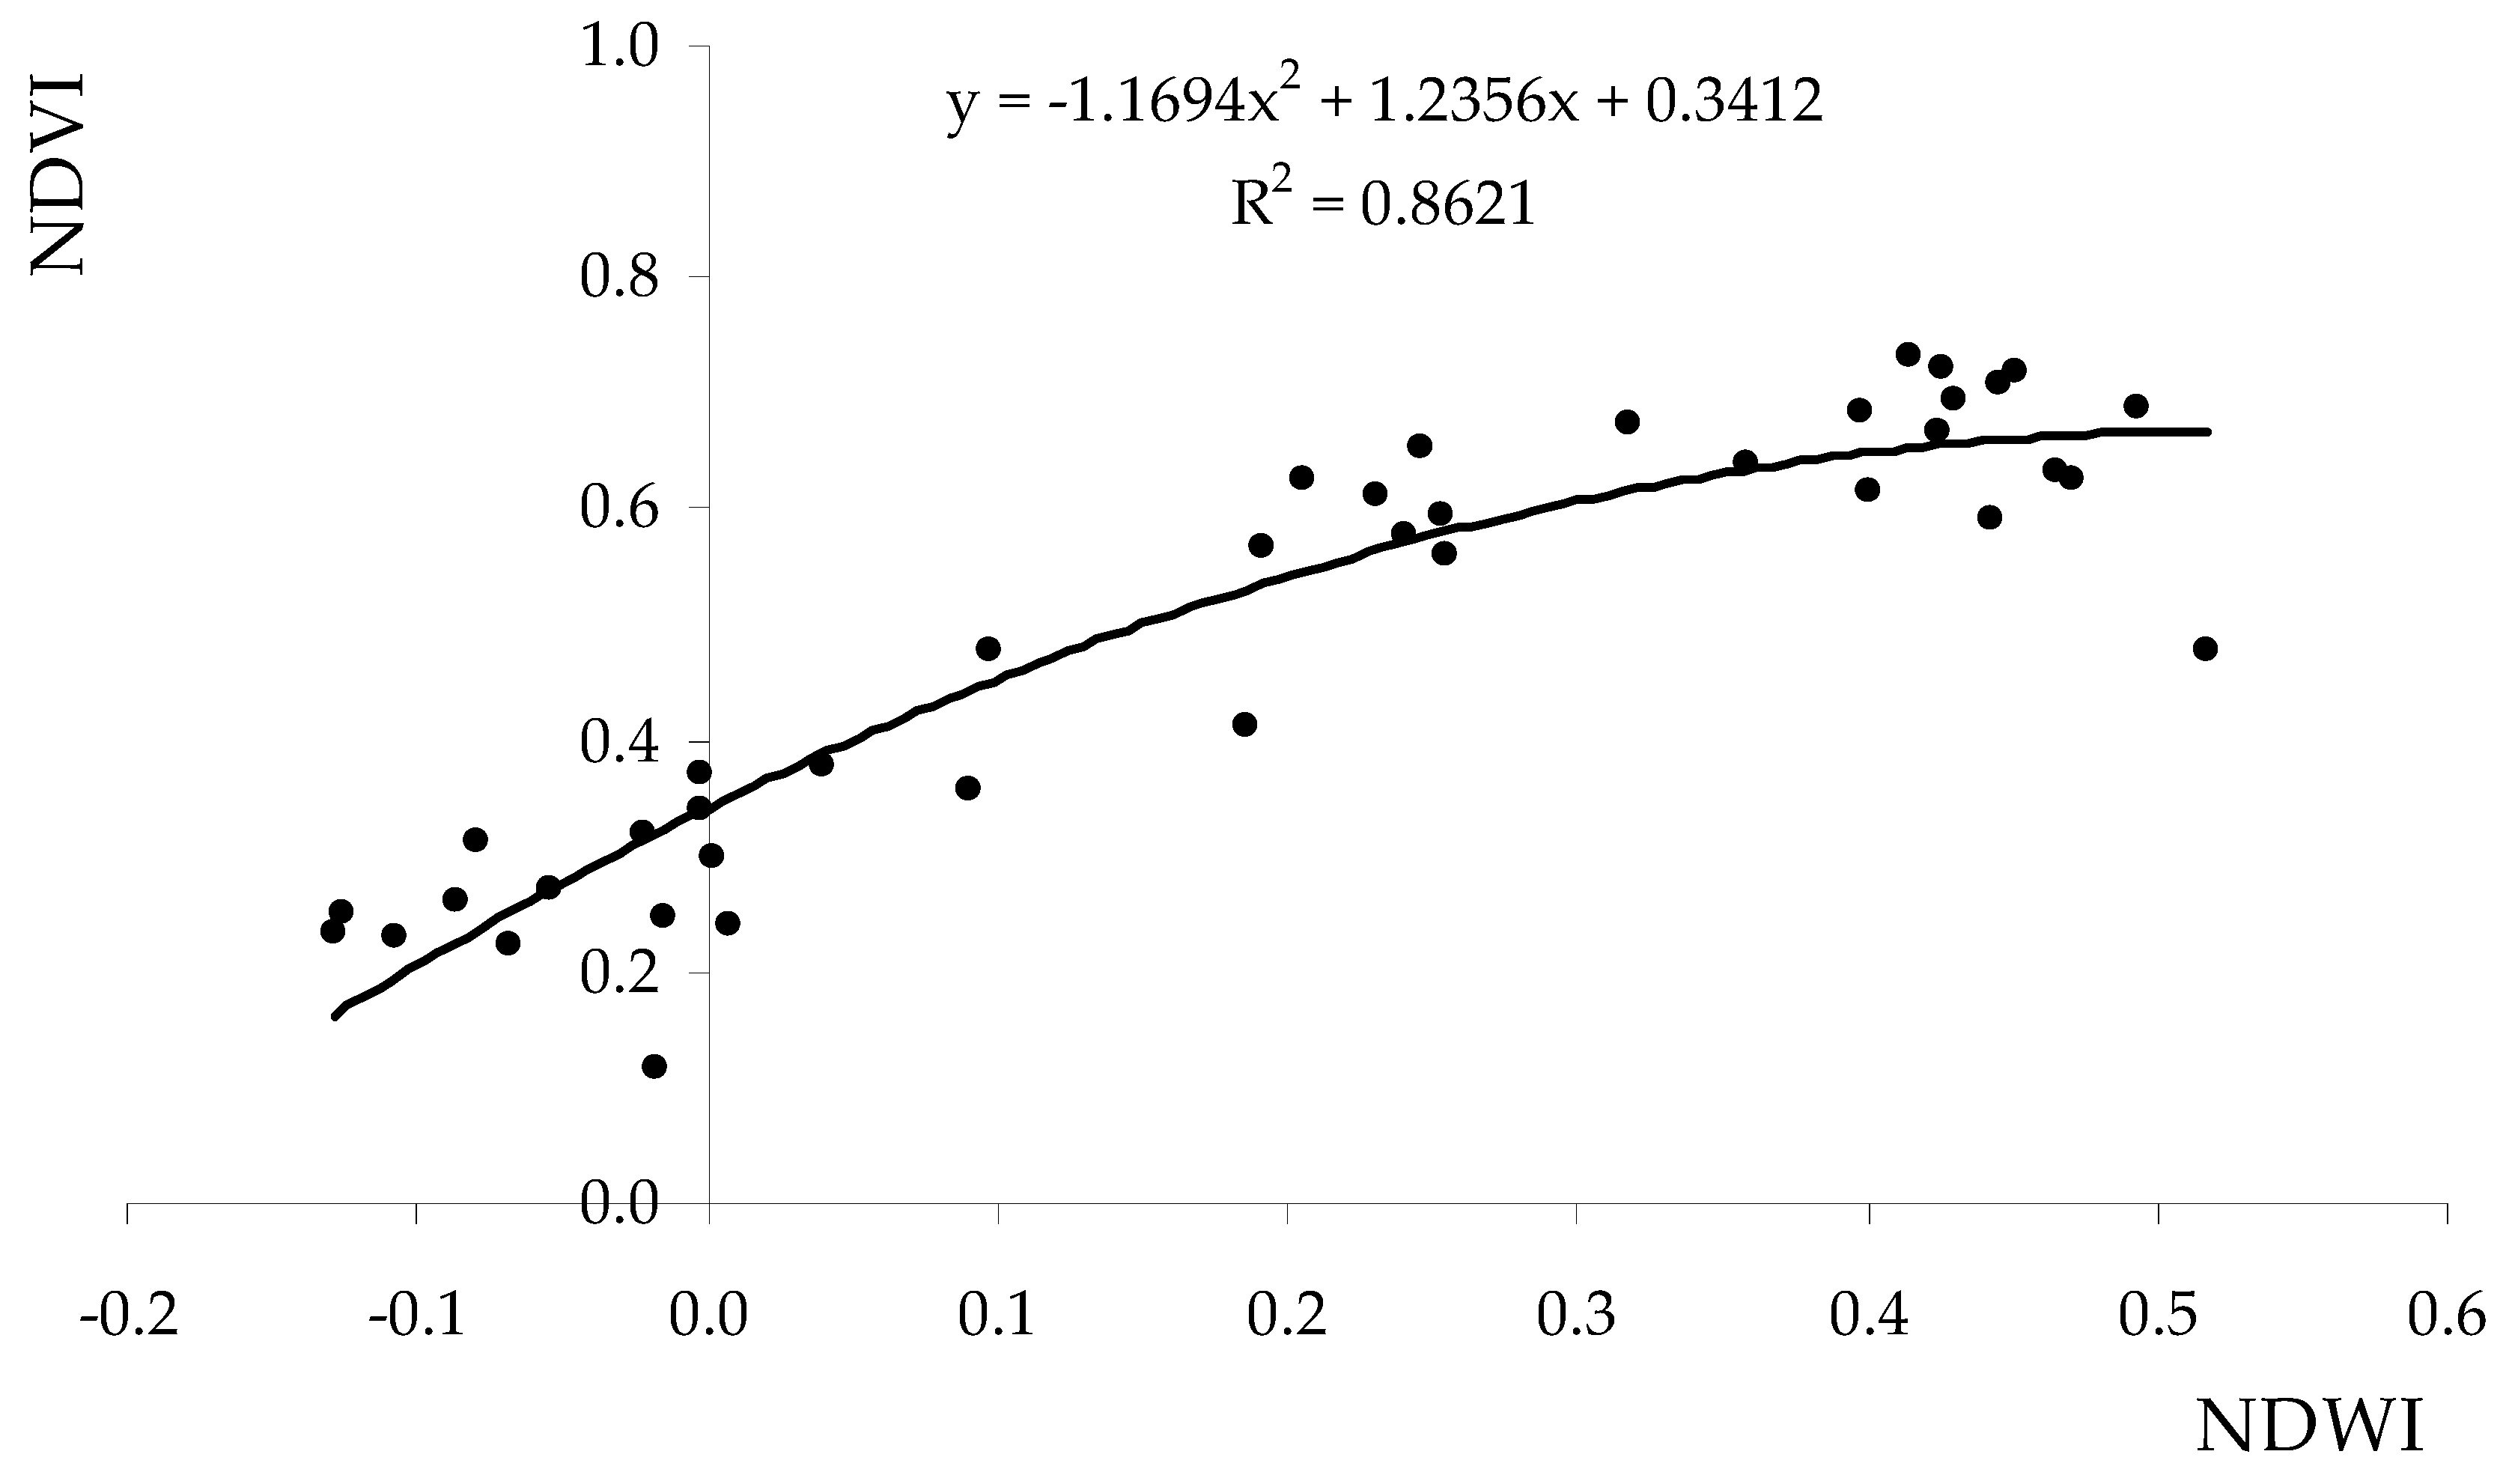
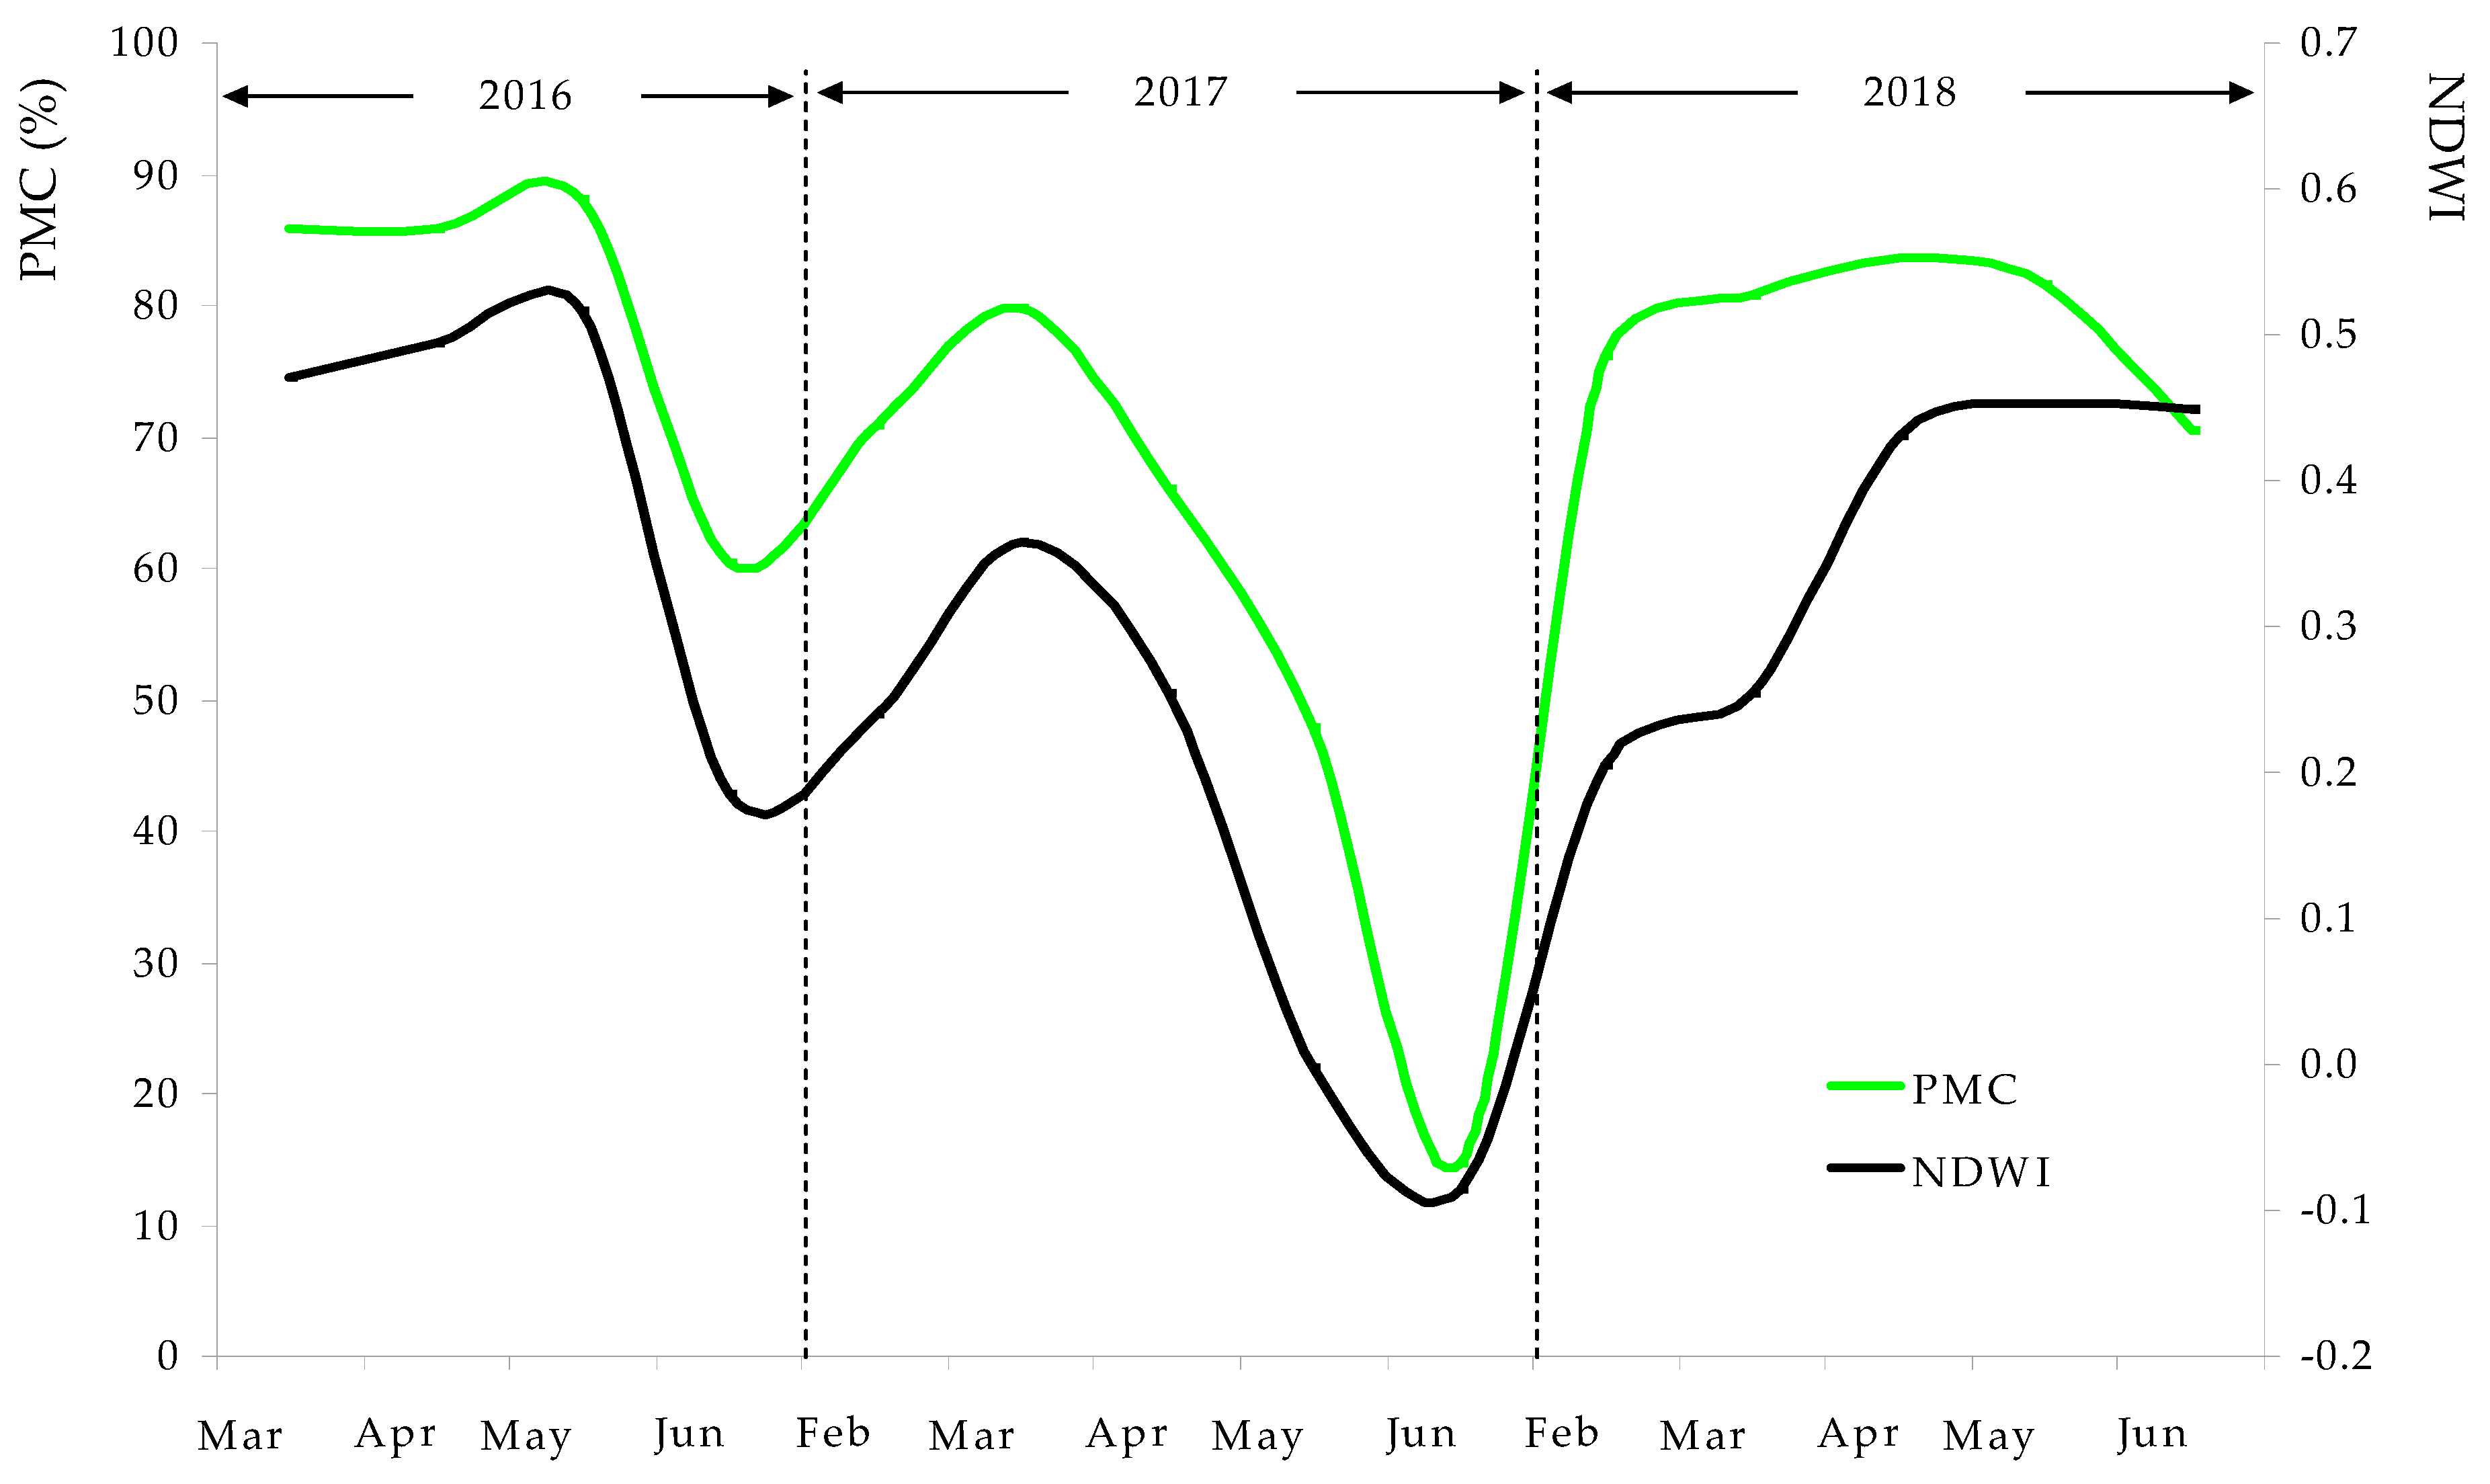
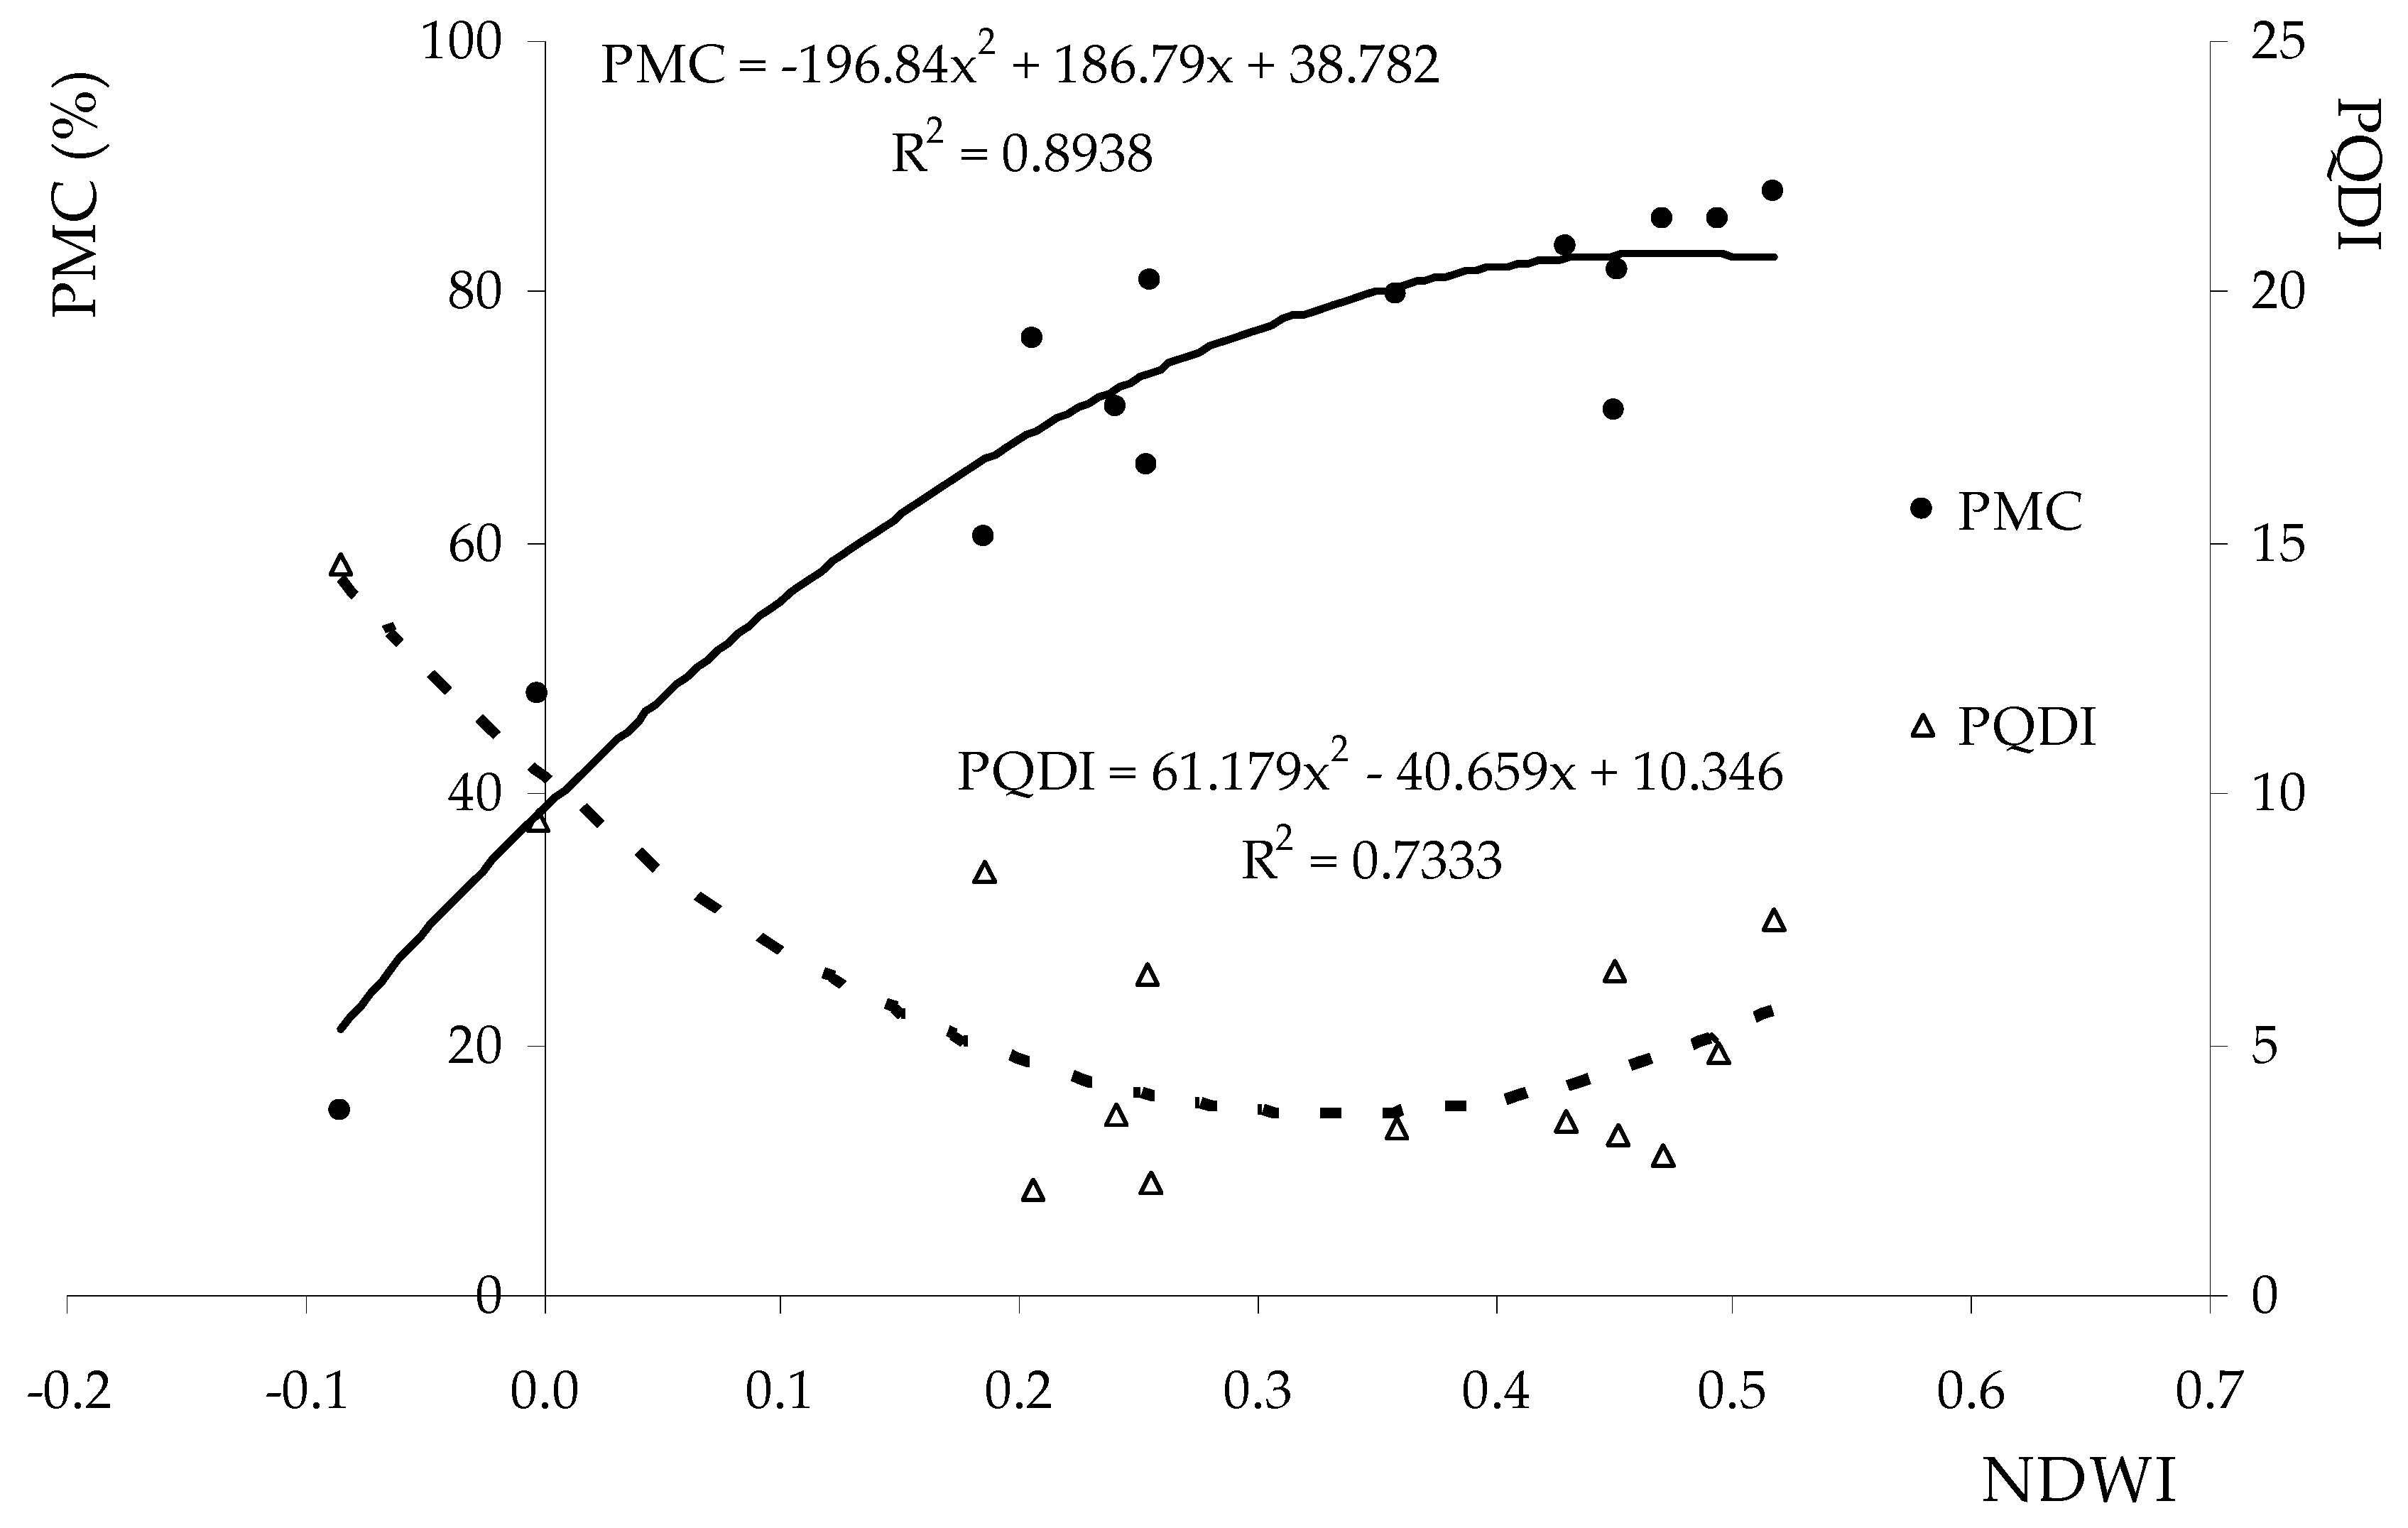
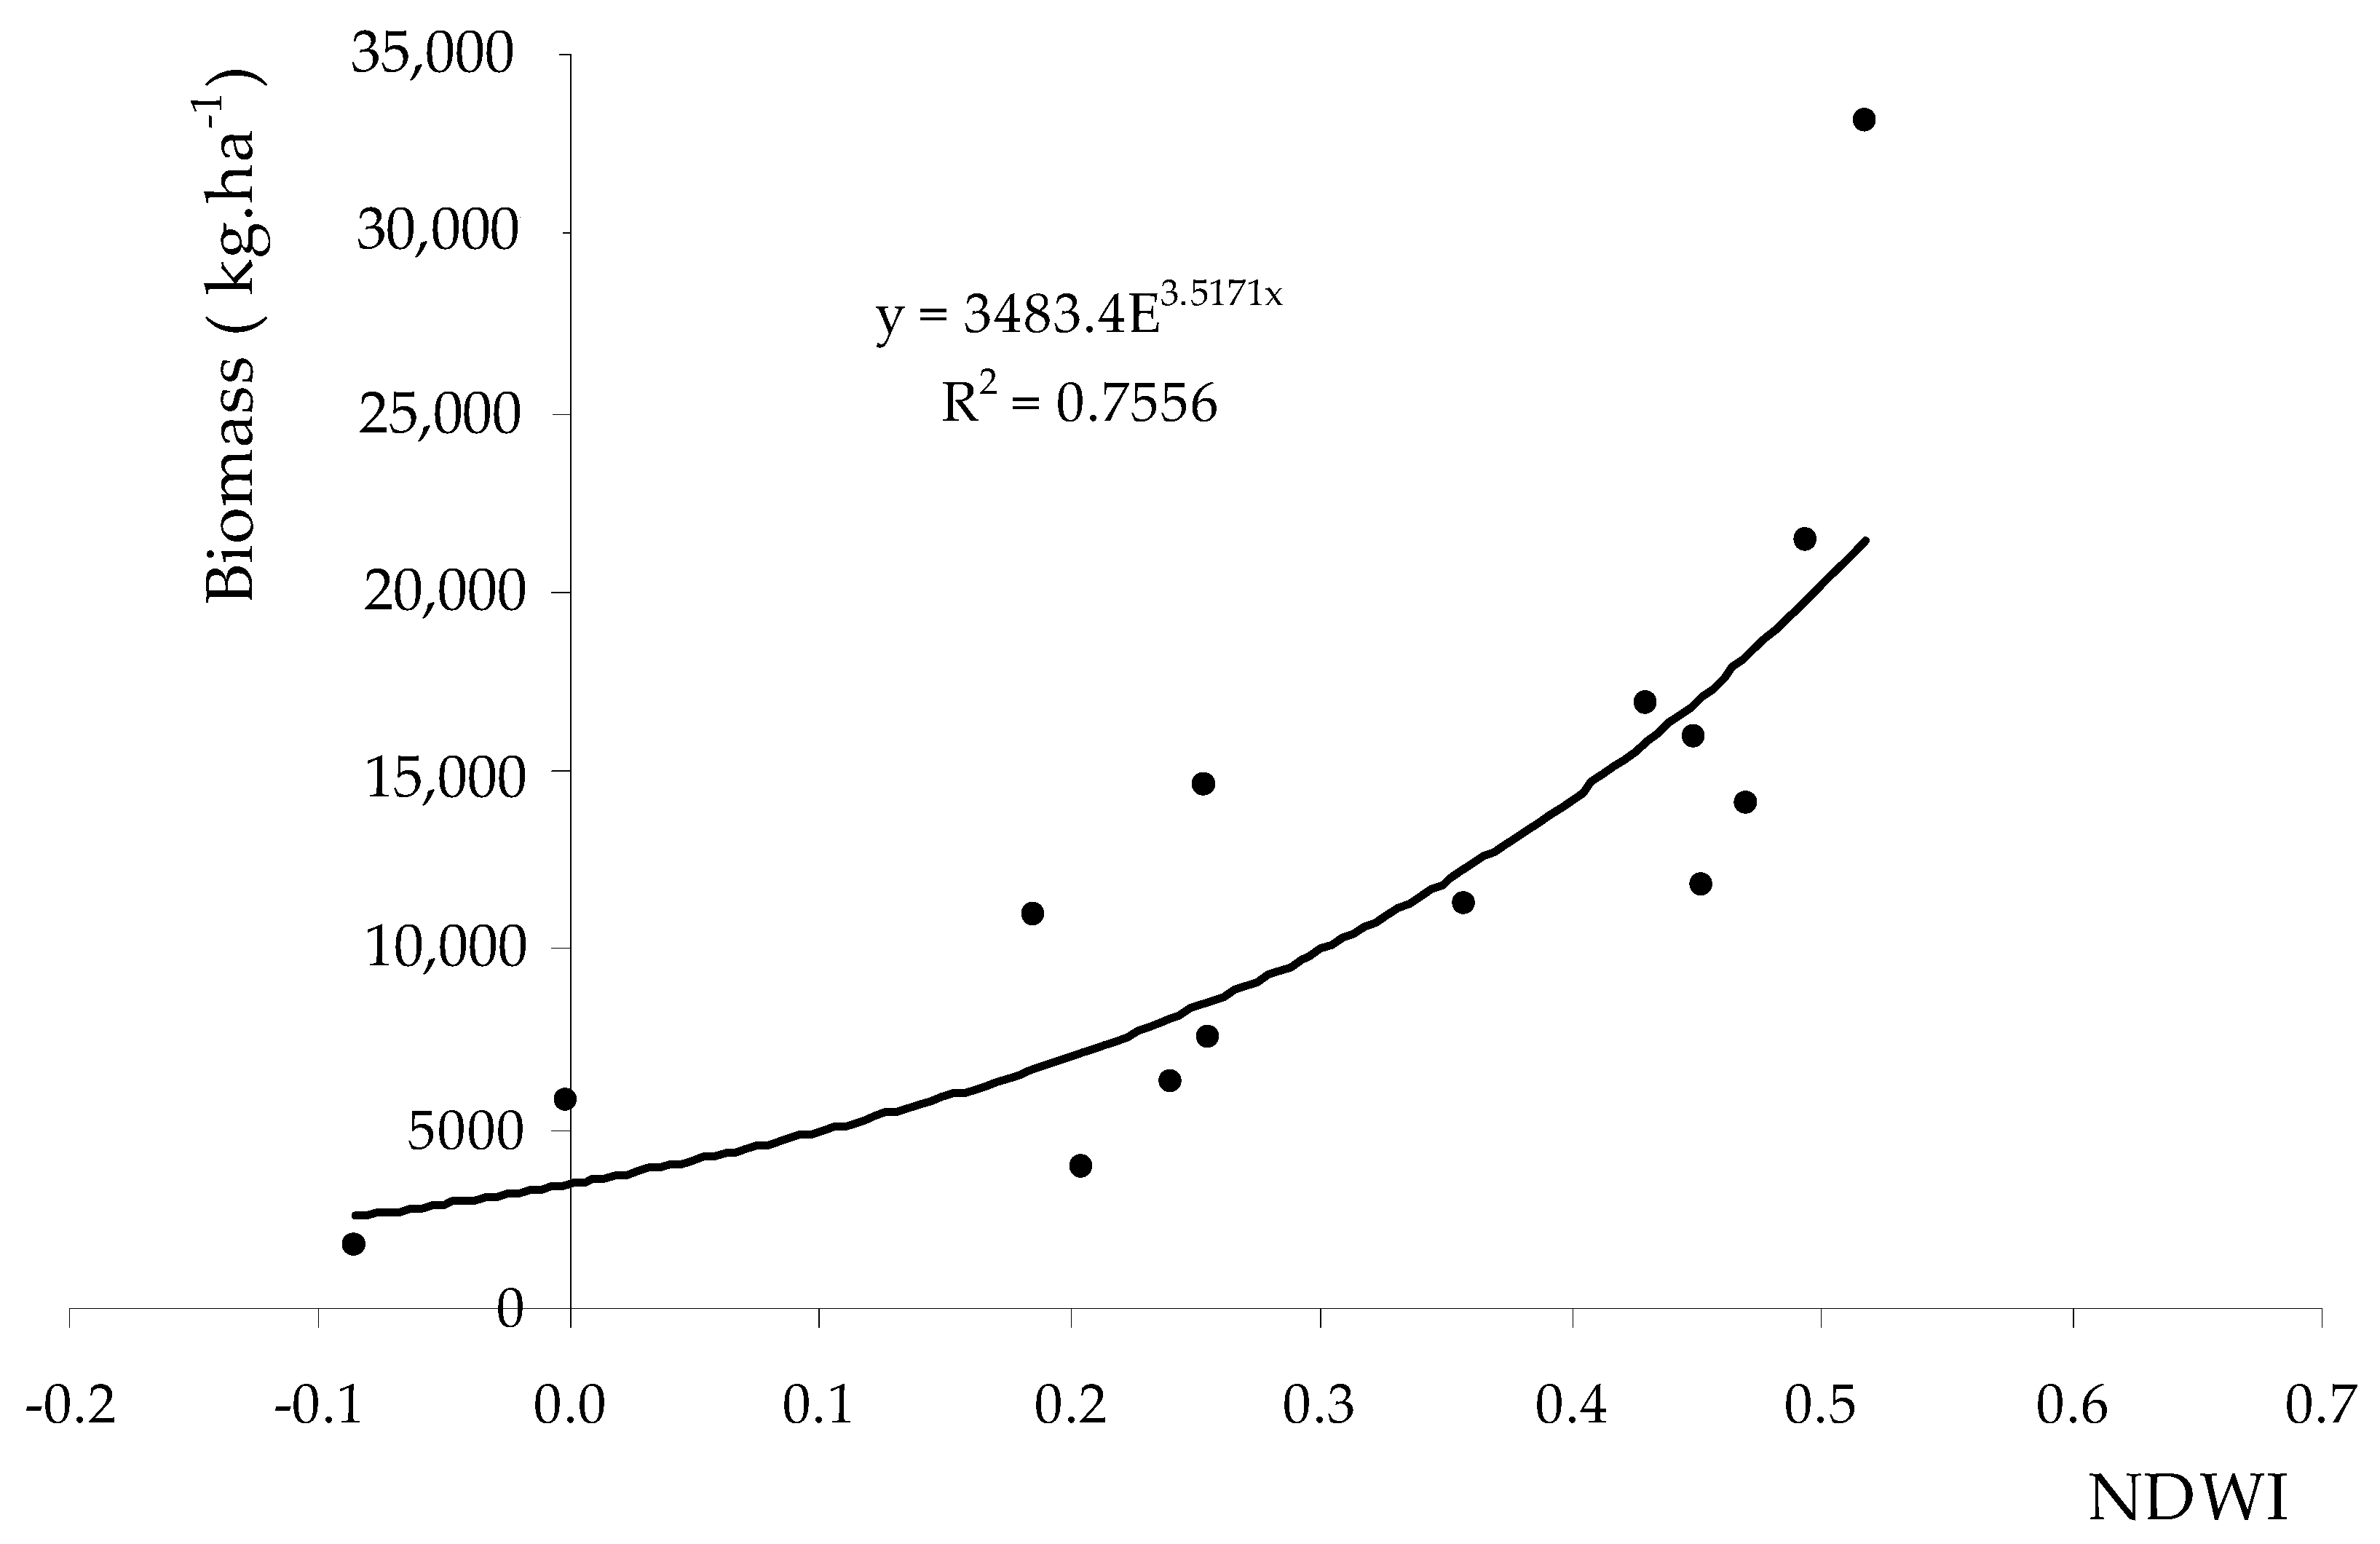
3.4. Correlation between NDWI and NDVI, SMC, Tir, Pasture Moisture Content (PMC), Biomass and Pasture Quality Degradation Index (PQDI)
4. Conclusions
Author Contributions
Funding
Acknowledgments
Conflicts of Interest
References
- David, T.; Pinto, C.; Nadezhdina, N.; Kurz-Besson, C.; Henriques, M.; Quilhó, T.; Cermak, J.; Chaves, M.; Pereira, J.; David, J. Root functioning, tree water use and hydraulic redistribution in Quercus suber trees: A modeling approach based on root sap flow. For. Ecol. Manag. 2013, 307, 136–146. [Google Scholar] [CrossRef]
- Chakroun, H.; Mouillot, F.; Hamdi, A. Regional equivalent water thickness modeling from remote sensing across a tree cover/LAI gradient in Mediterranean forests of Northern Tunisia. Remote Sens. 2015, 7, 1937–1961. [Google Scholar] [CrossRef]
- Piragnolo, M.; Pirotti, F.; Guarnieri, A.; Vettore, A.; Salogni, G. Geo-spatial support for assessment of anthropic impact on biodiversity. Int. J. Geo-Inf. 2014, 3, 599–618. [Google Scholar] [CrossRef]
- Efe Serrano, J. Pastures in Alentejo: Technical Basis for Characterization, Grazing and Improvement; Universidade de Évora: Évora, Portugal, 2006. [Google Scholar]
- Sánchez-Ruiz, S.; Piles, M.; Sánchez, N.; Martínez-Fernández, J.; Vall-llossera, M.; Camps, A. Combining SMOS with visible and near/shortwave/thermal infrared satellite data for high resolution soil moisture estimates. J. Hidrol. 2014, 516, 273–283. [Google Scholar] [CrossRef]
- Chai, X.; Zhang, T.; Shao, Y.; Gong, H.; Liu, L.; Xie, K. Modeling and mapping soil moisture of plateau pasture using RADARSAT-2 imagery. Remote Sens. 2015, 7, 1279–1299. [Google Scholar] [CrossRef]
- Serrano, J.; Shahidian, S.; Marques da Silva, J. Spatial variability and temporal stability of apparent soil electrical conductivity in a Mediterranean pasture. Precis. Agric. 2017, 18, 245–263. [Google Scholar] [CrossRef]
- Gu, Y.; Hunt, E.; Wardlow, B.; Basara, J.B.; Brown, J.F.; Verdin, J.P. Evaluation of MODIS NDVI and NDWI for vegetation drought monitoring using Oklahoma Mesonet soil moisture data. Geophys. Res. Lett. 2008, 35, L22401. [Google Scholar] [CrossRef]
- Serrano, J.; Shahidian, S.; Marques da Silva, J. Calibration of GrassMaster II to estimate green and dry matter yield in Mediterranean pastures: Effect of pasture moisture content. Crop Pasture Sci. 2016, 67, 780–791. [Google Scholar] [CrossRef]
- Serrano, J.; Shahidian, S.; Marques da Silva, J. Monitoring seasonal pasture quality degradation in the Mediterranean montado ecosystem: Proximal versus remote sensing. Water 2018, 10, 1422. [Google Scholar] [CrossRef]
- Gao, B.-C. NDWI—A normalized difference water index for remote sensing of vegetation liquid water from space. Remote Sens. Environ. 1996, 58, 257–266. [Google Scholar] [CrossRef]
- Pullanagari, R.R.; Kereszturi, G.; Yule, I. Integrating airborne hyperspectral, topographic, and soil data for estimating pasture quality using recursive feature elimination with random forest regression. Remote Sens. 2018, 10, 1117. [Google Scholar] [CrossRef]
- Georgi, C.; Spengler, D.; Itzerott, S.; Kleinschmit, B. Automatic delineation algorithm for site-specific management zones based on satellite remote sensing data. Precis. Agric. 2018, 19, 684–707. [Google Scholar] [CrossRef]
- Jackson, T.J.; Chen, D.; Cosh, M.; Li, F.; Anderson, M.; Walthall, C.; Doriaswamy, P.; Hunt, E.R. Vegetation water content mapping using Landsat data derived normalized difference water index for corn and soybeans. Remote Sens. Environ. 2004, 92, 475–482. [Google Scholar] [CrossRef]
- Wang, X.; Fuller, D.O.; Setemberg, L.; Miralles-Wilhelm, F. Foliar nutrient and water content in subtropical tree islands: A new chemohydrodynamic link between satellite vegetation indices and foliar δ15N values. Remote Sens. Environ. 2011, 3, 923–930. [Google Scholar] [CrossRef]
- FAO. World Reference Base for Soil Resources; Food and Agriculture Organization of the United Nations, World Soil Resources Reports No. 103; IUSS Working Group WRB: Rome, Italy, 2006. [Google Scholar]
- Serrano, J.; Shahidian, S.; Marques da Silva, J.; Sales-Baptista, E.; Ferraz de Oliveira, I.; Lopes de Castro, J.; Pereira, A.; Cancela de Abreu, M.; Machado, E.; Carvalho, M. Tree influence on soil and pasture: Contribution of proximal sensing to pasture productivity and quality estimation in montado ecosystems. Int. J. Remote Sens. 2018, 39, 4801–4829. [Google Scholar] [CrossRef]
- AOAC. AOAC Official Methods of Analysis of AOAC International, 18th ed.; AOAC International: Arlington, VA, USA, 2005. [Google Scholar]
- Badewa, E.; Unc, A.; Cheema, M.; Kavanagh, V.; Galagedara, L. Soil moisture mapping using multi-frequency and multi-coil electromagnetic induction sensors on managed Podzols. Agronomy 2018, 8, 224. [Google Scholar] [CrossRef]
- Wessels, K.J.; Prince, S.D.; Malherbe, J.; Small, J.; Frost, P.E.; Vanzyl, D. Can human-induced land degradation be distinguished from the effects of rainfall variability? J. Arid. Environ. 2007, 68, 271–297. [Google Scholar]
- Luo, Q. Temperature thresholds and crop production: A review. Clim. Chang. 2011, 109, 583–598. [Google Scholar] [CrossRef]
- Zhao, F.; Xu, B.; Yang, X.; Jin, Y.; Li, J.; Xia, L.; Chen, S.; Ma, H. Remote Sensing Estimates of Grassland Aboveground Biomass Based on MODIS Net Primary Productivity (NPP): A Case Study in the Xilingol Grassland of Northern China. Remote Sens. 2014, 6, 5368–5386. [Google Scholar] [CrossRef] [Green Version]
- Jin, Y.; Yang, X.; Qiu, J.; Li, J.; Gao, T.; Wu, Q.; Zhao, F.; Ma, H.; Yu, H.; Xu, B. Remote Sensing-Based Biomass Estimation and Its Spatio-Temporal Variations in Temperate Grassland, Northern China. Remote Sens. 2014, 6, 1496–1513. [Google Scholar] [CrossRef] [Green Version]
- Gao, T.; Yang, X.C.; Jin, Y.X.; Ma, H.L.; Li, J.Y.; Yu, H.D.; Yu, Q.Y.; Xiao, Z.; Xu, B. Spatio-temporal variation in vegetation biomass and its relationships with climate factors in the Xilingol grasslands, Northern China. PLoS ONE 2013, 8, e83824. [Google Scholar] [CrossRef] [PubMed]
- Sala, O.E.; Parton, W.J. Primary production of the central grassland region of the United States. Ecology 1988, 69, 40–45. [Google Scholar] [CrossRef]
- Maki, M.; Ishiahra, M.; Tamura, M. Estimation of leaf water status to monitor the risk of forest fires by using remotely sensed data. Remote Sens. Environ. 2004, 90, 441–450. [Google Scholar] [CrossRef]
- Schmidt, M.; Carter, J.; Stone, G.; O’Reagain, P. Integration of optical and X-band radar data for pasture biomass estimation in an open savannah woodland. Remote Sens. 2016, 8, 989. [Google Scholar] [CrossRef]
- Lumbierres, M.; Méndez, P.F.; Bustamante, J.; Soriguer, R.; Santamaria, L. Modeling biomass production in seasonal wetlands using Modis NDVI land surface phenology. Remote Sens. 2017, 9, 392. [Google Scholar] [CrossRef]
- Trotter, M.G.; Lamb, D.W.; Donald, G.E.; Schneider, D.A. Evaluating an active optical sensor for quantifying and mapping green herbage mass and growth in a perennial grass pasture. Crop Pasture Sci. 2010, 61, 389–398. [Google Scholar] [CrossRef]
- Schaefer, M.T.; Lamb, D.W. A combination of plant NDVI and Lidar measurements improve the estimation of pasture biomass in Tall Fescue (Festuca Arundinacea Var. Fletcher). Remote Sens. 2016, 8, 109. [Google Scholar] [CrossRef]
- Edirisinghe, A.; Clark, D.; Waugh, D. Spatio-temporal modelling of biomass of intensively grazed perennial dairy pastures using multispectral remote sensing. Int. J. Appl. Earth Obs. 2012, 16, 5–16. [Google Scholar] [CrossRef]


| Parameters | DOY | SMC (%) | Tir (°C) |
|---|---|---|---|
| 2017 January February March April May June July August September October November December | 15 50 80 110 140 165 195 215 255 290 330 345 | 18.3 ± 3.3 20.1 ± 3.2 15.1 ± 2.5 10.1 ± 2.1 9.4 ± 2.0 8.9 ± 1.9 7.4 ± 2.0 7.2 ± 1.9 7.0 ± 2.6 10.4 ± 1.9 12.3 ± 2.0 18.8 ± 2.7 | 3.8 ± 2.5 12.2 ± 1.0 12.2 ± 0.8 23.5 ± 2.9 35.8 ± 2.3 33.0 ± 5.6 32.1 ± 3.1 31.0 ± 4.2 22.3 ± 4.7 20.5 ± 0.9 9.1 ± 0.3 5.9 ± 2.2 |
| 2018 January February March April May June | 15 40 50 100 125 150 | 21.9 ± 3.6 17.8 ± 2.8 23.9 ± 4.6 23.6 ± 3.8 18.8 ± 2.6 13.5 ± 2.2 | 1.9 ± 1.2 0.5 ± 1.8 12.5 ± 2.0 12.7 ± 1.9 12.9 ± 1.0 16.7 ± 0.8 |
| Parameters | DOY | Biomass (kg·ha−1) | PMC (%) | CP (%) | NDF (%) | PQDI |
|---|---|---|---|---|---|---|
| 2016 March April May June | 80 120 150 160 | 14,106 ± 7095 21,403 ± 9128 33,149 ± 13,221 11,023 ± 3888 | 85.8 ± 2.6 85.9 ± 1.3 88.0 ± 4.0 60.5 ± 6.9 | 12.8 ± 1.6 10.5 ± 1.8 8.6 ± 2.2 7.7 ± 1.3 | 36.2 ± 4.1 50.5 ± 5.5 64.5 ± 2.9 65.1 ± 5.0 | 2.8 ± 0.4 5.1 ± 1.5 8.1 ± 2.7 10.1 ± 2.6 |
| 2017 February March April May June | 50 80 110 140 165 | 6300 ± 3802 11,292 ± 6041 14,567 ± 8440 5767 ± 2178 1725 ± 763 | 71.0 ± 13.6 79.7 ± 5.0 66.2 ± 5.8 47.9 ± 8.4 14.7 ± 4.8 | 14.2 ± 3.5 14.8 ± 3.2 9.4 ± 1.3 7.7 ± 1.2 5.4 ± 0.8 | 51.2 ± 12.9 49.6 ± 7.8 60.4 ± 5.1 72.7 ± 3.7 78.1 ± 2.6 | 4.0 ± 2.1 3.5 ± 1.2 8.5 ± 1.9 9.7 ± 2.0 14.9 ± 2.5 |
| 2018 February March April May June | 40 50 100 125 150 | 3973 ± 3193 7587 ± 5448 16,880 ± 11,256 11,833 ± 4566 15,990 ± 5800 | 76.2 ± 8.9 80.9 ± 6.5 83.6 ± 2.3 81.7 ± 3.1 70.6 ± 3.1 | 15.9 ± 4.5 15.0 ± 3.0 10.8 ± 2.0 14.0 ± 3.2 9.1 ± 1.5 | 33.5 ± 15.3 33.8 ± 10.8 37.7 ± 6.5 44.7 ± 7.0 59.2 ± 4.3 | 2.5 ± 1.9 2.5 ± 1.4 3.6 ± 0.9 3.4 ± 1.1 6.7 ± 1.3 |
| Year (Valid Records) | DOY | NDWI | NDVI |
|---|---|---|---|
| 2016 1st semester (7) | 80 120 140 150 160 170 180 | 0.471 ± 0.008 0.494 ± 0.016 0.401 ± 0.014 0.517 ± 0.022 0.185 ± 0.032 0.040 ± 0.036 −0.022 ± 0.020 | 0.624 ± 0.025 0.687 ± 0.039 0.615 ± 0.025 0.478 ± 0.044 0.413 ± 0.018 0.379 ± 0.050 0.318 ± 0.031 |
| 2017 1st semester (10) | 15 50 80 95 110 140 155 165 175 180 | 0.231 ± 0.031 0.240 ± 0.040 0.358 ± 0.036 0.318 ± 0.054 0.254 ± 0.046 −0.002 ± 0.035 −0.079 ± 0.039 −0.086 ± 0.027 −0.067 ± 0.018 −0.018 ± 0.017 | 0.610 ± 0.090 0.576 ± 0.059 0.640 ± 0.039 0.675 ± 0.040 0.596 ± 0.051 0.340 ± 0.052 0.311 ± 0.055 0.261 ± 0.048 0.224 ± 0.024 0.118 ± 0.027 |
| 2017 2nd semester (6) | 195 215 255 290 330 345 | −0.126 ± 0.024 −0.108 ± 0.019 −0.129 ± 0.013 0.007 ± 0.019 −0.001 ± 0.064 0.098 ± 0.040 | 0.250 ± 0.038 0.232 ± 0.040 0.234 ± 0.049 0.242 ± 0.062 0.372 ± 0.089 0.478 ± 0.047 |
| 2018 1st semester (18) | 15 40 50 65 80 85 90 100 110 120 125 130 135 150 165 170 175 180 | 0.192 ± 0.022 0.205 ± 0.076 0.255 ± 0.051 0.247 ± 0.081 0.414 ± 0.044 0.427 ± 0.050 0.465 ± 0.049 0.430 ± 0.036 0.442 ± 0.020 0.425 ± 0.025 0.452 ± 0.013 0.445 ± 0.020 0.398 ± 0.024 0.449 ± 0.038 0.091 ± 0.024 0.002 ± 0.024 −0.055 ± 0.023 −0.014 ± 0.021 | 0.568 ± 0.079 0.624 ± 0.047 0.560 ± 0.045 0.654 ± 0.051 0.732 ± 0.043 0.721 ± 0.036 0.633 ± 0.063 0.695 ± 0.033 0.591 ± 0.025 0.667 ± 0.038 0.718 ± 0.015 0.709 ± 0.018 0.685 ± 0.033 0.397 ± 0.043 0.356 ± 0.026 0.300 ± 0.042 0.271 ± 0.038 0.248 ± 0.042 |
© 2019 by the authors. Licensee MDPI, Basel, Switzerland. This article is an open access article distributed under the terms and conditions of the Creative Commons Attribution (CC BY) license (http://creativecommons.org/licenses/by/4.0/).
Share and Cite
Serrano, J.; Shahidian, S.; Marques da Silva, J. Evaluation of Normalized Difference Water Index as a Tool for Monitoring Pasture Seasonal and Inter-Annual Variability in a Mediterranean Agro-Silvo-Pastoral System. Water 2019, 11, 62. https://doi.org/10.3390/w11010062
Serrano J, Shahidian S, Marques da Silva J. Evaluation of Normalized Difference Water Index as a Tool for Monitoring Pasture Seasonal and Inter-Annual Variability in a Mediterranean Agro-Silvo-Pastoral System. Water. 2019; 11(1):62. https://doi.org/10.3390/w11010062
Chicago/Turabian StyleSerrano, João, Shakib Shahidian, and José Marques da Silva. 2019. "Evaluation of Normalized Difference Water Index as a Tool for Monitoring Pasture Seasonal and Inter-Annual Variability in a Mediterranean Agro-Silvo-Pastoral System" Water 11, no. 1: 62. https://doi.org/10.3390/w11010062