Commentary

Development of an Ice Jam Flood Forecasting System for the Lower Oder River—Requirements for Real-Time Predictions of Water, Ice and Sediment Transport

by
Karl-Erich Lindenschmidt
1,*,
Dirk Carstensen
2,
Wolfgang Fröhlich
3,
Bernd Hentschel
4,
Stefan Iwicki
5,
Michael Kögel
2,
Michał Kubicki
6,
Zbigniew W. Kundzewicz
7,
Cornelia Lauschke
8,
Adam Łazarów
5,
Helena Łoś
9,
Włodzimierz Marszelewski
10,
Tomasz Niedzielski
11,
Marcin Nowak
10,
Bogusław Pawłowski
10,
Michael Roers
3,
Stefan Schlaffer
12 and
Beata Weintrit
6
1
Global Institute for Water Security, University of Saskatchewan, Saskatoon, Saskatchewan, S7N 3H5, Canada
2
Institut für Wasserbau und Wasserwirtschaft, Technische Hochschule Nürnberg, 90489 Nürnberg, Germany
3
Landesamt für Umwelt Brandenburg, 15236 Frankfurt/Oder, Germany
4
Federal Waterways Engineering and Research Institute (BAW), 76187 Karlsruhe, Germany
5
Department of Inland Waterways, Regional Water Management Authority, 70-001 Szczecin, Poland
6
Astri Polska Sp. z o.o., 02-256 Warsaw, Poland
7
Institute for Agricultural and Forest Environment, Polish Academy of Sciences, 60-809 Poznań, Poland
8
Wasser-und Schifffahrtsverwaltung, 16225 Eberswalde, Germany
9
Institute of Agrophysics, Polish Academy of Sciences, 20-280 Lublin, Poland
10
Department of Hydrology and Water Management, Nicolaus Copernicus University in Toruń, 87-100 Toruń, Poland
11
Department of Geoinformatics and Cartography, University of Wrocław, 50-137 Wrocław, Poland
12
German Aerospace Centre (DLR), 82234 Weßling, Germany
*
Author to whom correspondence should be addressed.
Water 2019, 11(1), 95; https://doi.org/10.3390/w11010095
Submission received: 17 December 2018 / Revised: 27 December 2018 / Accepted: 29 December 2018 / Published: 8 January 2019

Abstract

:
Despite ubiquitous warming, the lower Oder River typically freezes over almost every year. Ice jams may occur during freeze-up and ice cover breakup phases, particularly in the middle and lower reaches of the river, with weirs and piers. The slush ice and ice blocks may accumulate to form ice jams, leading to backwater effects and substantial water level rise. The small bottom slope of the lower Oder and the tidal backflow from the Baltic Sea enhance the formation of ice jams during cold weather conditions, jeopardizing the dikes. Therefore, development of an ice jam flood forecasting system for the Oder River is much needed. This commentary presents selected results from an international workshop that took place in Wrocław (Poland) on 26–27 November 2018 that brought together an international team of experts to explore the requirements and research opportunities in the field of ice jam flood forecasting and risk assessment for the Oder River section along the German–Polish border. The workshop launched a platform for collaboration amongst Canadian, German and Polish scientists, government officials and water managers to pave a way forward for joint research focused on achieving the long-term goal of forecasting, assessing and mitigating ice jam impacts along the lower Oder. German and Polish government agencies are in need of new tools to forecast ice jams and assess their subsequent consequences and risks to communities and ship navigation along a river. Addressing these issues will also help research and ice flood management in a Canadian context. A research program would aim to develop a modelling system by addressing fundamental issues that impede the prediction of ice jam events and their consequences in cold regions.

1. Introduction

Large floods continue to bring death and suffering and immense economic damage throughout the world. Therefore, it is necessary to reduce the flood risk, understood as a combination of hazard, exposure and vulnerability, by improving flood risk governance systems. There is a panoply of structural and non-structural (including flood forecasting) approaches that lend themselves to applications in order to achieve this effect [1]. However, typically, general studies of recent river flood risk in Europe (using a topography-based flood hazard map together with land-use data and damage-stage relationship for various land uses, cf. [2]) or flood hazard projections for the future that may strongly disagree between studies (see [3]) do not recognize ice jam floods as a special category.
The Oder River is a large international river in Central Europe flowing from its headwaters in the Czech Republic, through Poland and along the German–Polish border before draining into the southern Baltic Sea. Its drainage basin, covering an area of 119,041 km2, belongs to three countries: the Czech Republic, Poland (where 88% of the area of the Oder basin is located) and Germany. The lower Oder River (see Figure 1) borders along Germany and Poland, a region influenced by continental winds, and typically freezes over almost every year. Ice jams have occurred during freeze-up and ice cover breakup along the river, particularly in the middle and lower reaches where the river bottom slope is small and river structures (weirs and piers) arrest the flow of frazil ice and ice blocks (exemplarily shown in Figure 2). The slush ice and ice blocks accumulate at these ice bridgings to form ice jams, which can lead to backwater effects. Water levels can rise up to 1.5 m in a very short time to cause overbank flooding [4]. The small bed slope of the lower reaches of the Oder River and the tidal backflow from the Baltic Sea promote the formation of ice and ice jam occurrences during cold weather conditions. Such events make dikes along this part of the river particularly vulnerable to breaches, a potentially catastrophic outcome of extended flooding throughout the adjacent low-lying area of the Oderbruch.
An ice jam flood forecasting system is required for the Oder River to help curb ice jam evolution and mitigate ice jam flooding. At best, an ice cover observation system is currently in place to track the potential development of ice jams. Such ice jam flood warning systems require extensive field observations and may have considerable uncertainty [5] due to time lags between observations and reporting. Nonetheless, flood forecasting and risk mapping are urgently needed by government agencies. Forecasting the occurrence of ice jams is, however, challenging for several reasons. The processes of ice cover breakup and ice jamming are complex and nonlinear, and numerous morphological, meteorological and hydrological factors interact during ice jam formation. Some empirical and process-based attempts have been made by White [6,7] to develop forecasting methods, however, these approaches tend to be very site-specific and can only be used as a first step to determine possible causalities between these factors. Forecasting systems have also been attempted with neural network and fuzzy logic systems [8,9], however, the physical processes underlying the cause–effect relationships of ice jam formation are not considered in such approaches. Models have been developed to predict backwater levels of ice jamming events, e.g., River2D [10] and HEC-RAS (Hydrologic Engineering Center—River Analysis System) [11], but these systems do not predict the ice jam locations, which must be prescribed in these models to simulate backwater levels.
On 26–27 November 2018, an international workshop took place in Wrocław, Poland addressing the topic of “Development of an ice jam flood forecasting system for the Oder River”. All participants are listed as co-authors of this paper. The workshop is the first step in assembling an international team of scientists, government officials and water managers to explore a way forward on achieving the long-term goal of forecasting, assessing and mitigating ice jam impacts along the lower Oder River. Such a platform can help develop new tools for German and Polish government agencies to forecast ice jams and assess their subsequent consequences and risks to communities and ship navigation along the river. The network will also help advance research in river ice processes and ice flood management with the aim of developing more reliable modelling systems to address fundamental issues that impede the prediction of ice jam events and their consequences in all cold region countries worldwide.

2. Ice Cover Breakage as an Ice Flood Mitigation Scheme

Currently, ice jamming and ice jam flooding is mitigated by breaking the ice using fleets of ice breakers from both German and Polish water authorities. Generally, the ice breakers are driven in the upstream direction so that broken ice can float unhindered downstream into the Szczecin Estuary. An effective technique in breaking up the ice cover, depicted in Figure 3, is to drive the ice breakers in circles through the ice around perimeters of large ice sheets that dislodge and break up further as they float downstream. Operating in parallel through the ice, against the current, as shown in Figure 4, is also quite effective in breaking ice, particularly for thinner ice covers on low sloping waters.
Many ice breakers are equipped with GPS systems for easy location of the vessels and deriving the extent of ice cover breakage. Information is also acquired through ice observers (personnel that travel along the shores of the river and make observations of the ice situation and extent). This information is useful for planning further ice breakage campaigns. The data is made publicly available at the ELWIS website (https://www.elwis.de/DE/dynamisch/gewaesserkunde/eislage/) (ELWIS—Elektronische Wasserstraßen-Informationssystem; English = electronic waterways information system) with water levels to be found at the PEGELONLINE (English = Gauge Online) web service (https://www.pegelonline.wsv.de/). Ice breaking operations and planning could profit from an ice jam forecasting service by, for instance, narrowing the distance for the ice observers who generally have to cover 160 km of river.
A hindrance to ice breakage is low water flow (and depth), which prevents many of the vessels from being able to drive along the river without grounding on the river bed or sandbars. Too high water levels can also be a problem for vessels to pass underneath many bridges crossing the Oder River (see Figure 5).

3. Requirements for an Ice Jam Flood Forecasting System on the Oder River

When developing an ice jam flood forecasting system, it is important that the whole life-cycle of the ice jam, from formation, to extension and further to movement, be taken into consideration. Figure 6 shows a scheme of an ice jam. Highlighted in the figure are the areas of high erosion at the ice jam toe. Due to increased flow velocities under the ice jam, scour may occur more abrasively at the river bed and erode ice from the ice jam.

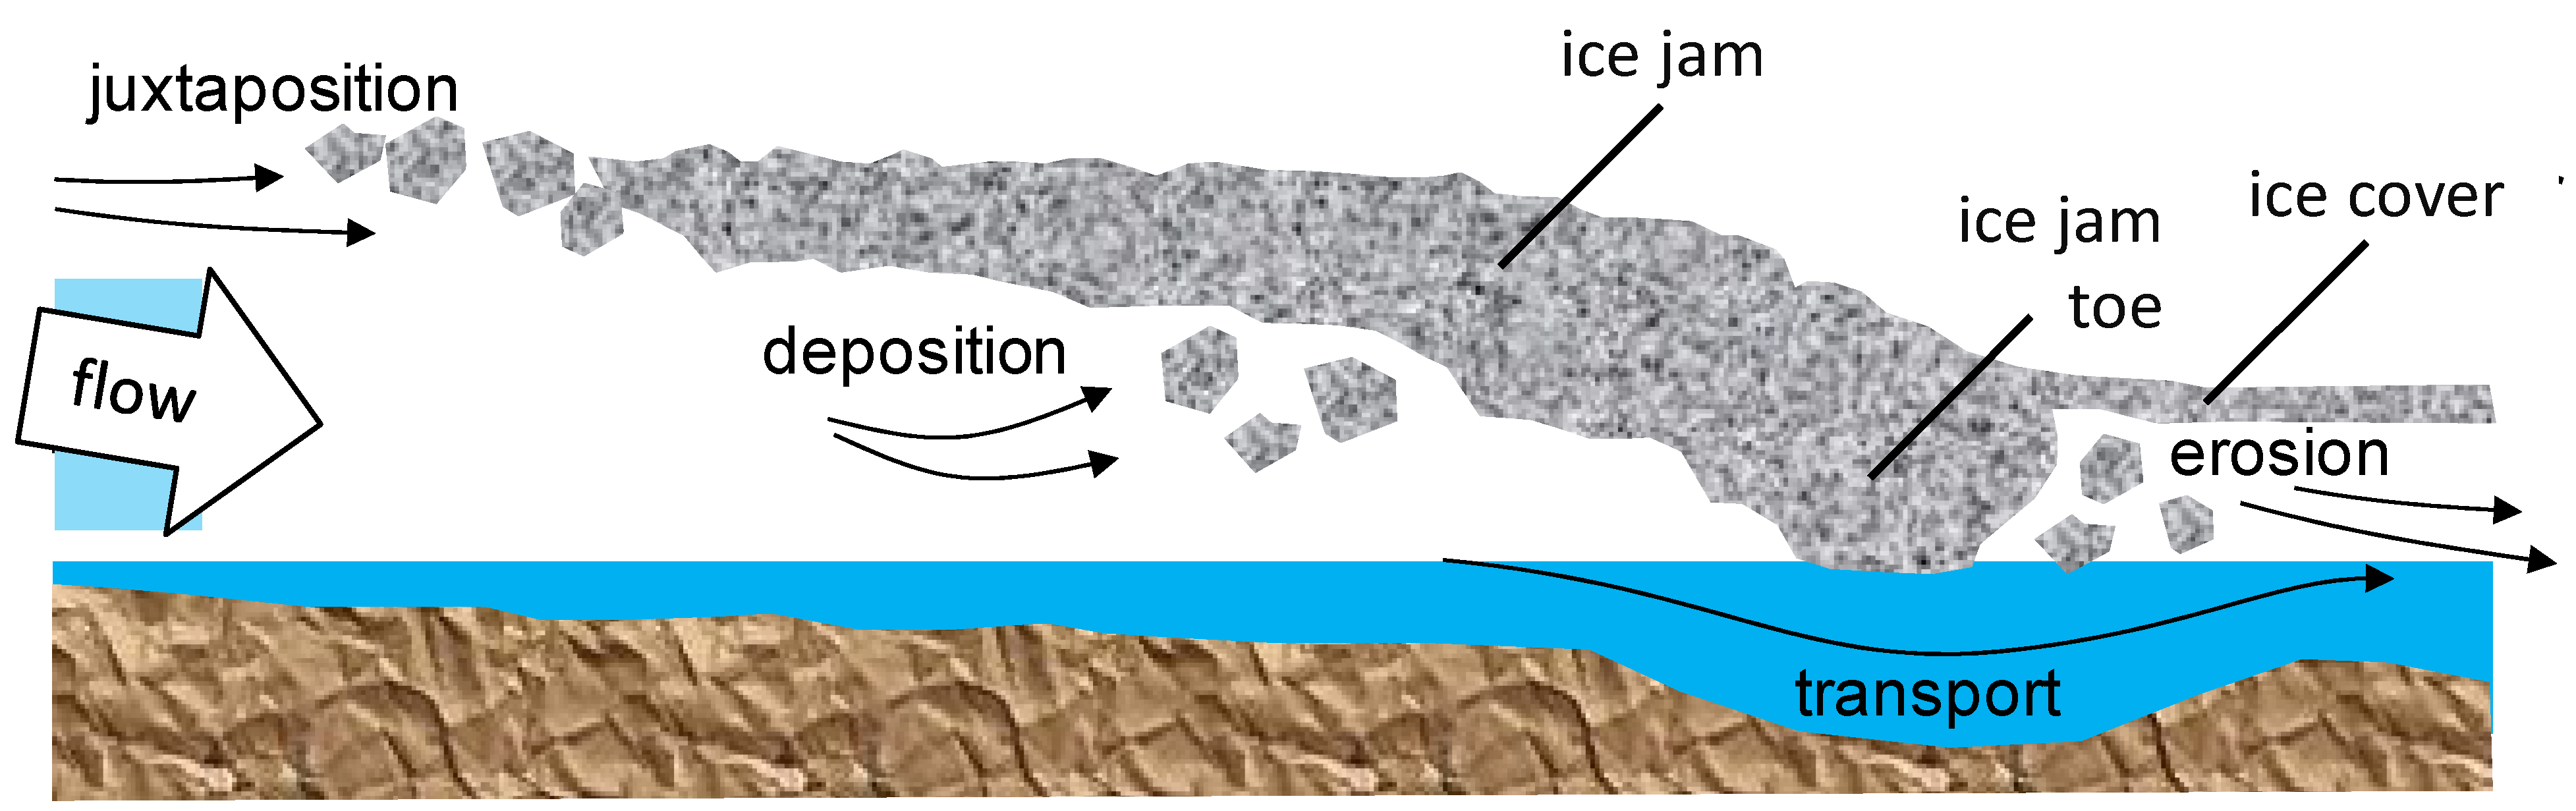
3.1. Ice Jam Formation

The formation of an ice jam depends on many different factors:
  • Characteristics of the moving ice floes—large vs. small, thick vs. thin;
  • Flow velocity and temperature of the water—faster flows will tend to increase thrust on the ice jam front and drag along the underside of the ice jam, which will increase the severity of the jam and resulting backwater staging; higher water temperatures can ablate the ice quicker;
  • Form of the river profile—both meandering or varying cross-sectional flow areas influence flow velocity fields;
  • Characteristics of the river bed (sediment)—gravel beds will erode less than beds with soft sediment;
  • Weather conditions—cold air temperatures will create more ice and also increase cohesion to consolidate ice covers more quickly.

3.2. Ice Cover Extension

Experience has shown that ice jams generally lead to backwater levels between 0.6 m and 1.5 m of increased staging. The speed at which the front of the ice cover extends upstream can be very different. In 2012, the front progressed from Stützkow to Kietz within six days. In 2016, the front progression only required three days for the same 66 km length. This process is illustrated in Figure 7. From 4–7 February 2016, the front of the ice cover advanced past the four gauges shown. Each time, the staging is followed by a slight decrease in water levels. This indicates that the highly dynamic ice and hydraulic processes, particularly at the river bed and the underside of the ice cover, have subsided. The abrupt decrease in water level immediately after the stage peak at Hohensaaten-Finow is an indication of high erosion of the river bed at the ice jam location. Once the ice jam has been established, its upstream extension and thickening will also depend on many factors:
  • Amount of incoming ice—determines the supply of ice to the jam and its juxtapositioning cover; more ice supplied from upstream floes and frazil ice may shove and thicken the jams, exasperating backwater staging;
  • Weather conditions in the upstream river basin—persistent cold weather will generate more ice; rain-on-snow or rain-on-frozen ground events can increase discharges and lead to increased staging before ice jams are flushed out of the river stretch;
  • Water level (size of flooded area) during ice generation;
  • Dynamic water level in the ice generation zone;
  • Structure of the ice floes—e.g., thickness, size and consistency of the ice floes.

3.3. Ice Cover Movement

Once the ice jam and its extended cover has been established to persist for, in some cases, several days, changes occur in the ice that lead to abrupt movements of sections of the cover leading to:
  • Shifts in the ice causing shear stresses along the bottom of the ice cover to redistribute and break sections of the cover;
  • Sections of broken ice sheets submerging under downstream covers to form layers leading to thickening of ice;
  • Open leads which often form when ice releases from the cover and submerge to be swept with the current and deposited on downstream ice covers and established ice jams.
An important consideration of ice jam flooding is the short time frame to issue flood alerts and warnings if a jam and extreme backwater staging occur. Figure 8 shows an abrupt rise in backwater levels, approximately within five hours to the peak, recorded at Ratzdorf from a downstream ice jam. Superimposed are the four stages of flood warnings, loosely translated from the German as: A-I flood watch (Meldebeginn), A-II flood warning (Kontrolldienst), A-III flood alert (Wachdienst) and A-IV flood defense (Hochwasserabwehr). The water levels almost attained a level A-IV, for which, generally, an intensive flood defense notice would have been issued. In this specific case, this would have meant intensive observations of the dike and the introduction of possible protective measures. Fortunately, in this case, there were no dike breaches. Hence, an ice jam flood forecasting system will need to address the following questions:
  • Where will an ice jam occur?
  • When will the ice jam occur?
  • How much backwater staging will result?
  • What is the time to peak?
  • Will there be potential water level rises after an ice jam releases?

4. Summary of Current Research

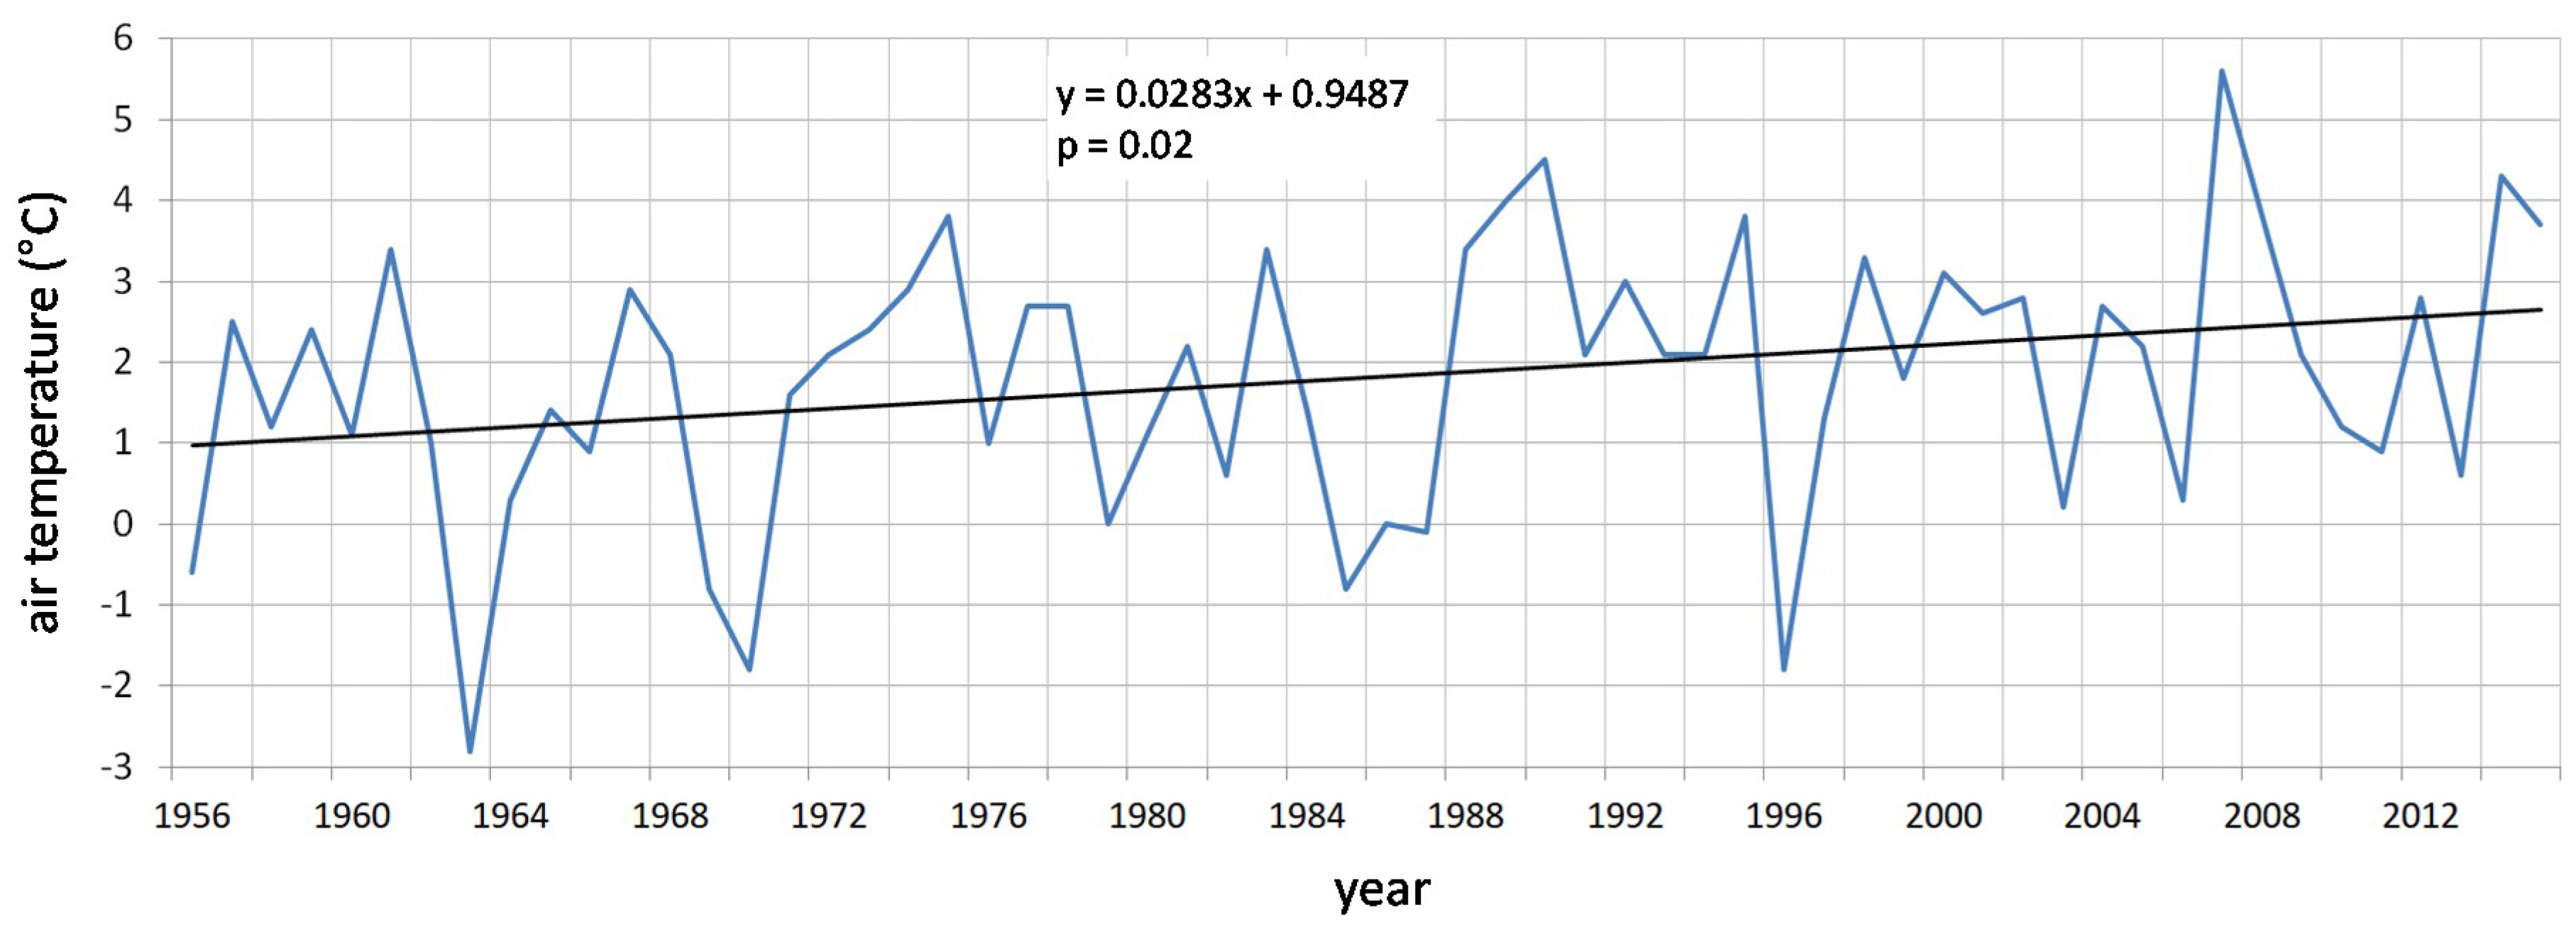
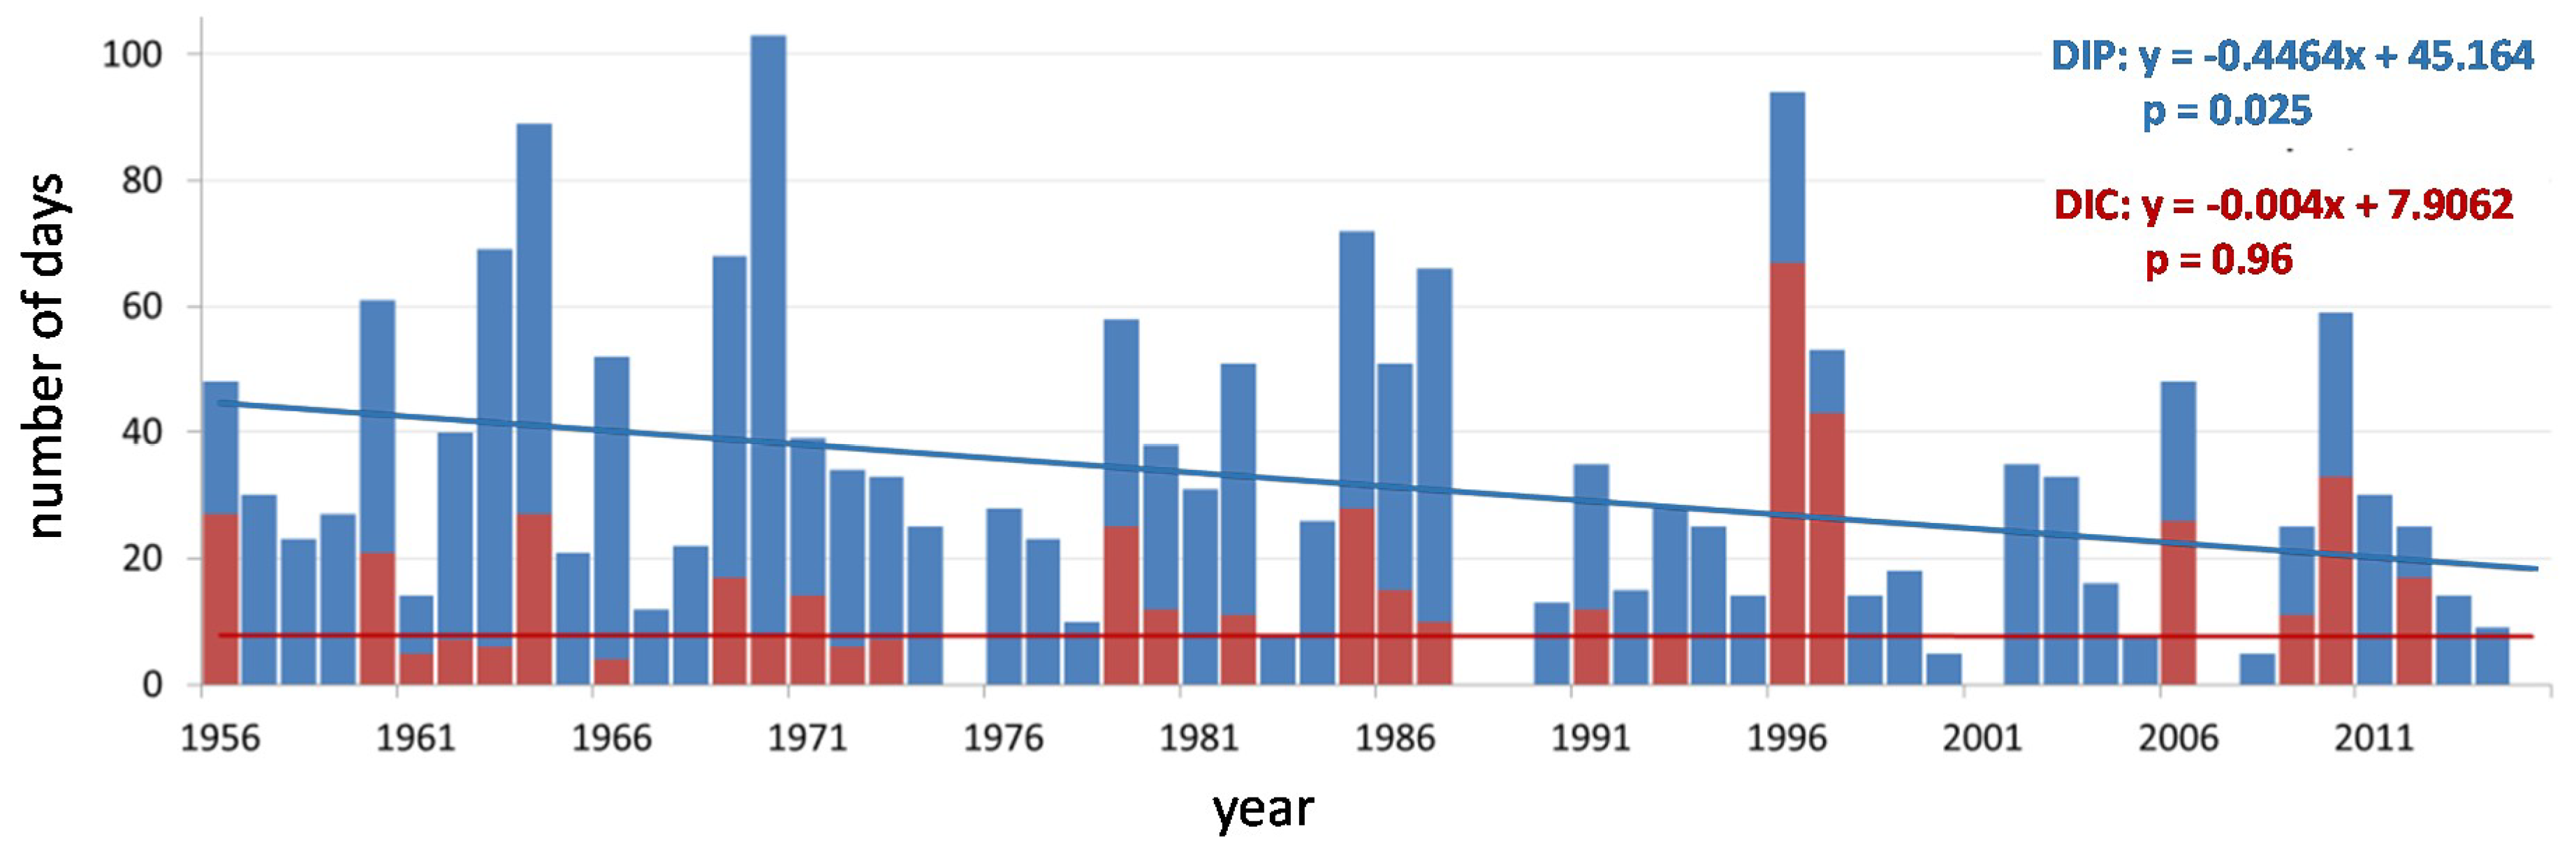
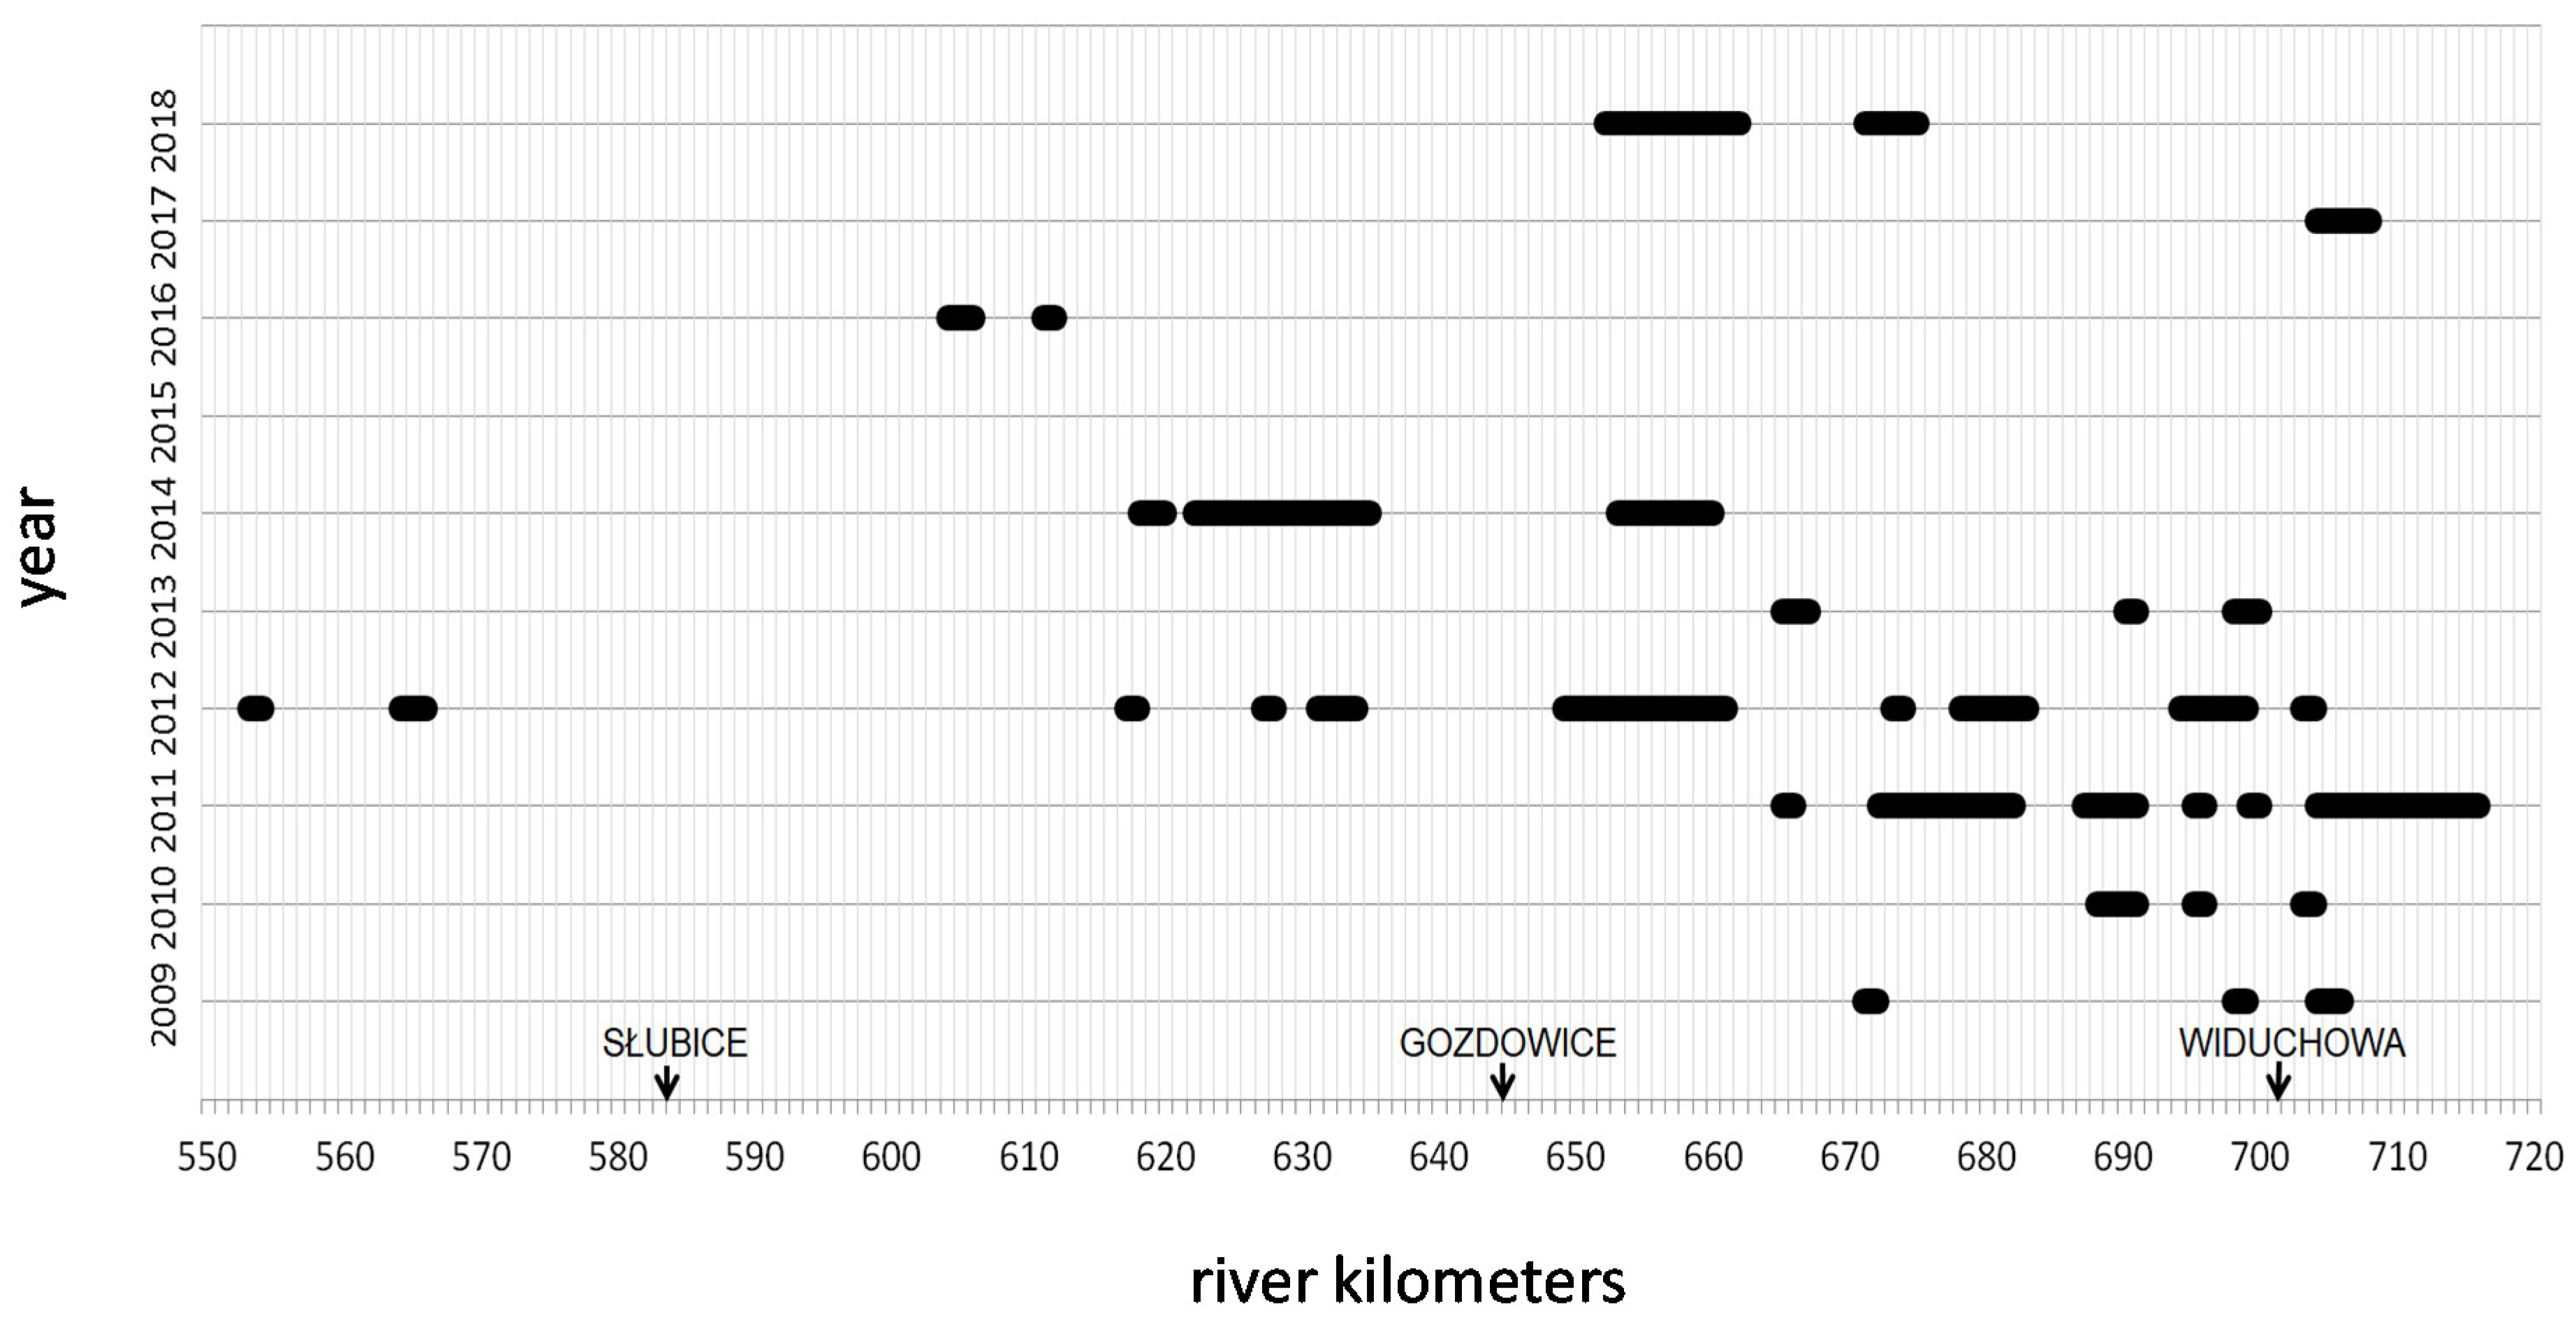
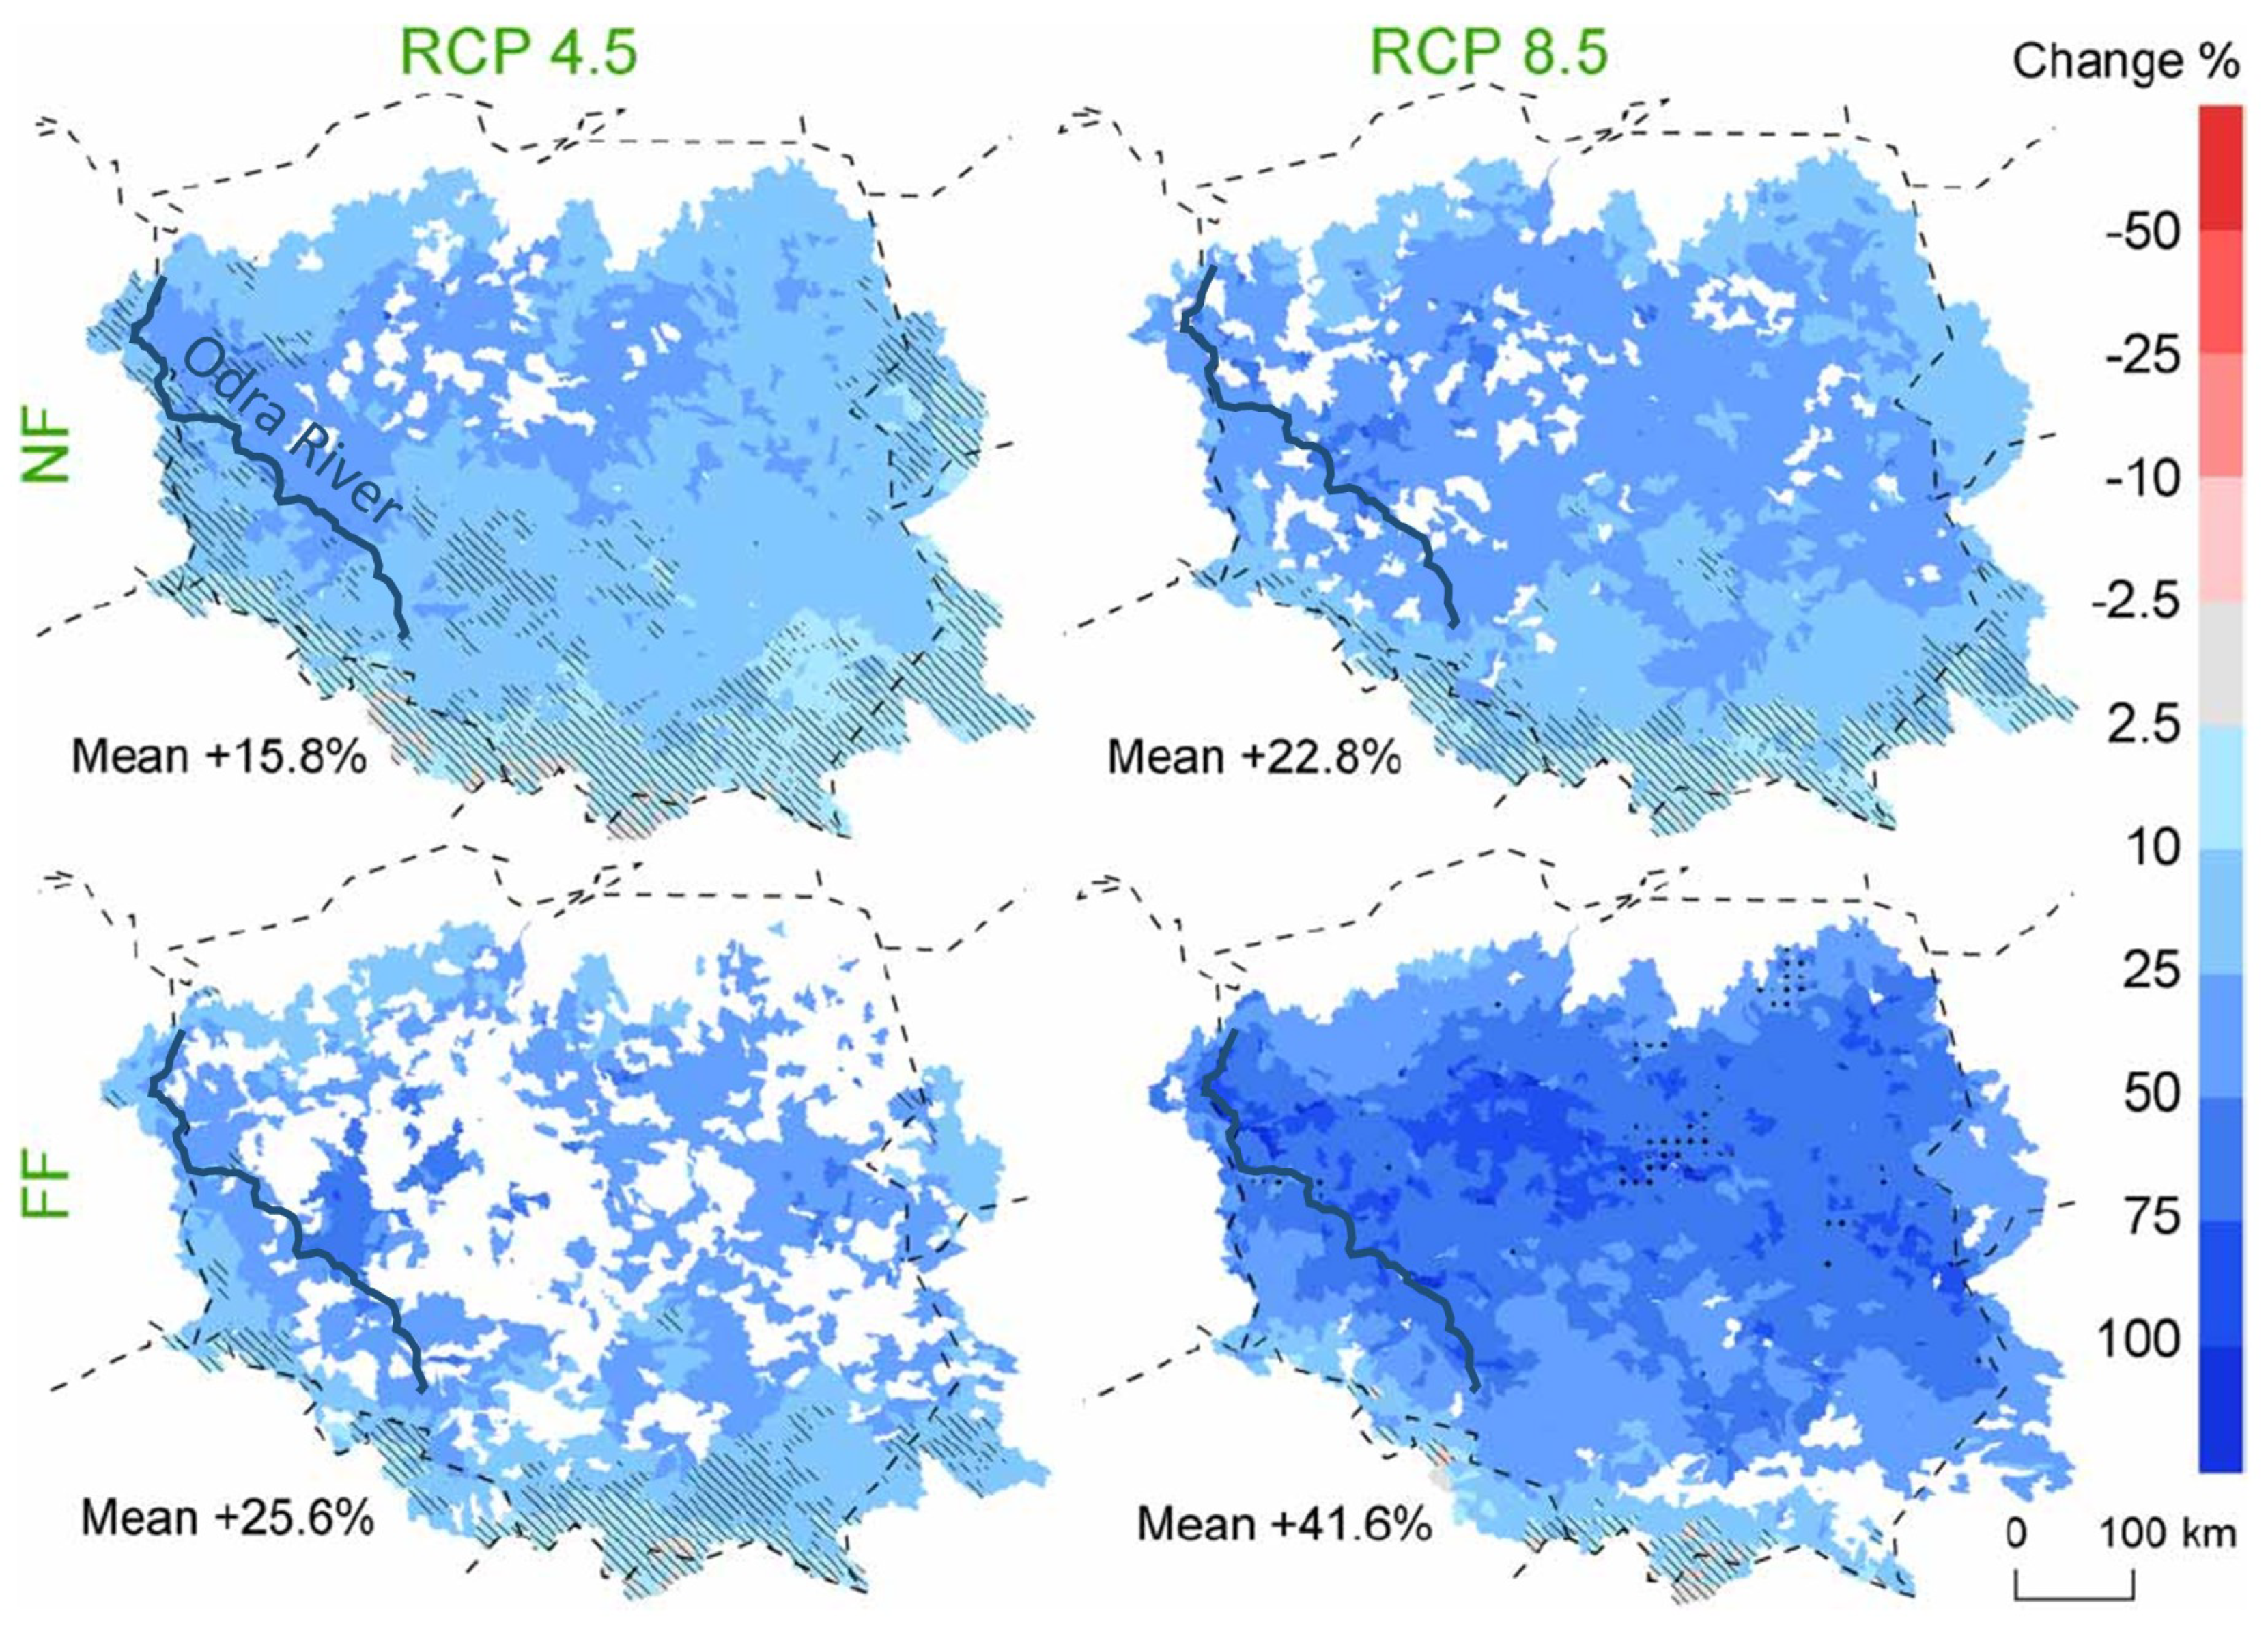
4.1. Climate Trends in the Oder River Basin

Along the lower reach of the Oder River, three stations on the Polish side of the river, at Widuchowa, Gozdowice and Słubice, record meteorological data. Generally, a warming trend is evident in the mean seasonal (November to March) air temperature records, as shown exemplarily for Słubice in Figure 9, even if the inter-annual variability is strong. The warming has impacts on the duration of ice present in the river (duration of ice phenomena, DIP) and the duration of an intact ice cover (duration of ice cover, DIC), as indicated in Figure 10. Generally, there is a decreasing trend in DIC, which is particularly steep in records taken at Słubice. Downward trends were less steep for DIC recorded at Widuchowa and Gozdowice and no trend could be traced for DIP at Słubice. It is to be expected that even if gradual warming is robustly projected for the future [12], ice breaking will need to continue for several decades to come to maintain shipping and prevent ice flooding during ice jam susceptible periods.
Figure 11 shows the locations of ice jams with thicknesses in excess of 1 m that occurred along the lower Oder River in 2009–2018. The figure reveals that most of the ice jamming occurs along the most downstream stretch of the river, the portion that is affected by tides and wind surges from the Baltic Sea.
Future predictions of river flows [13] indicate general increases in mean discharge across Poland, both in the near and far futures (2021–2050 and 2071–2100, respectively). The maps in Figure 12 summarize results obtained from an ensemble of nine bias-corrected EURO-CORDEX (Coordinated Downscaling Experiment—European Domain) simulations. The Oder River is marked as bold in the projection maps. Higher discharges in the future may exasperate ice jamming and ice flooding in the lower reaches of the river.

4.2. Space-Borne Remote Sensing

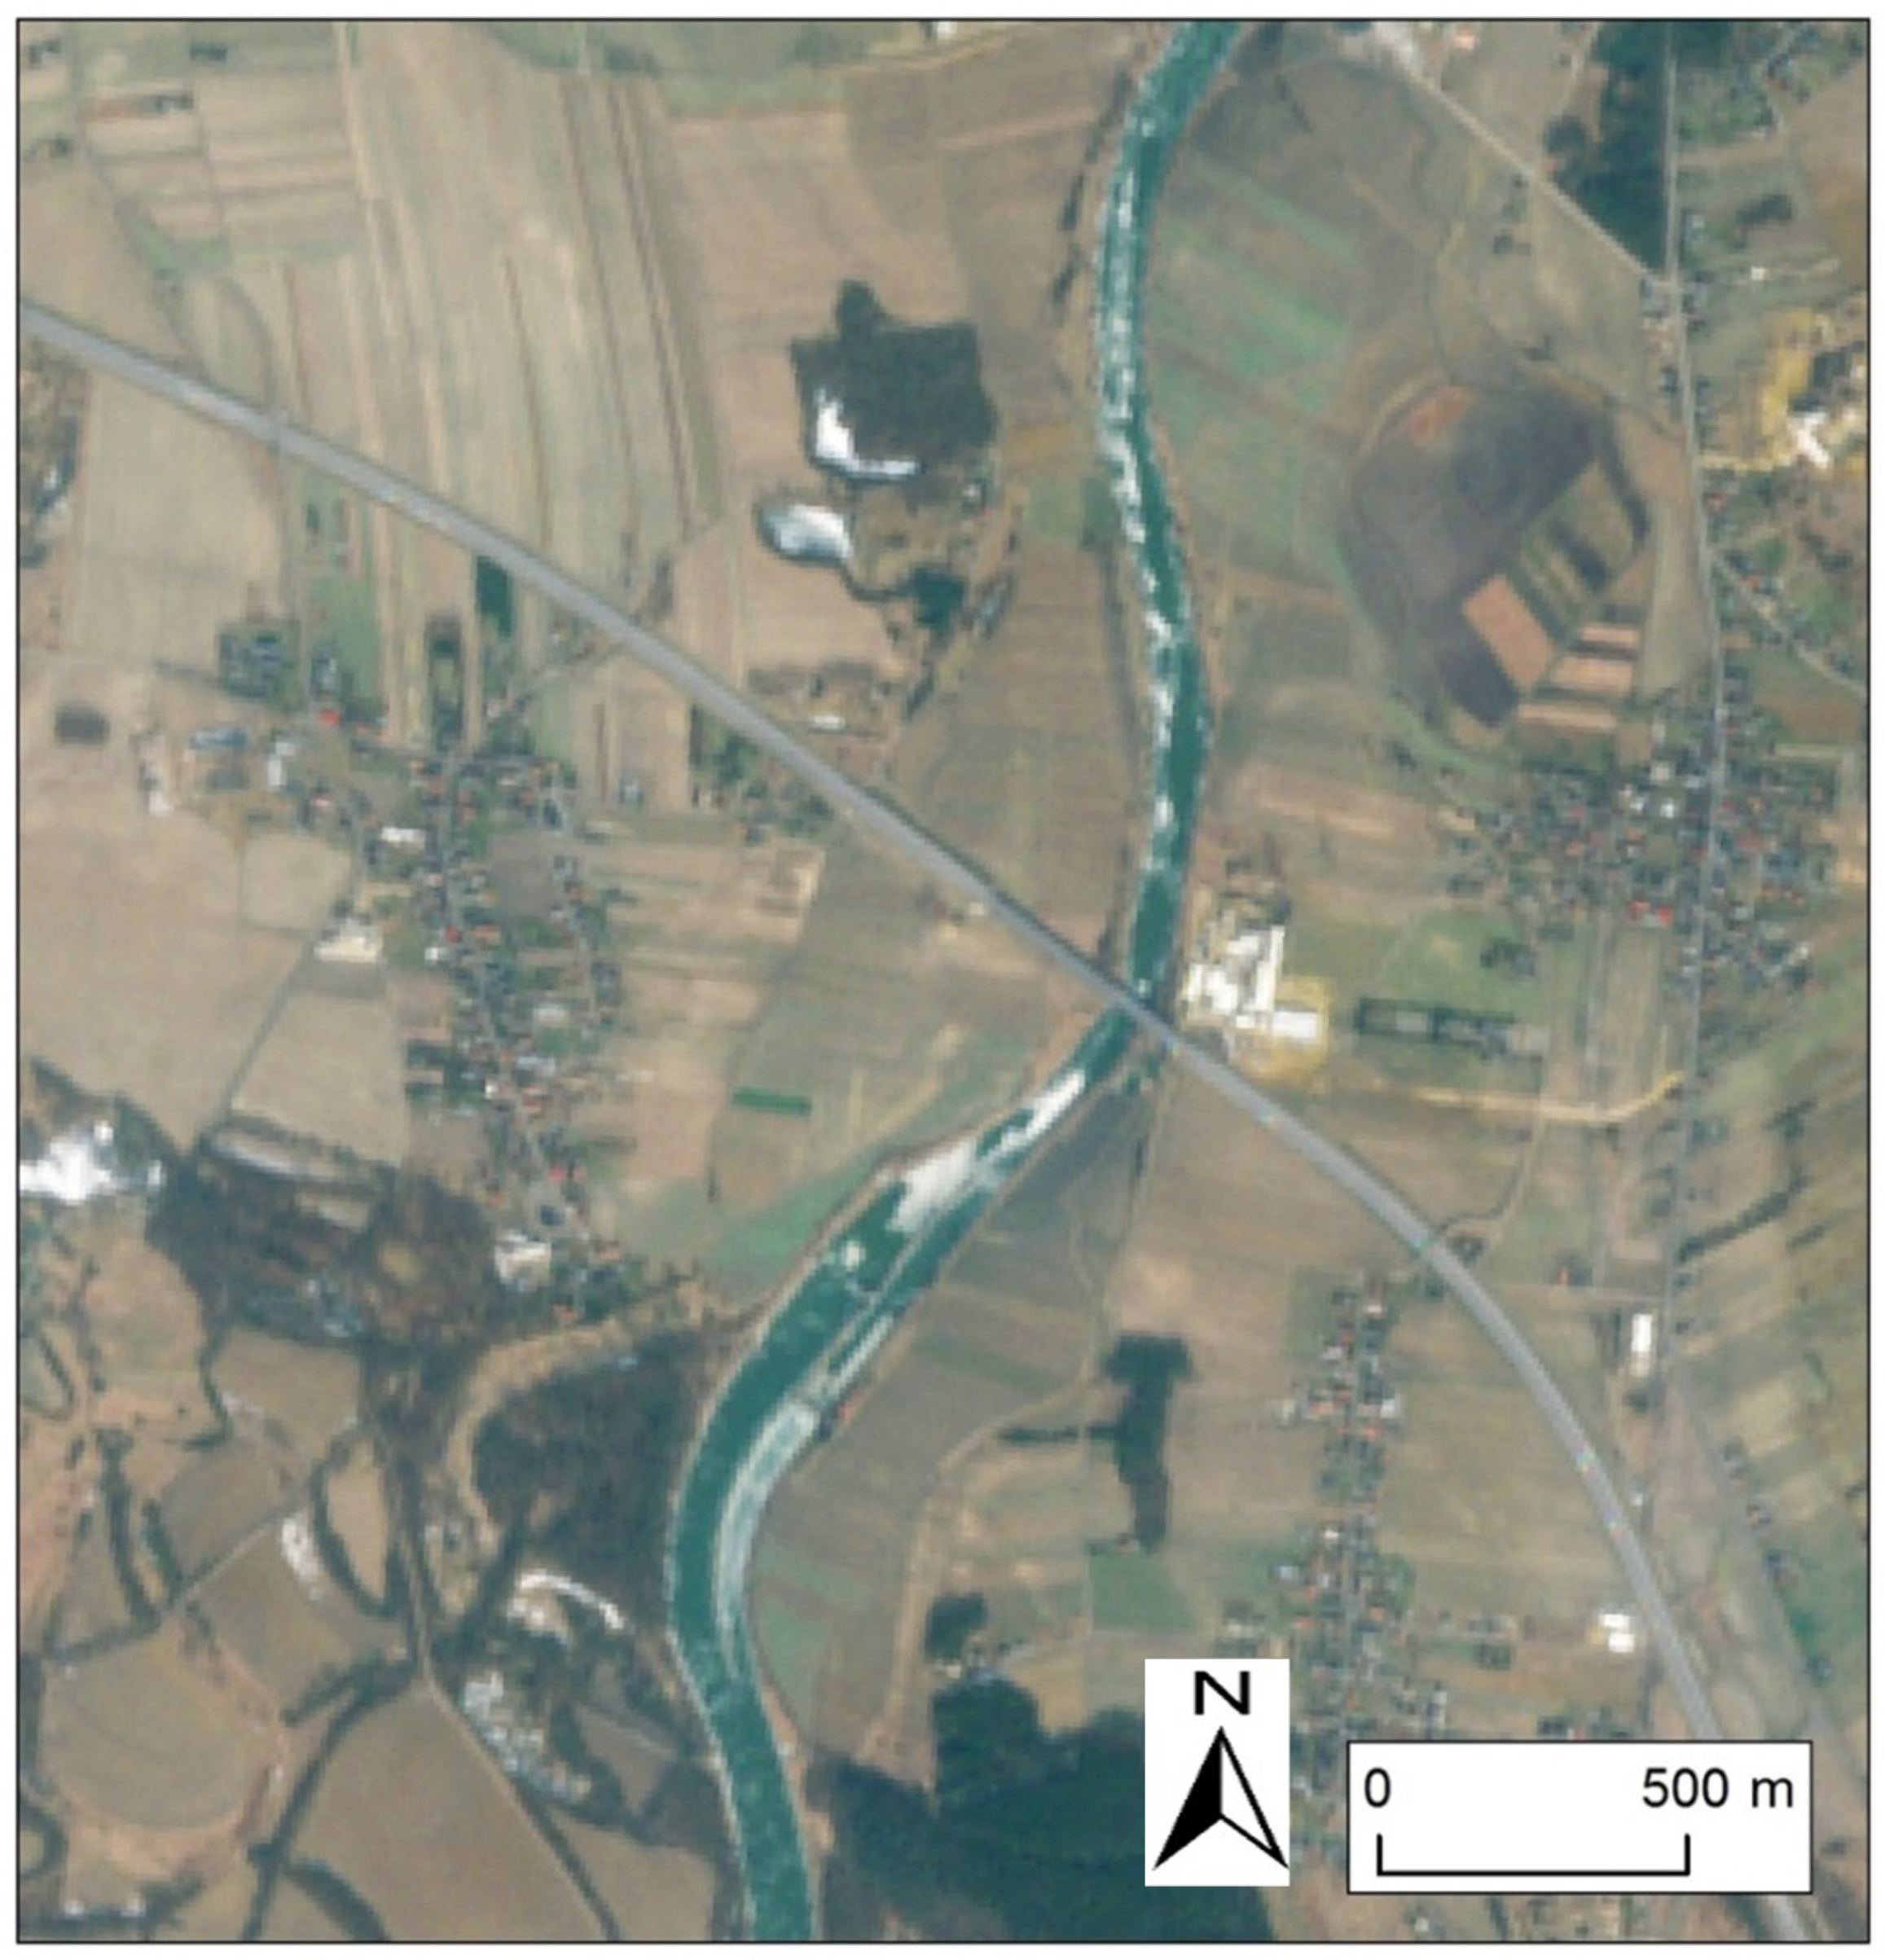
4.2.1. Optical and Thermal Imagery

The use of both Sentinel-2 and Landsat-8 imagery of the Oder River was discussed to determine the feasibility of implementing optical and thermal imagery of the river’s ice cover for ice type detection. Due to the simplicity and small computational effort, the optical imagery constitutes a good source of data for ice jam studies. It is imperative that image download and processing be automated so that the images are suitable for operational hydrology and forecasting tasks. The Sentinel-2 resolution (especially the 10 m bands VIS (visible) and NIR (near infra-red)) is suitable for Oder River monitoring (an example is provided in Figure 13), while the Landsat-8 data (finest resolution = 30 m) could be considered as a supplementary source of imagery. Thermal imagery from Landsat-8 is available at the finest resolution of 100 m and is deemed too coarse to be appropriate for studies of the thermal state of the Oder River. Cloudiness is the main limitation of space-borne optical imagery, especially during winter. For the acquisition of thermal imagery, the use of unmanned aerial vehicles (UAVs), albeit for smaller areas of interest, could be used.

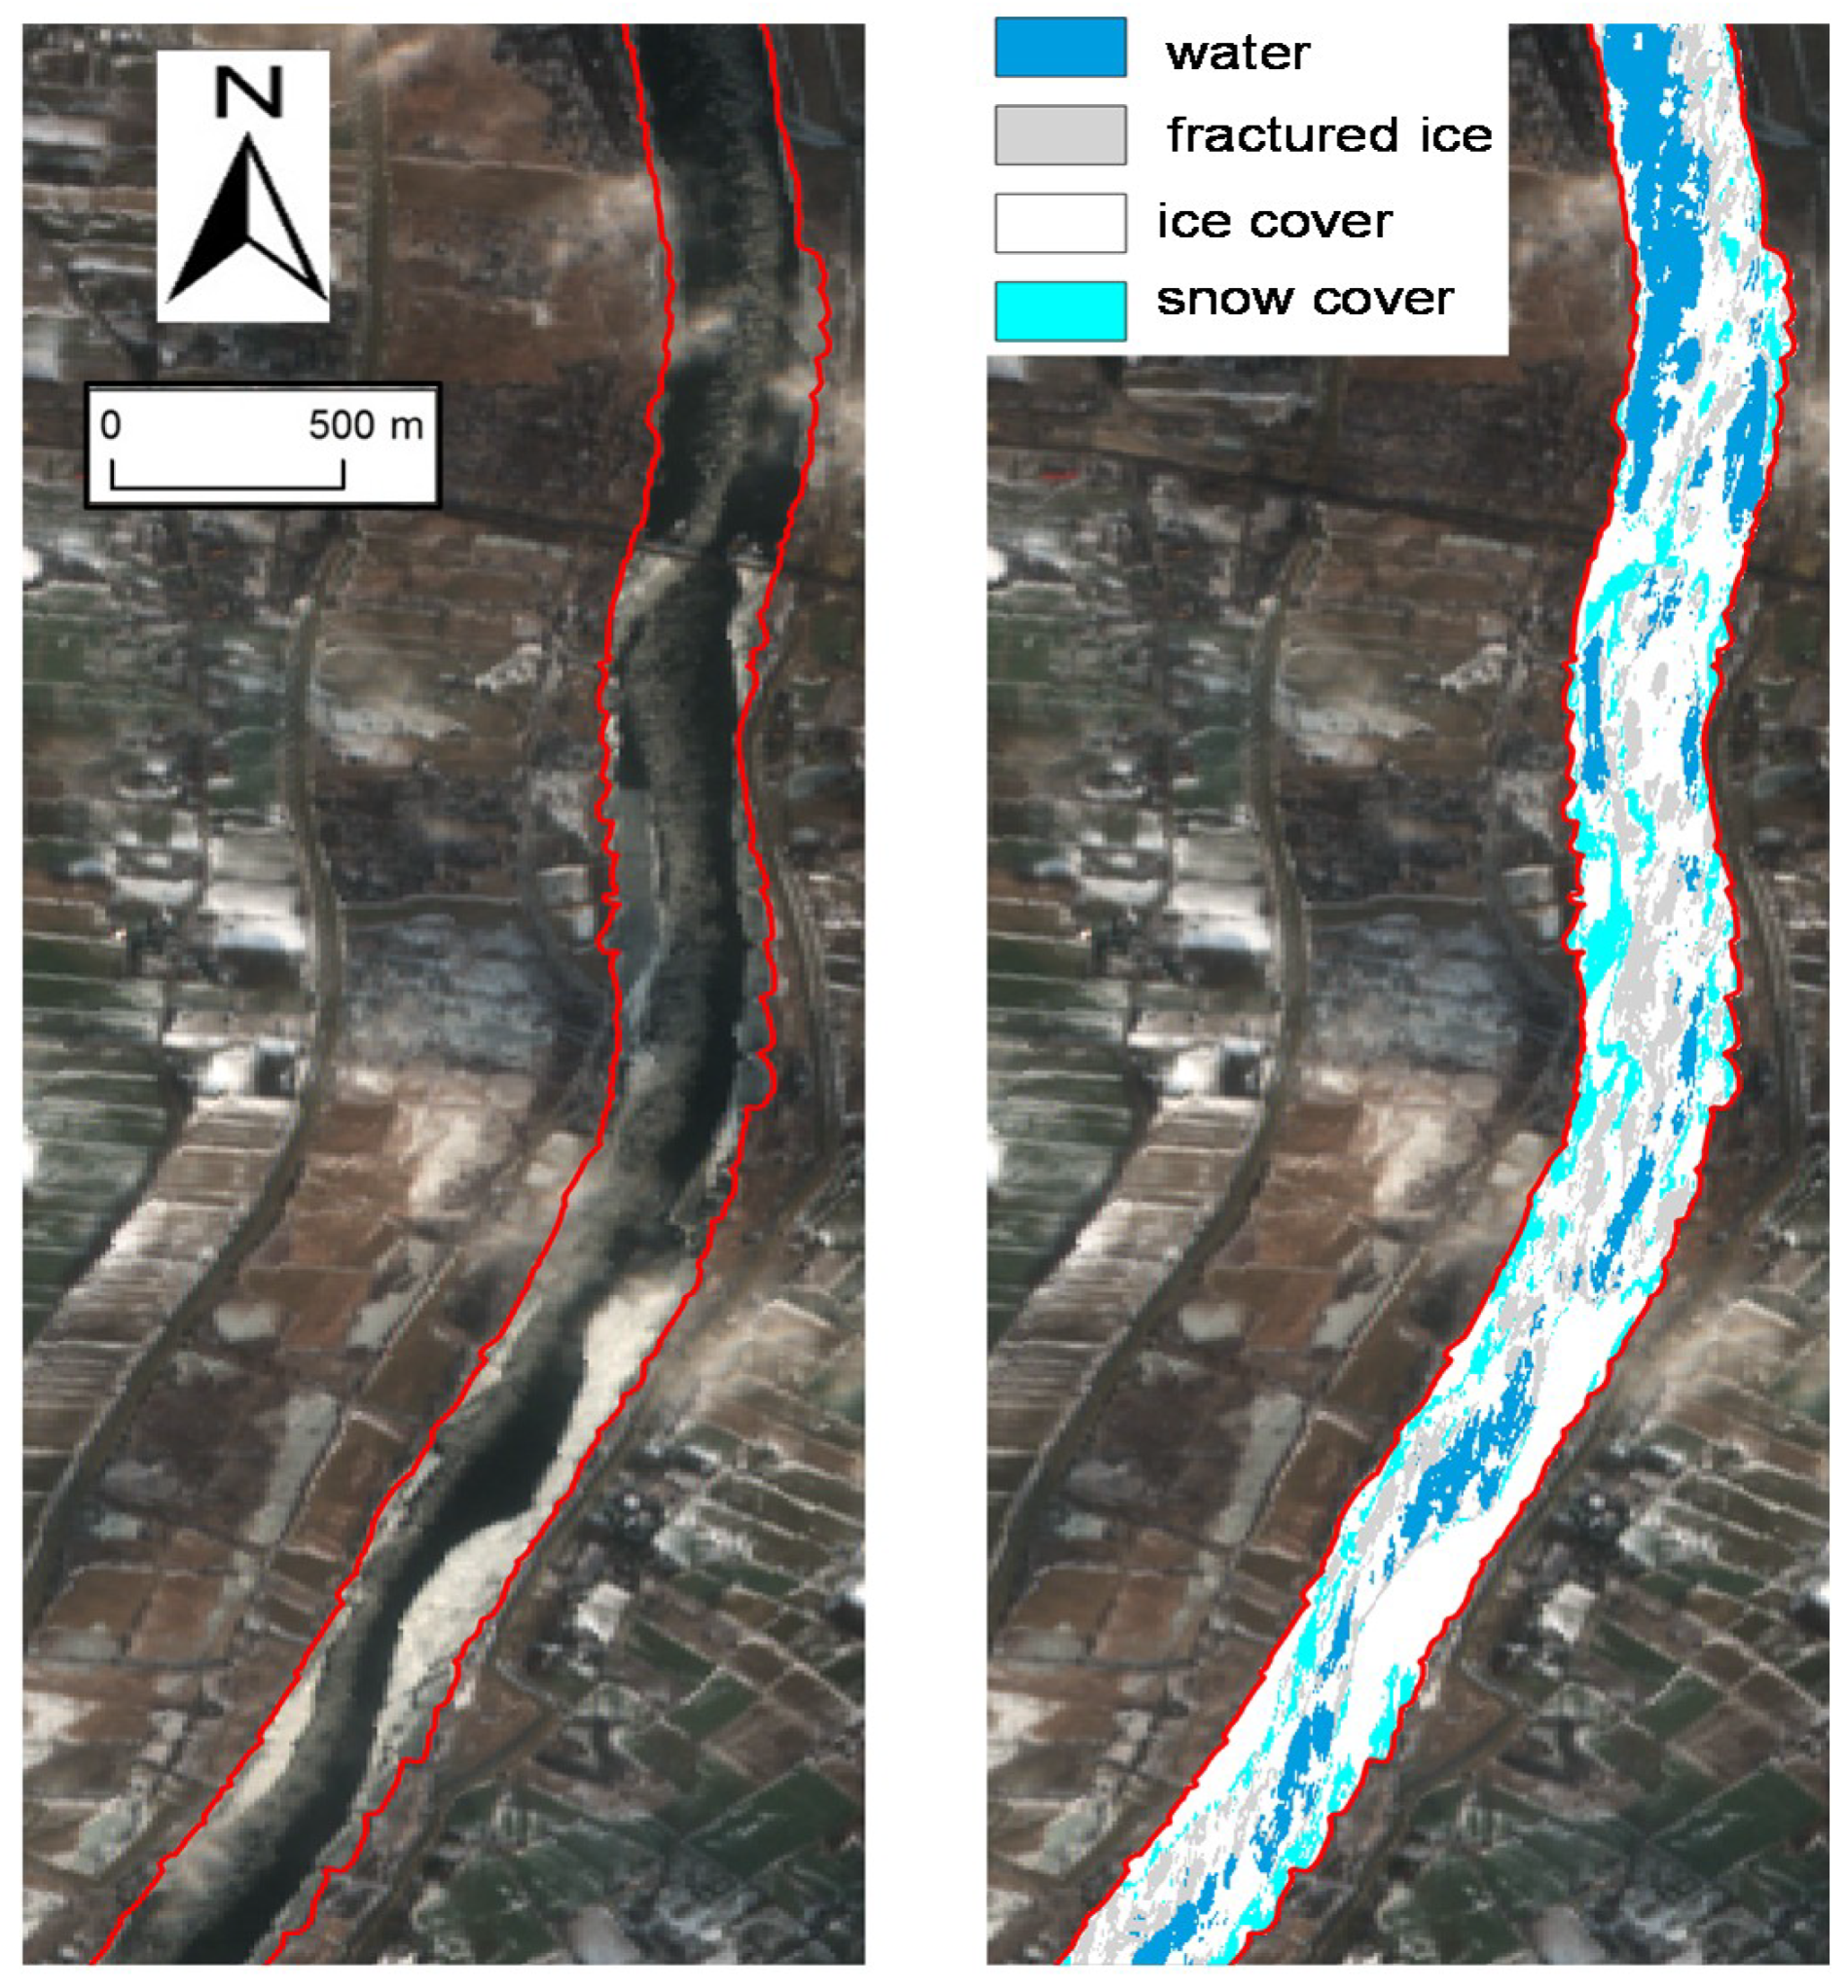
4.2.2. Microwave Imagery

A river ice monitoring service based on satellite data for major Polish rivers, including the Oder River, has been launched on a pilot project scale. The service is set up to support the authorities in Poland responsible for water management by regularly providing continuous information about ice-related events on rivers, thanks to a fully autonomous service equipped with modules for automatic downloading and satellite data processing which is updated within a few hours after acquisition. The detection of ice is based on images acquired by the European Space Agency’s Sentinel-1A and Sentinel-1B microwave satellites. The application of Sentinel radar sensors allows imagery to be collected every 2–7 days, independent of weather conditions (excluding intensive storms and snow falls), and processed in near real time. Microwave return signals from snow (including snow layers on ice), ice and water are distinguishable as long as the ice is not covered with a thick layer of stable water or wet snow or does not consist of smooth, thermal ice, which is typical for lakes. The data can be classified into four coverage types within the river (including water) which are available through the map portal. An example of classification results is shown in Figure 14:
  • Water—river free of ice phenomena;
  • Fractured ice—floe or frazil ice floating and free flowing;
  • Solid ice cover—ice cover not covered with snow, also sections of the river covered with dense frazil ice or densely arranged floes;
  • Ice cover by snow—areas of the river bed giving a very strong reflection of radiation in both the visible and low backscattering in the microwave portion of the spectrum.
In addition to Sentinel-1, data acquired from other microwave satellite sensors were also investigated in other applications to test their feasibility in detecting and characterizing ice along the Oder River. These include the German TerraSAR-X (X-band) and the Canadian RADARSAT-2 (C-band) sensors. Significant differences were not found in distinguishing ice types between X-band and C-band data. An important difference between the capabilities of the two sensors is RADARSAT-2 is able to acquire data in quad-pol and dual-pol, whereas TerraSAR-X data are usually acquired only in dual-pol or single-pol [14]. However, quad-pol data did not significantly improve classification results compared to dual-pol data. Characteristics of three microwave sensors, TerraSAR-X (the German Aerospace Center (DLR) headquarters, Cologne, Germany), RADARSAT-2 (MacDonald, Dettwiler and Associates headquarters, Richmond, BC, Canada) and Sentinel-1 (operated by the European Space Agency with headquarters in Paris, France), are provided in Table 1. Imagery acquired by RADARSAT-2 have also been applied for mapping floods caused by ice jams along the Oder River in January 2011. Derived map products are available at the website of the Center for Satellite based Crisis Information (ZKI): https://activations.zki.dlr.de/en/activations/items/ACT094.html.

4.3. River Discharge and Flood Extent Forecasting

4.3.1. Hydrological Modelling

The flood forecasting system HydroProg, developed at the University of Wrocław, was introduced as an option to forecast flows for the upper basin of the Oder River. Such flows would be imperative to predict ice cover buildup and ice jamming further downstream along the lower Oder River. HydroProg produces early warnings of high flows and flood waters and operates in real time, integrating data from a network of hydro-meteorological gauging stations and numerous hydrologic models. Data quality control is automated and interpolates missing or incorrect data on the fly. The system produces ensembles of multi-model hydrograph predictions, an example of which is provided in Figure 15. An important output in real time is flood maps that are created from the hydrodynamic modelling component of the system [15]. An important novelty for the validation of flood predictions is the use of unmanned aerial vehicles (UAVs) to compare observed flood extents with model simulations [15]. More details on the system itself can be obtained from [16] and [17] which are demonstrated for Kłodzko Land, Poland at http://www.klodzko.hydroprog.uni.wroc.pl.

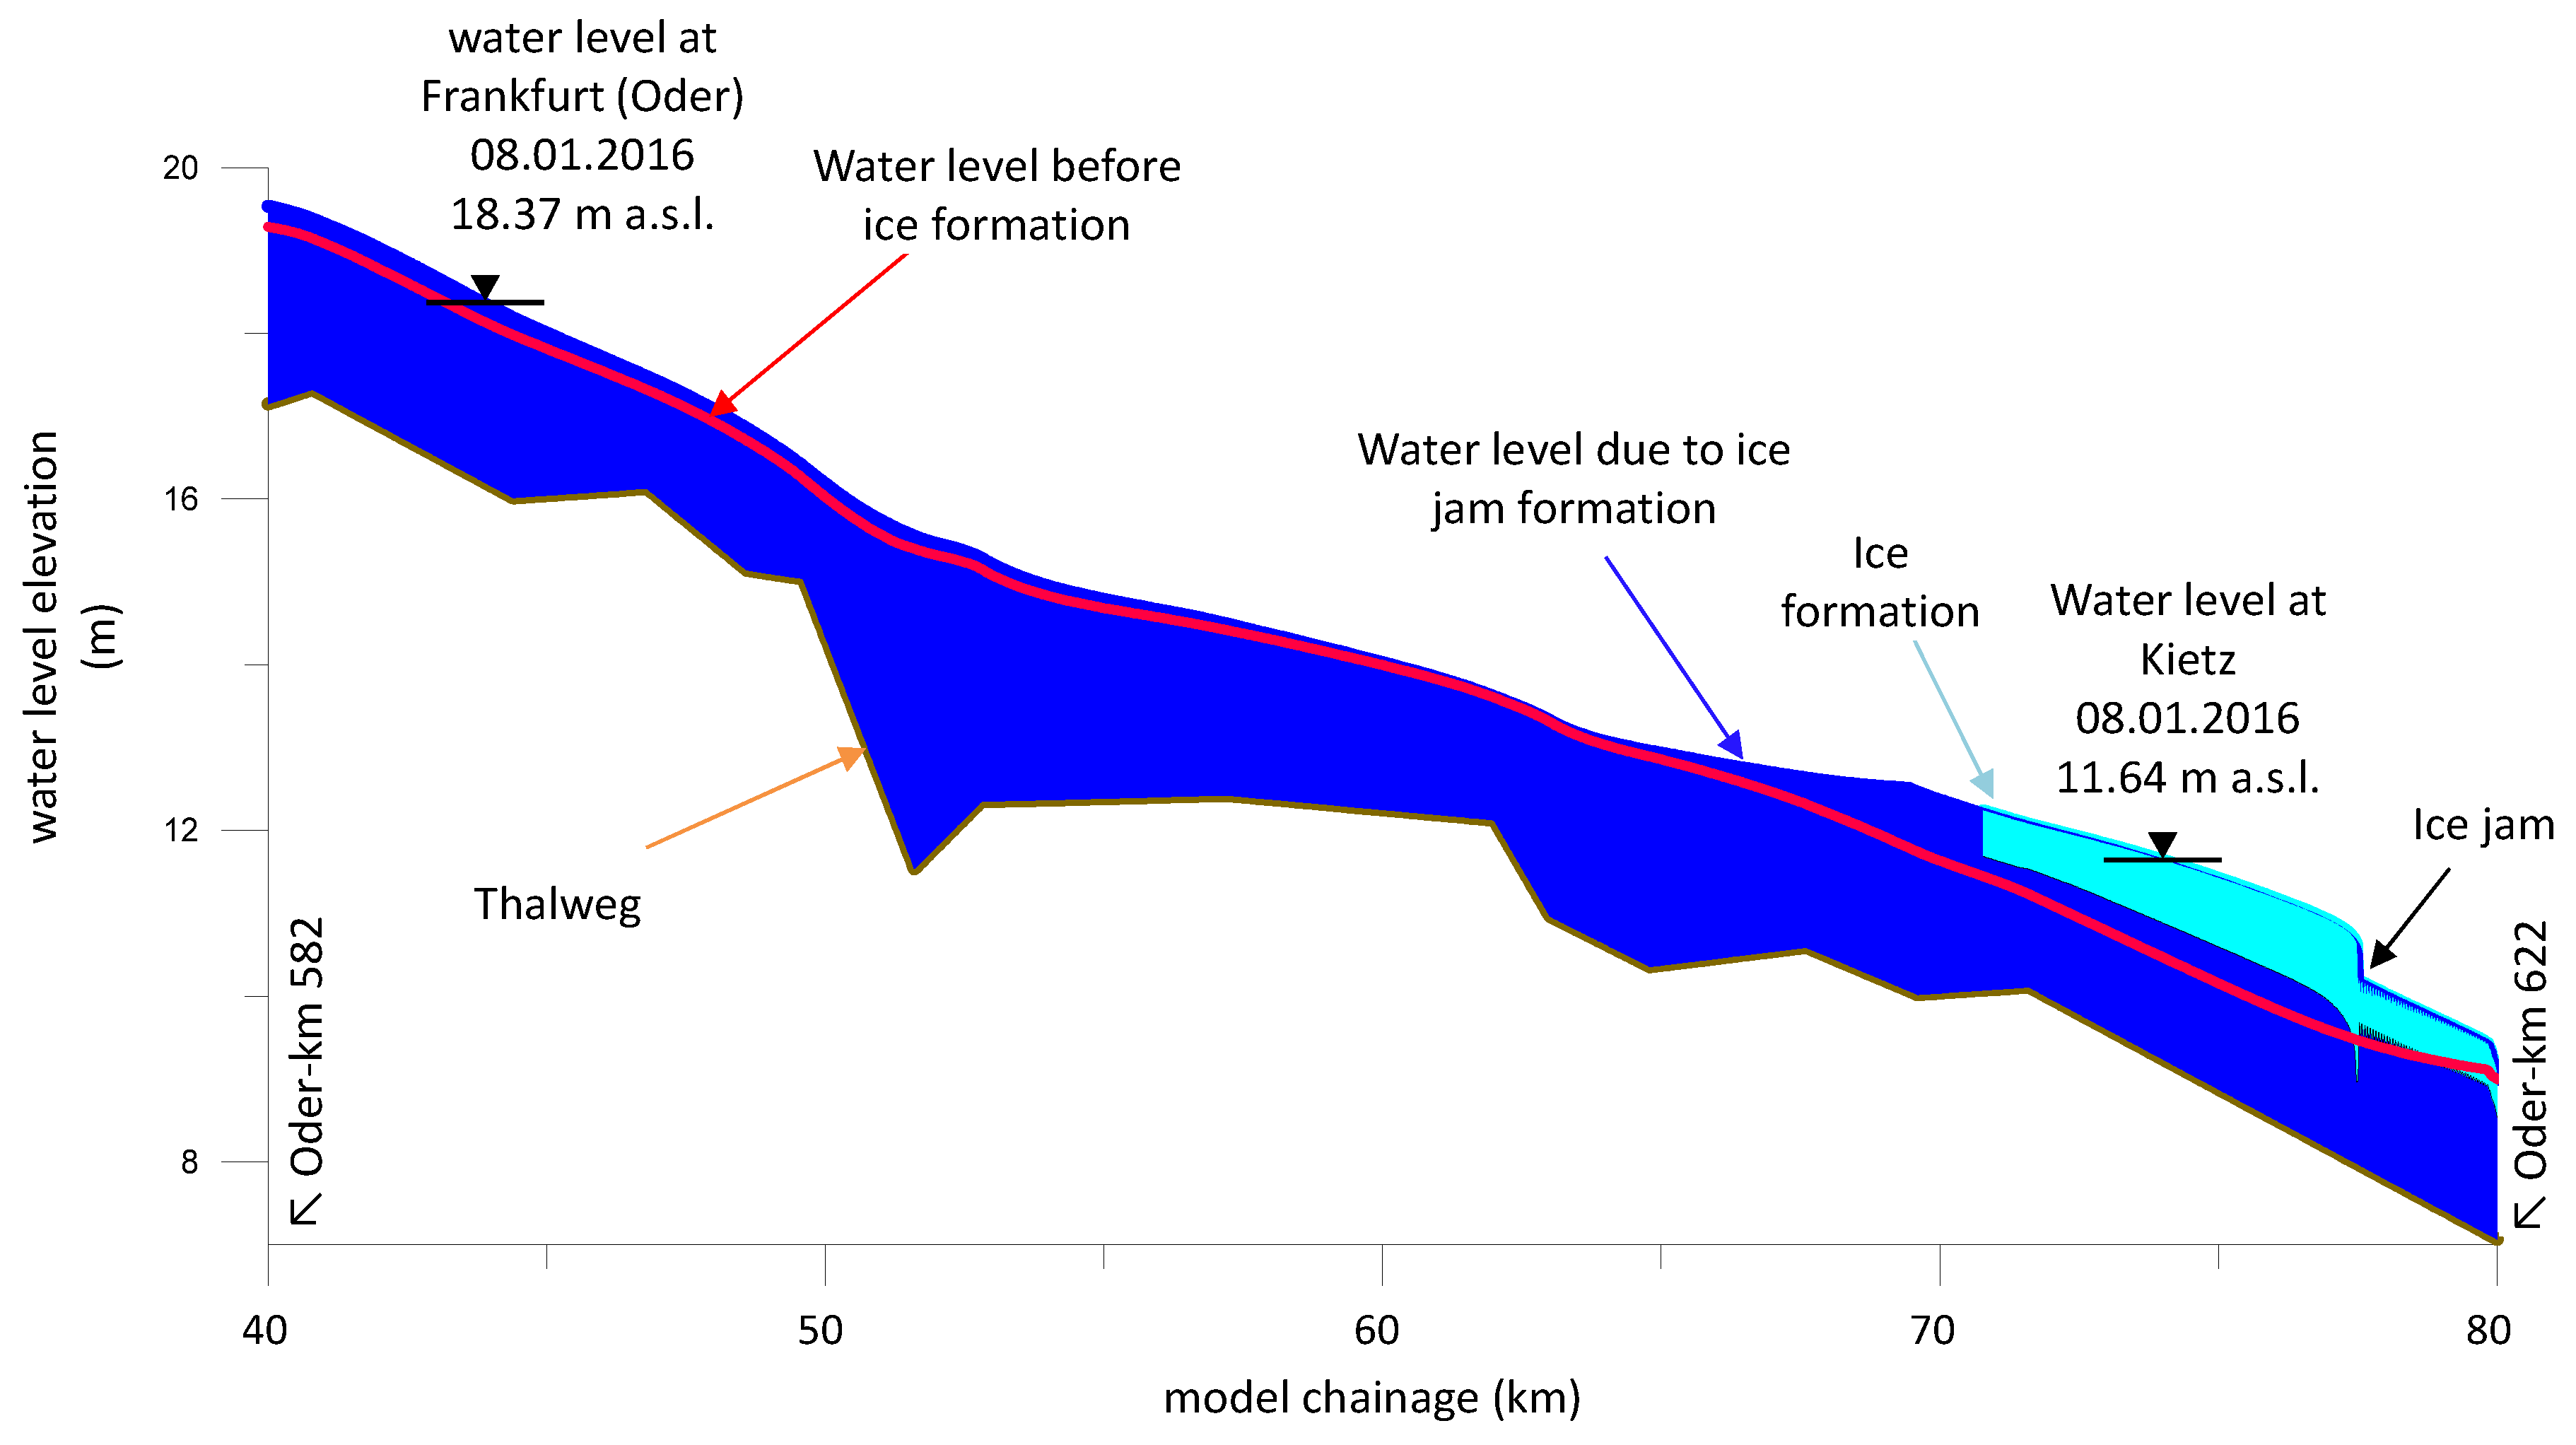
4.3.2. Hydrodynamic and River Ice Modelling

An ice jam that occurred near Kietz in January 2016 was successfully modelled with the deterministic river ice model RIVICE [18]. RIVICE is a one-dimensional hydrodynamic model that can simulate many ice processes such as frazil ice generation, border ice formation, anchor ice emergence, ice cover juxtapositioning, ice cover shoving/telescoping, ice jamming and hanging dam formation. Further details on the model’s algorithms are provided in [19]. The model has been successfully implemented for many rivers, both for freeze-up and breakup ice jams, but mostly in a Canadian setting. The Oder River stretch modelled with RIVICE extended from Ratzdorf downstream past Kietz. Flows recorded at Eisenhüttenstadt served as an upstream boundary condition. Water level elevations measured at Frankfurt/Oder and Kietz provided data for model calibration. A longitudinal profile of the ice cover and backwater levels from the ice jam are shown in Figure 16. The underestimated water level simulations due to the absence of spur dikes in the cross-sections used to set up the model was compensated for by forcing border ice formation along the river banks.

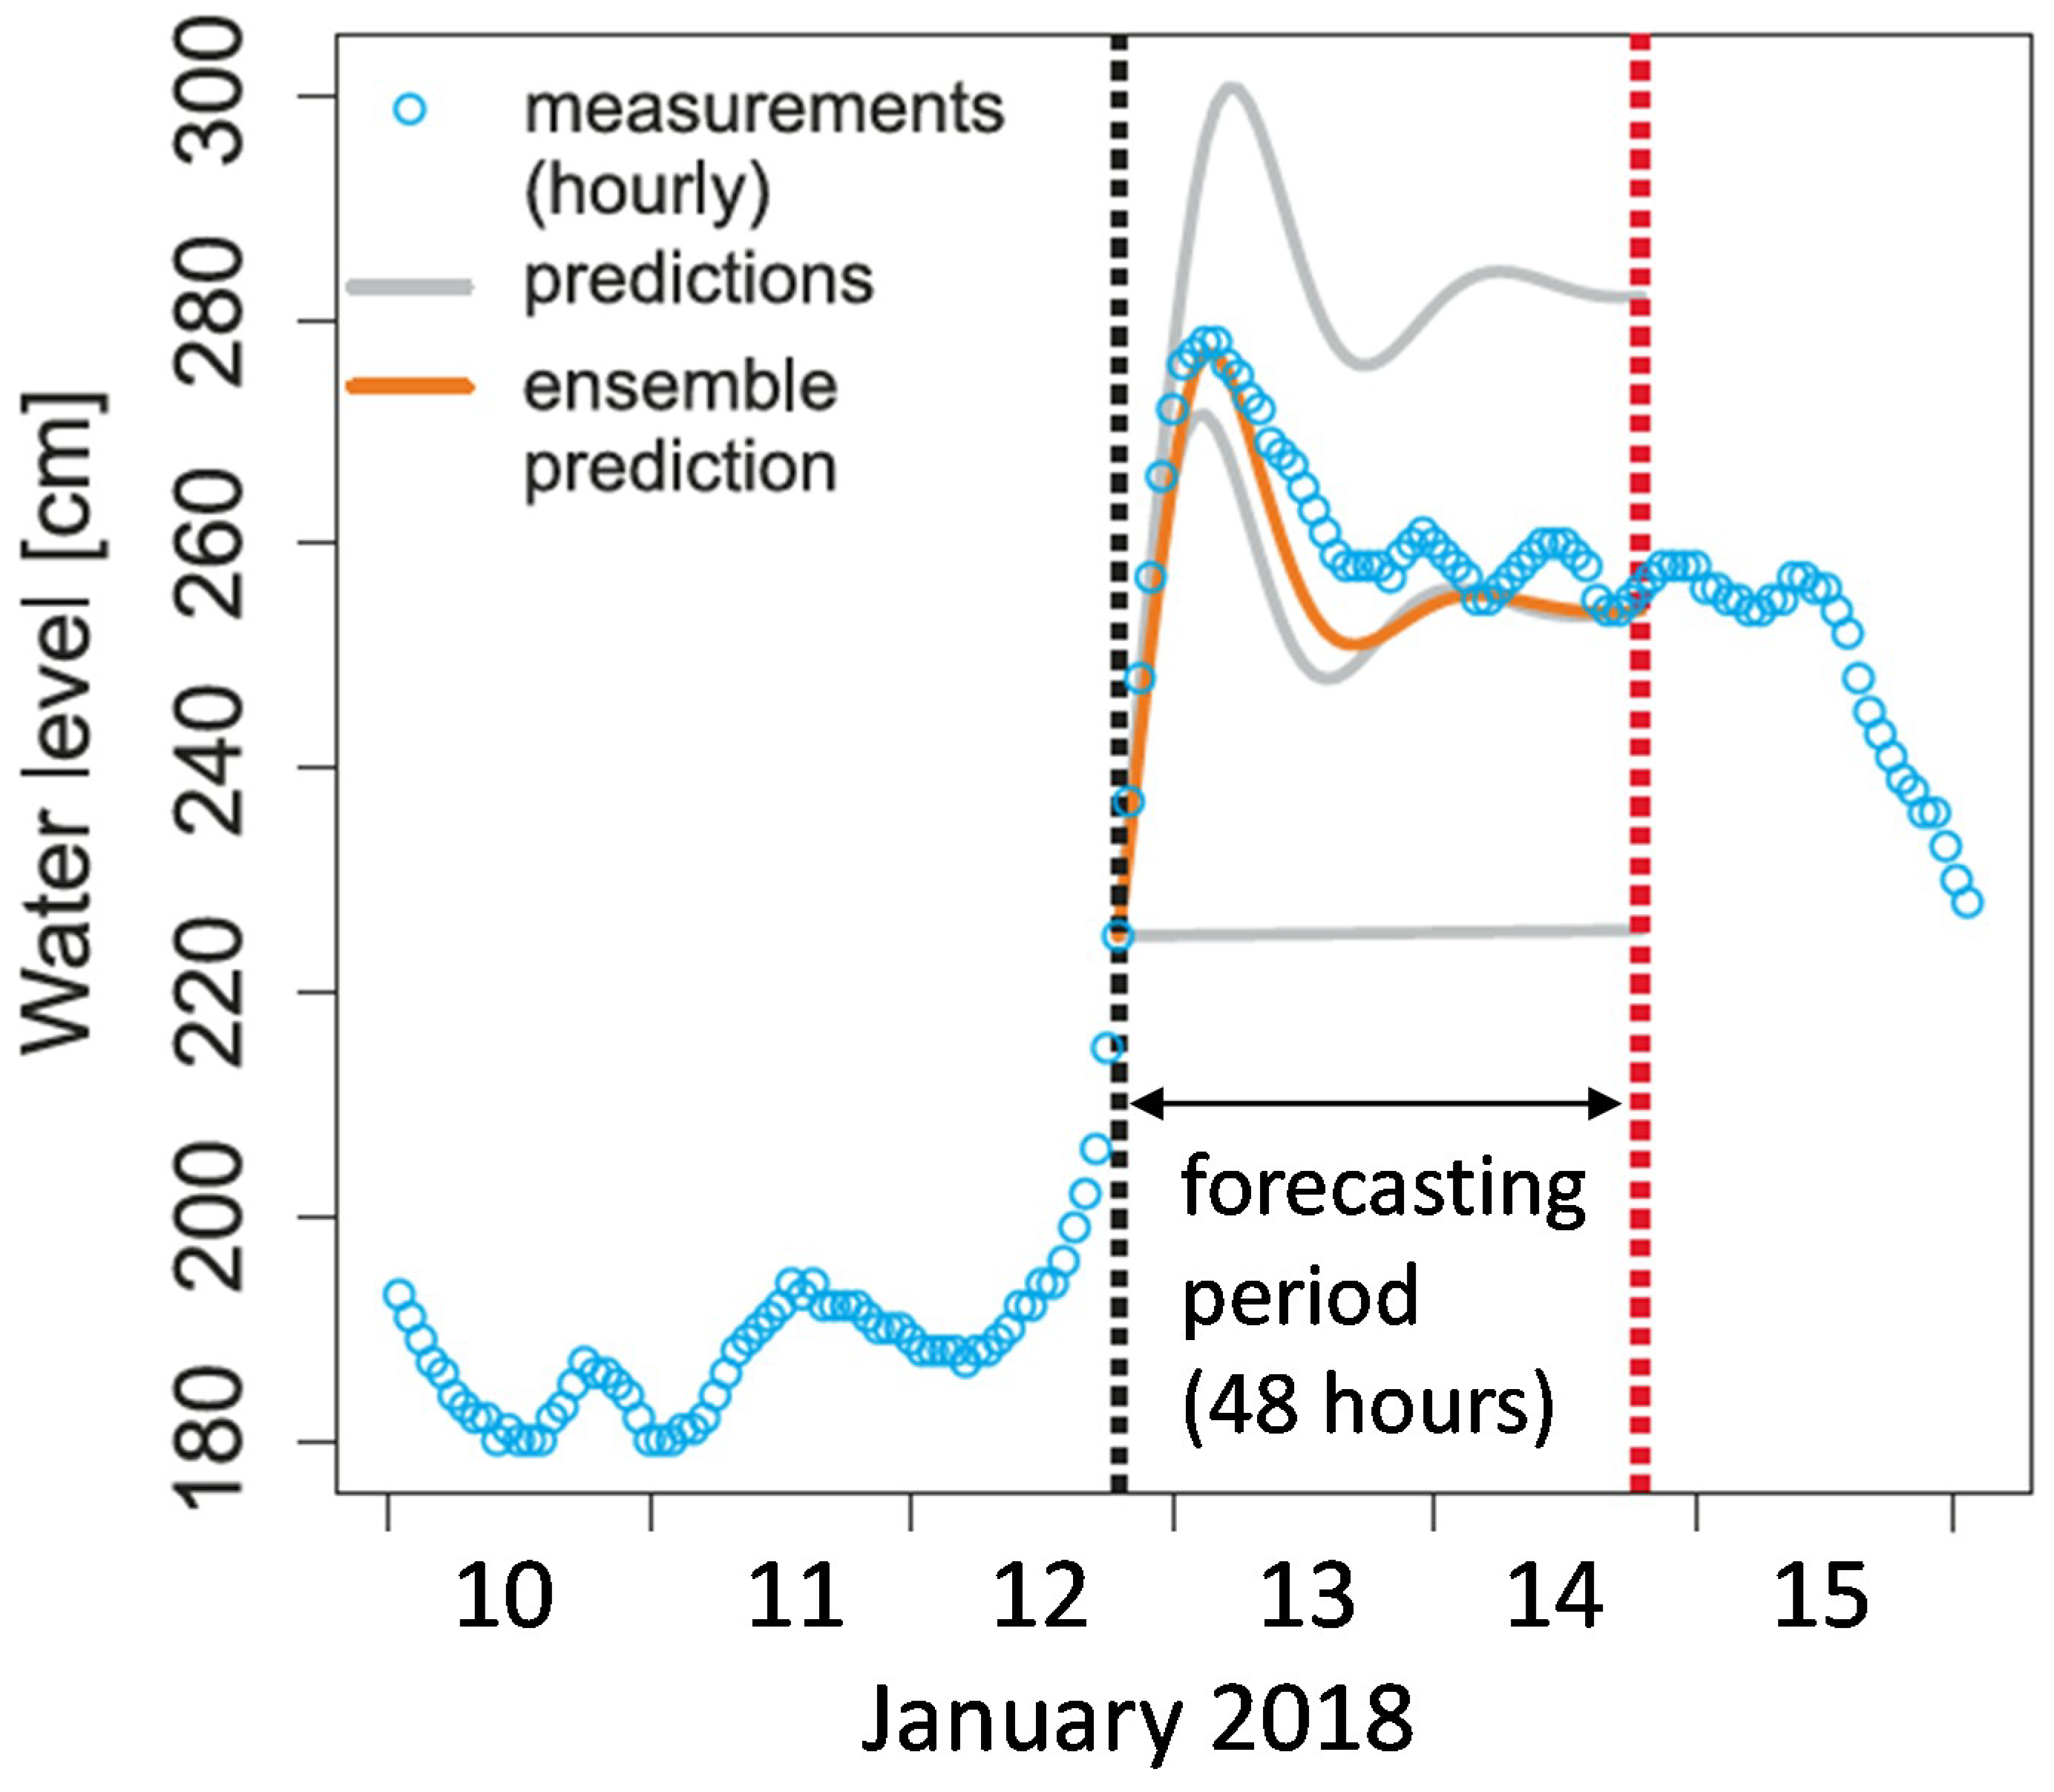
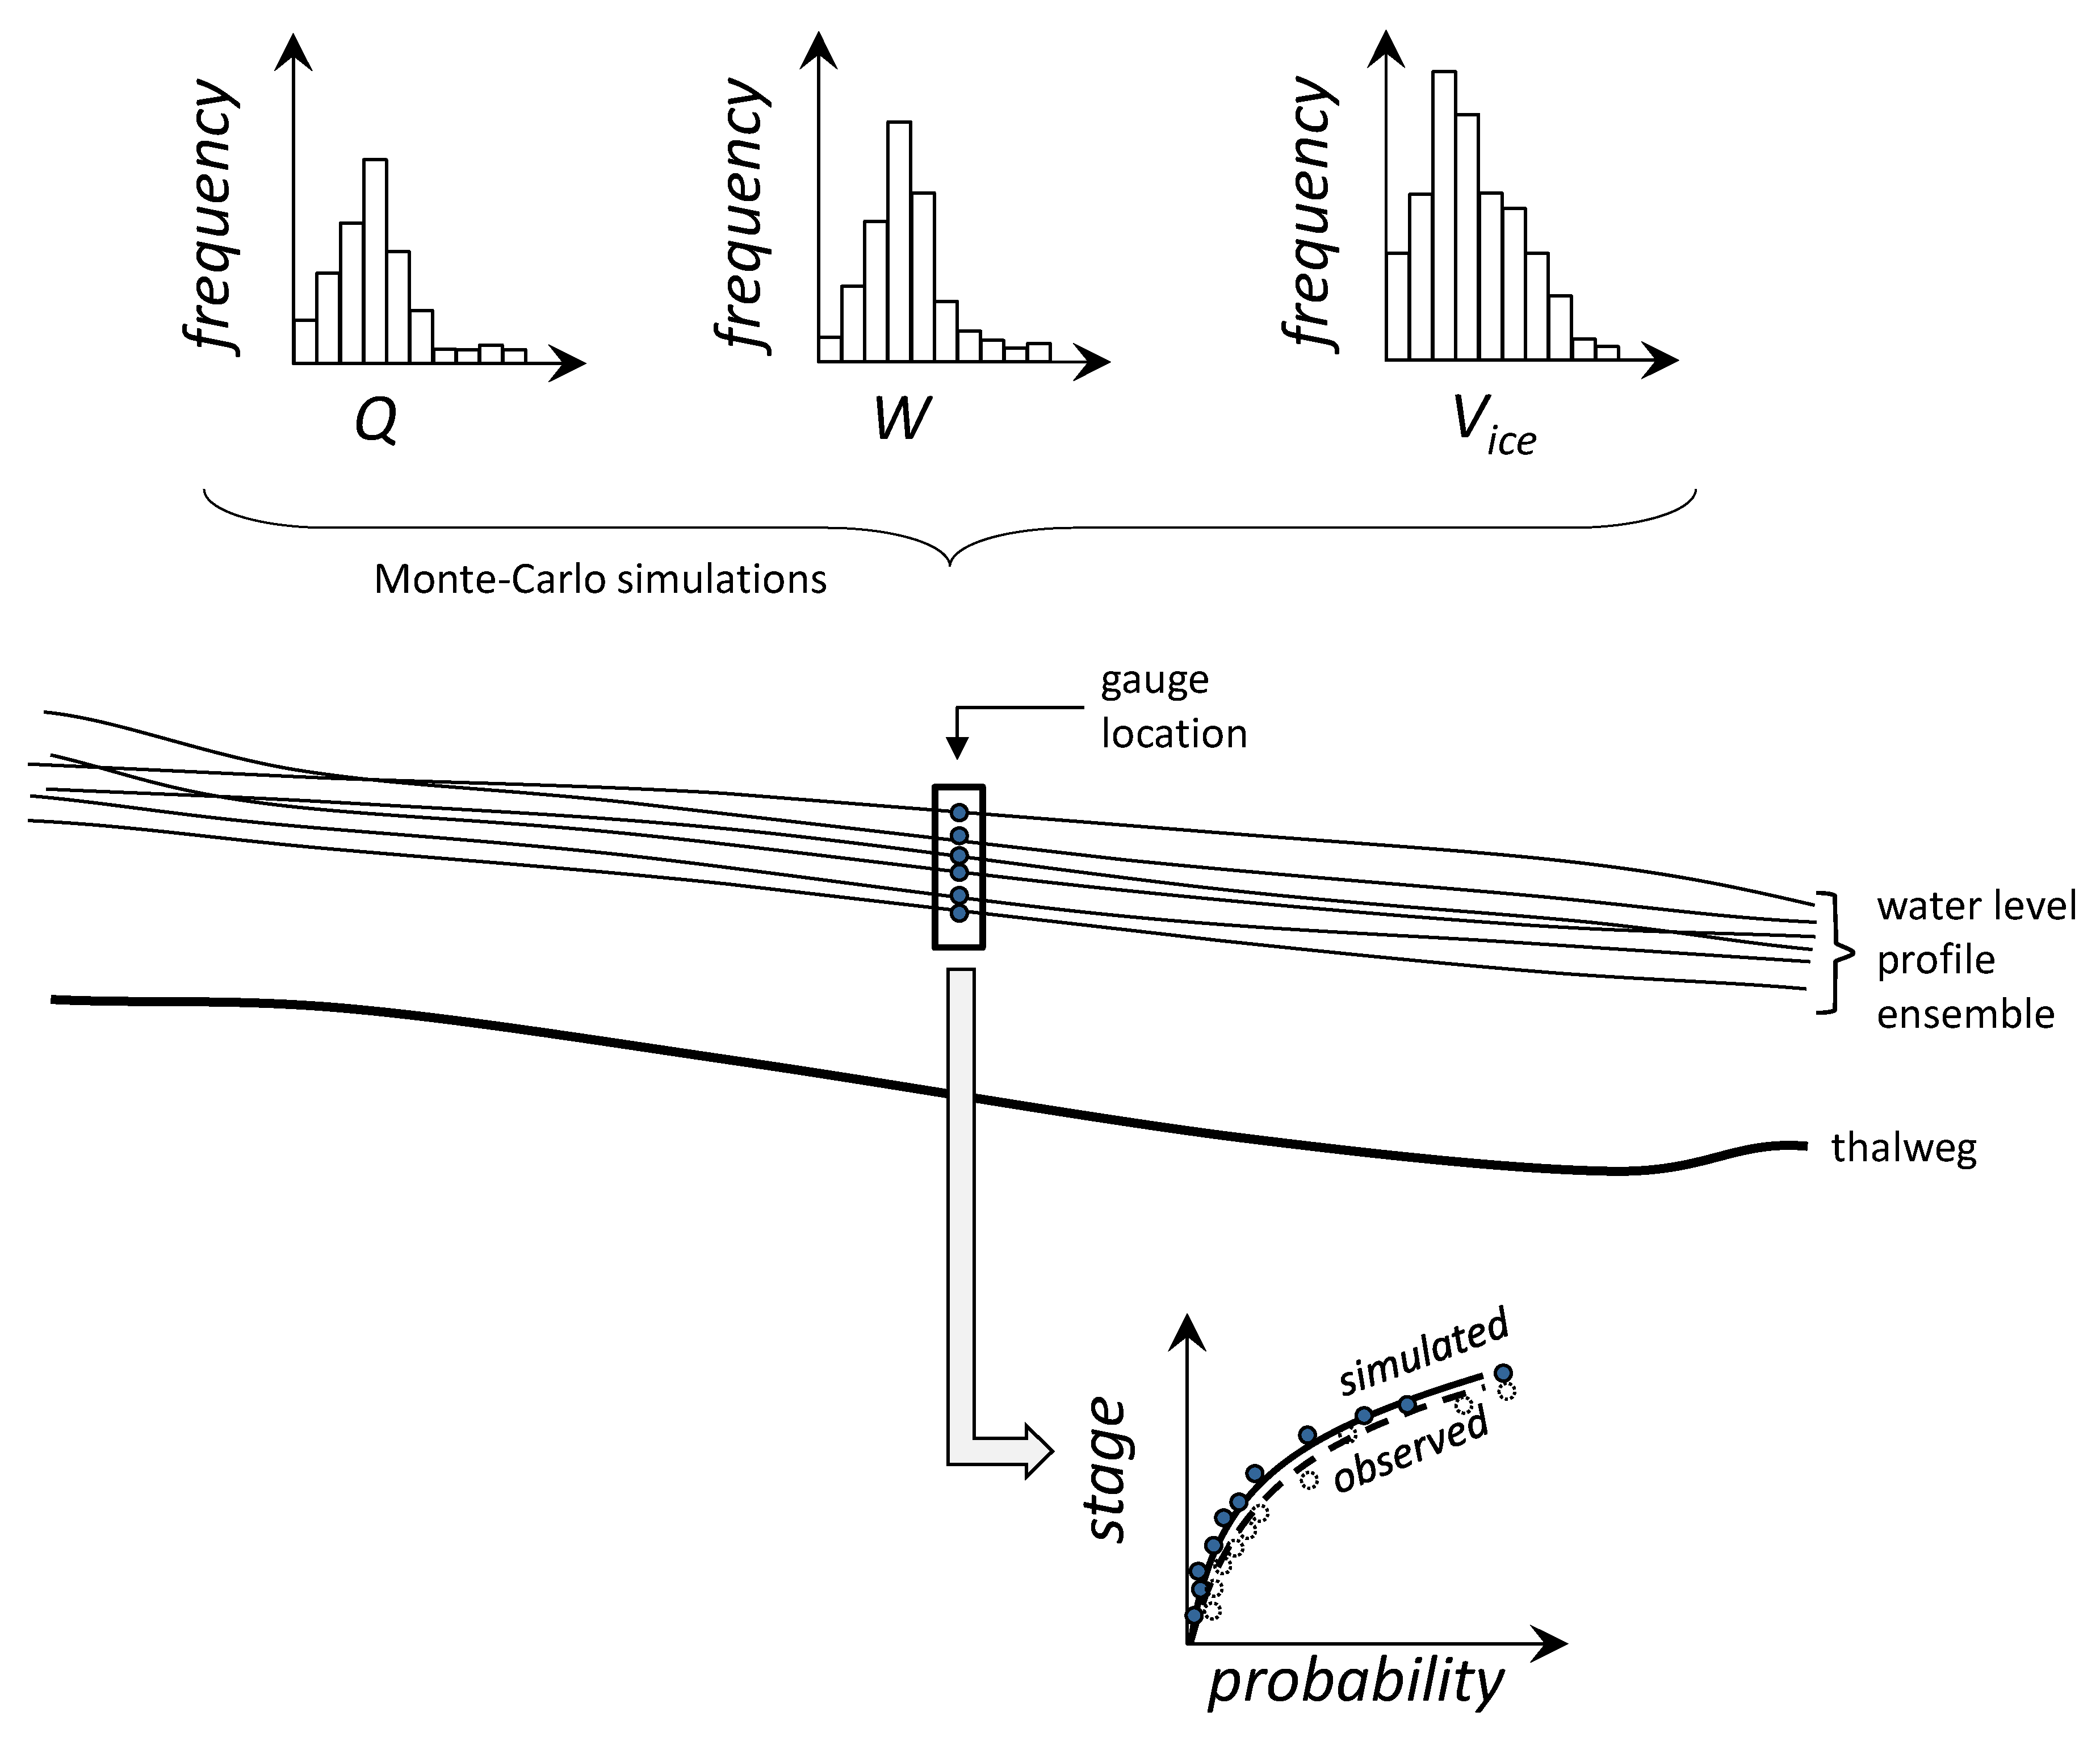
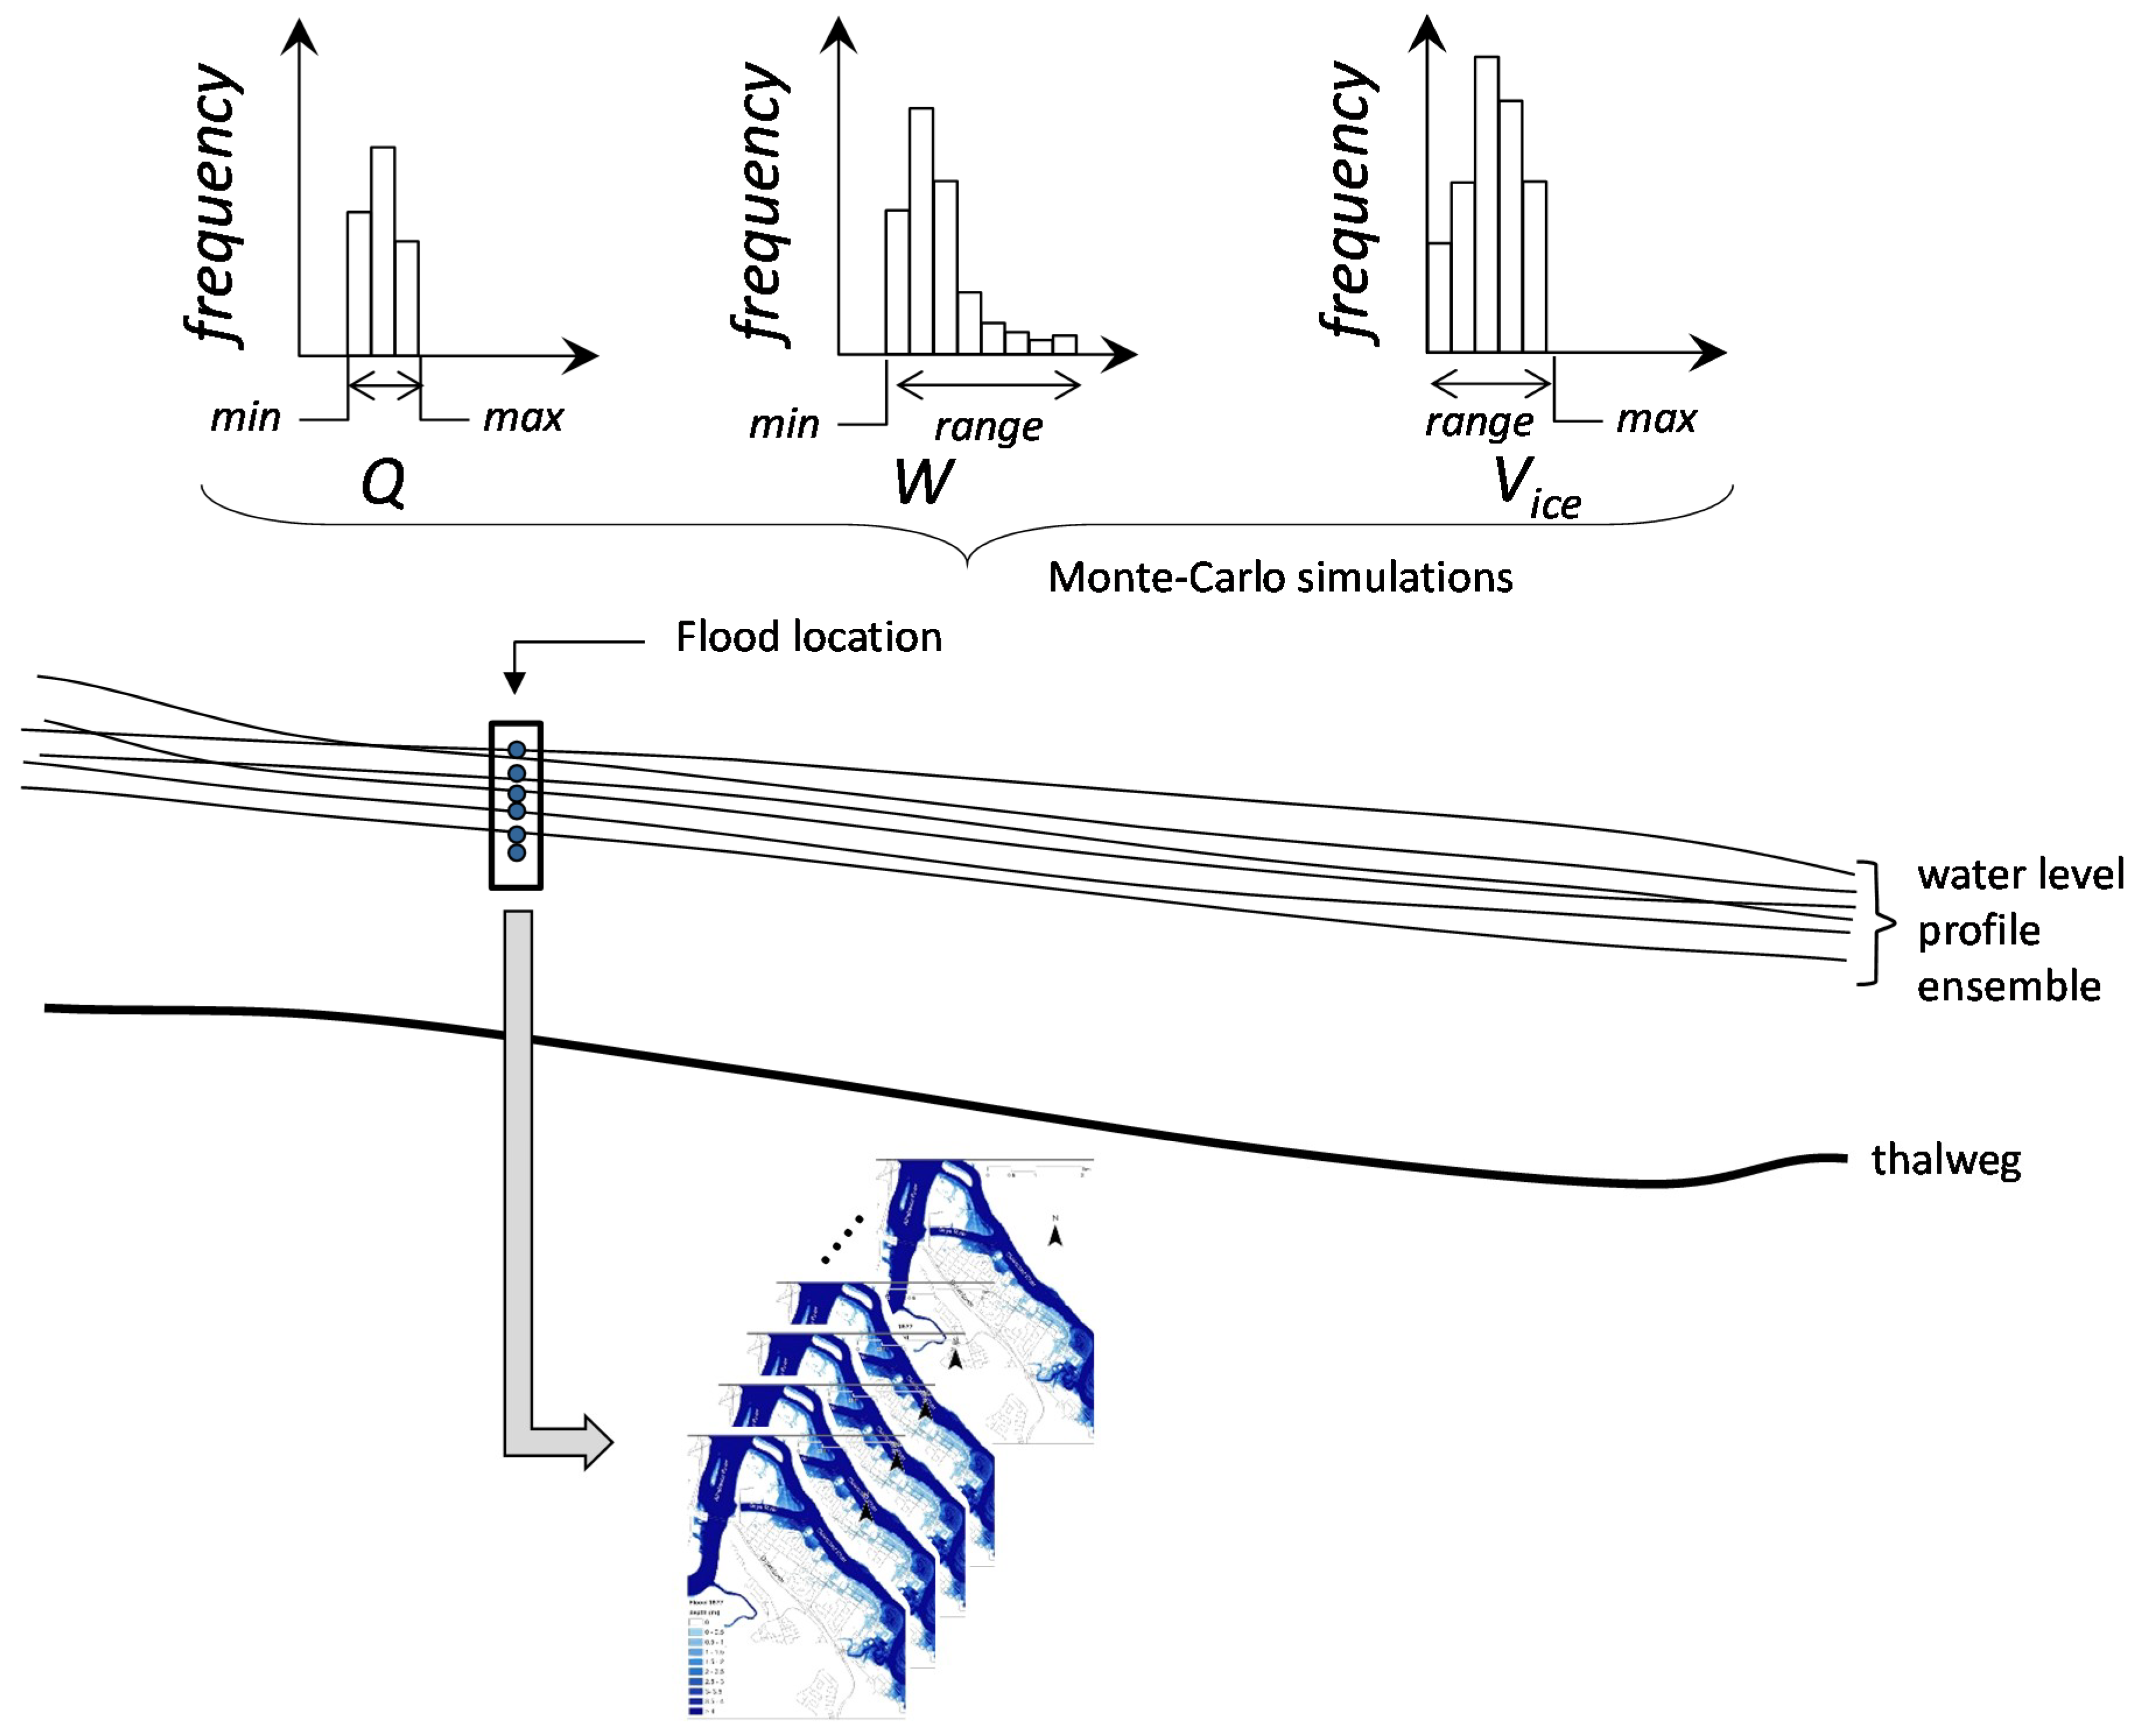
4.3.3. Stochastic Modelling

Once a RIVICE model has been set up and calibrated for a river stretch, the model can be embedded in a Monte-Carlo framework to determine extreme value distributions of the volume of ice, Vice, required to form jams along the model domain (see Figure 17). Input to the framework includes extreme value distributions of the boundary conditions, respectively the upstream and downstream boundaries of the domain. In a forecasting context (see Figure 18), these distributions can be constrained according to the hydraulic and ice conditions before imminent ice jamming occurs. The ensembles created from the Monte-Carlo simulations allow the exceedance probabilities of staging and flood extent to be calculated. The stage exceedance probabilities can match up to the stage levels of the flood warning system already in place for the Oder River. Further details on the ice jam flood forecasting methodology can be obtained from [20].

4.4. Designing River Modifications to Reduce Probabilities of Ice Jamming

During cold spells in the winter months, a lot of ice can be generated along the lower reach of the Oder River. As soon as warmer air temperatures provide some relief from the cold snap, both German and Polish ice breakers are placed in operation to break up the ice cover and prevent ice jamming and subsequent flooding from occurring. The ice breakers work their way upstream from the Szczecin Estuary so that broken ice can float downstream into the estuary without becoming a threat to jam elsewhere along the course of the river. A precarious situation often evolves at the fork where the Oder River branches off into two rivers at Widuchowa, the Western and the Eastern Oder branches. There is a weir in the Western Oder near the branch. The branching redistributes flows within an area that is very flat and low sloping and is predisposed to jamming of ice floes released by ice breakers upstream of the fork. A physical model was implemented to determine optimal conditions of the flow and ice regimes to avoid jamming at this location. The model was built and operated by the Federal Waterways Engineering and Research Institute (BAW) in Karlsruhe, Germany. Figure 19 shows the setup of the physical model scaled down 1:150 (horizontal) and 1:30 (vertical) using plastic for the scaled ice floes. At various discharges, flow velocities of water and ice were measured and analyzed using photogrammetry. The artificial ice floes were able to mimic ice jamming at the forks, whose probability could be shown to reduce significantly when more water is diverted into the Western branch of the Oder River. More detailed information is provided in [21].

5. A Way Forward

The workshop in Wrocław was successful in providing a venue where scientists, government officials and water managers from Poland, Germany and Canada could come together (see Figure 20 for a photo of the participants) to highlight ice issues along the Oder River and determine requirements for a path forward to develop and implement ice jam flood forecasting capabilities for this river.
There are many future climatic conditions that may counter each other, so it is difficult to foresee how the frequency and severity of ice jam events may change in a future climate. For instance, on the one hand, it was shown that the mean air temperature will potentially increase in the future, reducing the duration times of ice phenomena present and intact ice cover forming on the Oder River. On the other hand, more extreme precipitation events in the headwaters of the Oder River catchment could supply higher discharges to exacerbate ice jamming and staging. Hence, it is vital that numerical capabilities be extended so that scenarios with future climatic conditions can be run to determine how ice behavior and characteristics may change along the Oder River.
An evolution of numerical methods is required for the Oder River to progressively develop predictive capabilities of the ice processes in the river for management and forecasting tasks. As a start, simple empirical relationships should be explored to determine correlations that may persist between morphological and phenological factors of the ice, hydraulic and geomorphological factors of the river and meteorological factors. Some empirical attempts have been made to develop forecasting methods by White [6,7]; these methods can be drawn upon for the Oder River, remembering that the empirical relationships may be very site-specific.
Although the location of ice jam occurrences may appear quite random, hot spots are present along the Oder River with higher affinities for ice jam formation. Forecasting the locations of ice jam occurrences is difficult to carry out due to the complexity of the ice jamming processes and the numerous morphological, meteorological and hydrological interactions involved leading up to ice jamming. A more reliable approach may be to develop a simplified geospatial model that can estimate the predisposition of river reaches to certain ice cover behaviors and fluvial geomorphological characteristics. Attempts have been made to correlate river freeze-up [22] and ice cover breakup [23] to riverine geomorphological features such as sinuosity, slope and width. Such geospatial models would need to be extended to include hydraulic and meteorological factors as well. Sediment transport could also be included in the geospatial modelling. A HEC-6T model (https://mbh2o.com/hec-6t/) has already been developed for the lower Oder River to indicate sediment depositional and erosional areas [24].
The next step after empirical and geospatial modelling could be the development of deterministic models with a more physically-based description of the river ice processes. An example of such a model that was introduced at the workshop is RIVICE, which was set up and run for a stretch along the Oder River. More effort is required to implement additional processes that are particular to the Oder setting, such as the formation of ice cover between spur dikes. Deterministic modelling would also provide opportunities to extend monitoring capabilities using space-borne (satellite platforms) and air-borne (unmanned aerial vehicles) remote sensing techniques. An interesting Synthetic Aperture Radar (SAR) technique was developed for the breakup of ice covers along the Athabasca River in Canada in the spring of 2018 [25] in which the quad-pol backscatter signal was decomposed into different scattering components—surface, volume and double-bounce scattering—to differentiate between intact and running ice.
It is recognized that ice jamming and flooding are processes with strong random components, which inevitably require a probabilistic description of occurrence within a forecasting context. The hydrological forecasting model that has been set up for the headwaters of the Oder River would have to extend further downstream to provide discharge forecasts for the lower Oder River. Revisit times of the satellite image acquisitions need to be more frequent in order for them to be used operationally in an ice flood forecasting system. Using images from an array of sensors (TerraSAR-X, RADARSAT-2, Sentinel-1, Sentinel-2, Cosmo SkyMed and potentially the upcoming RADARSAT Constellation Mission (RCM)), along with cloud-free observations by optical sensors, such as Sentinel-2 and Landsat, will help fill gaps so that an image can be made available at least once per day for operational forecasting. A multi-scale earth observation framework was also discussed in which space-borne observations would be used to create a large-scale overview and, subsequently, the identified hotspots would be mapped in higher detail using UAVs or ice observers.

Author Contributions

All authors contributed equally to discussions on the conceptualization of an ice jam flood forecasting system for the Oder River. The initial text was drafted by K.-E.L. with all authors providing input and amendments to the text. Z.W.K. provided final refinements to the manuscript.

Funding

The Wrocław workshop expenses were covered by funds from the Global Water Futures program and hosted by the Global Institute for Water Security, University of Saskatchewan. The development of the HydroProg system was financed by the National Science Centre of Poland (grant no. 2011/01/D/ST10/04171) and the National Centre for Research and Development of Poland (grant no. TANGO1/267857/NCBR/2015).

Acknowledgments

Special thanks to Kelly McShane (Financial Director) and Sherry Olauson (Administrative Assistant), both at the Global Institute for Water Security, for their help in the organization of the workshop.

Conflicts of Interest

The authors declare no conflict of interest.

References

  1. Kundzewicz, Z.W.; Hegger, D.L.T.; Matczak, P.; Driessen, P.P.J. Flood risk reduction: Structural measures and diverse strategies. PNAS 2018, 115, 12321–12325. [Google Scholar] [PubMed]
  2. Lugeri, N.; Kundzewicz, Z.W.; Genovese, E.; Hochrainer, S.; Radziejewski, M. River flood risk and adaptation in Europe—assessment of the present status. Mitig. Adapt. Strateg. Glob. Chang. 2010, 15, 621–639. [Google Scholar] [CrossRef]
  3. Kundzewicz, Z.W.; Krysanova, V.; Dankers, R.; Hirabayashi, Y.; Kanae, S.; Hattermann, F.F.; Huang, S.; Milly, P.C.; Stoffel, M.; Driessen, P.P.J.; et al. Differences in flood hazard projections in Europe—Their causes and consequences for decision making. Hydrol. Sci. J. 2017, 62, 1–14. [Google Scholar] [CrossRef]
  4. Carstensen, D. Ice conditions and ice forces. In Proceeding of the Chinese-German Joint Symposium on Hydraulic and Ocean Engineering, Darmstadt, Germany, 24–30 August 2008. [Google Scholar]
  5. Beltaos, S.; Burrell, B.C. Hydrotechnical advances in Canadian river ice science and engineering during the past 35 years. Can. J. Civ. Eng. 2015, 42, 583–591. [Google Scholar] [CrossRef]
  6. White, K.D. Review of prediction methods for breakup ice jams. Can. J. Civ. Eng. 2003, 30, 89–100. [Google Scholar] [CrossRef]
  7. White, K.D. Breakup ice jam forecasting. In River Ice Breakup; Beltaos, S., Ed.; Water Resources Publications: Highlands Ranch, CO, USA, 2008; Chapter 10; pp. 327–348. [Google Scholar]
  8. Sun, W.; Trevor, B. A comparison of fuzzy logic models for breakup forecasting of the Athabasca River. In Proceedings of the 18th CRIPE Workshop—Hydraulics of Ice Covered Rivers, Quebec City, QC, Canada, 18–20 August 2015. [Google Scholar]
  9. Mahabir, C. Regression and fuzzy logic based ice jam flood forecasting. In Mackenzie GEWEX Experience; Springer: Berlin/Heidelberg, Germany, 2008; pp. 307–325. [Google Scholar]
  10. Brayall, M.; Hicks, F. Applicability of 2-D modelling for forecasting ice jam flood levels in the Hay River Delta, Canada. Can. J. Civ. Eng. 2012, 39, 701–712. [Google Scholar] [CrossRef]
  11. Beltaos, S.; Tang, P.; Rowsell, R. Ice jam modelling and field data collection for flood forecasting in the Saint John River, Canada. Hydrol. Process. 2012, 26, 2535–2545. [Google Scholar] [CrossRef]
  12. Piniewski, M.; Mezghani, A.; Szczesniak, M.; Kundzewicz, Z.W. Regional projections of temperature and precipitation changes: Robustness and uncertainty aspects. Meteorol. Z. 2017, 26, 223–234. [Google Scholar] [CrossRef]
  13. Piniewski, M.; Szcześniak, M.; Huang, S.; Kundzewicz, Z.W. Projections of runoff in the Vistula and the Odra river basins with the help of the SWAT model. Hydrol. Res. 2018, 49, 303–317. [Google Scholar] [CrossRef]
  14. Werninghaus, R.; Buckreuß, S. The TerraSAR-X Mission and System Design. IEEE Trans. Geosci. Remote Sens. 2010, 48, 606–614. [Google Scholar] [CrossRef] [Green Version]
  15. Niedzielski, T.; Miziński, B.; Yu, D. Hydrological forecasting in real time: An experimental integrated approach. In Geomorphometry for Geosciences, Bogucki Wydawnictwo Naukowe; Jasiewicz, J., Zwoliński, Z., Mitasova, H., Hengl, T., Eds.; Adam Mickiewicz University in Poznań—Institute of Geoecology and Geoinformation: Poznań, Poland, 2015; pp. 97–101. [Google Scholar]
  16. Niedzielski, T.; Witek, M.; Spallek, W. Observing river stages using unmanned aerial vehicles. Hydrol. Earth Syst. Sci. 2016, 20, 3193–3205. [Google Scholar] [CrossRef] [Green Version]
  17. Niedzielski, T.; Miziński, B. Real-time hydrograph modelling in the upper Nysa Kłodzka river basin (SW Poland): A two-model hydrologic ensemble prediction approach. Stoch. Environ. Res. Risk Assess. 2017, 31, 1555–1576. [Google Scholar] [CrossRef]
  18. Kögel, M.; Das, A.; Marszelewski, W.; Carstensen, D.; Lindenschmidt, K.-E. Feasibility study for forecasting ice jams along the Oder River. Wasserwirtschaft 2017, 5, 20–28. (In German) [Google Scholar]
  19. ECCC. RIVICE Model—User’s Manual. Environment and Climate Change Canada, January 2013. Available online: http://giws.usask.ca/rivice/Manual/RIVICE_Manual_2013-01-11.pdf (accessed on 4 January 2019).
  20. Lindenschmidt, K.-E.; Rokaya, P.; Das, A.; Li, Z.; Richard, D. A novel stochastic modelling approach for operational real-time ice-jam flood forecasting. J. Hydrol. 2019. submitted. [Google Scholar]
  21. Hentschel, B.; Höger, P. Physical Modelling Studies of River Ice Issues along the Oder River. 37. Dresdner Water Engineering Colloquium 2014 Simulation Techniques and Models for Water Engineering and Water Management. Institute for Water Engineering and Technical Hydromechanics, Faculty of Civil Engineering, Technical University of Dresden, 2014. Available online: https://henry.baw.de/handle/20.500.11970/103448 (accessed on 4 January 2019).
  22. Lindenschmidt, K.-E.; Chun, K.P. Geospatial modelling to determine the behaviour of ice cover formation during river freeze-up. Hydrol. Res. 2014, 45, 645–659. [Google Scholar] [CrossRef]
  23. Lindenschmidt, K.-E.; Das, A. A geospatial model to determine patterns of ice cover breakup and dislodgement behaviour along the Slave River. Can. J. Civ. Eng. 2015, 42, 675–685. [Google Scholar] [CrossRef]
  24. BAW. Update of the Regulation Conceptualisation of the Oder River Bordering Germany and Poland. Bundesanstalt für Wasserbau: Karlsruhe, Germany, 30 May 2014. Available online: http://www.wsa-eberswalde.de/wir_ueber_uns/wasserstrassen/die_oder/Stromregelungskonzeption_fuer_die_Grenzoder/index.html (accessed on 4 January 2019). (In German and Polish).
  25. Lindenschmidt, K.-E.; Li, Z. Radar scatter decomposition to differentiate between running ice and intact ice covers along rivers. Remote Sens. 2019. submitted. [Google Scholar]
Figure 1. The lower Oder River flowing along the German–Polish border. The inset provides the elevations along the Oder’s lower reach with indications of the average slope of the river bed.
Water 11 00095 g001
Figure 2. Ice jam on the Oder River at Frankfurt/Oder on 24 February 2012 (photo by Halka Beberstedt; used with permission).
Water 11 00095 g002
Figure 3. Ice breakers driving in loops to break up large sheets of ice cover (courtesy of Regional Water Management Authority, Szczecin).
Water 11 00095 g003
Figure 4. Ice breakers operating in parallel to break up thinner ice covers on low sloping waters (courtesy of Regional Water Management Authority, Szczecin).
Water 11 00095 g004
Figure 5. Ice breakers barely able to drive under a bridge during high flows in the Oder River (courtesy of Regional Water Management Authority, Szczecin).
Water 11 00095 g005
Figure 6. Illustration scheme of established ice jam with ice erosion from the ice jam toe and scour of the river bed below the ice jam.
Water 11 00095 g006
Figure 7. Backwater staging caused by an ice jam along the lower Oder River in January 2016. Water levels are shown for the gauges, in the downstream direction at Stützkow (Oder-km 685; values reduced by 300 cm in the graph), Hohensaaten-Finow (Oder-km 665), Kienitz (Oder-km 632) and Kietz (Oder-km 615) (data source: Wasser- und Schifffahrtsverwaltung, Eberswalde, Germany).
Water 11 00095 g007
Figure 8. Abrupt rise in water levels at Ratzdorf (Oder-km 542) in February 2012. Water levels almost reached Level A-IV of the flood warning system, which would have left a short response for additional protective measures ( source: Wasser- und Schifffahrtsverwaltung, Eberswalde, Germany).
Water 11 00095 g008
Figure 9. Mean air temperature in the months of possible occurrence of ice phenomena (November–March) in Słubice, 1956–2015 (based on data from the Institute of Meteorology and Water Management—National Research Institute in Warsaw).
Water 11 00095 g009
Figure 10. Duration of ice phenomena (DIP) in days (blue) and duration of ice cover (DIC) in days (red) on the Oder River at Słubice with their rates of change (1956–2015) (based on data from the Institute of Meteorology and Water Management—National Research Institute in Warsaw).
Water 11 00095 g010
Figure 11. Location of sections where ice jams of at least 1 m thickness were recorded in the years 2009–2018 (based on data from the Regional Water Management Authority, Szczecin).
Water 11 00095 g011
Figure 12. Changes in the multi-model ensemble means of annual runoff for the Vistula and Oder river basins, for the near future (NF) and far future (FF) (2021–2050 and 2071–2100, respectively) under Representative Concentration Pathway (RCP) 4.5 and 8.5 (adapted from [13]).
Water 11 00095 g012
Figure 13. Sentinel-2B image acquired for the Oder River on 2 February 2018. The bridge crosses the river at 50°30′53.34″ N, 17°57′16.78″ E.
Water 11 00095 g013
Figure 14. Comparison of Sentinel-2 RGB (red-green-blue) composition (left panel) and classification of Sentinel-1 data (right panel) (Lower Vistula River, acquired 31 January 2017). The bridge crosses the river at coordinates 54°15′21.03″ N, 18°56′45.94″ E.
Water 11 00095 g014
Figure 15. Multi-model ensemble prediction of stages together with forecasts based on ensemble members compared to measurements that were observed.
Water 11 00095 g015
Figure 16. Longitudinal profile of the water levels and ice cover simulated from the ice jam that formed at Kietz in January 2016 (adapted from [18]).
Water 11 00095 g016
Figure 17. Monte-Carlo framework to calibrate the volume of ice, Vice, required to form ice jams along a stretch of the Oder River. Inputs to the framework include extreme value distributions of flows, Q, and water levels, W, at the upstream and downstream boundaries of the model domain, respectively. The location and scale parameters of the extreme value distribution of Vice must first be estimated. The model is then executed many times with each simulation run with a different set of randomly extracted parameter and boundary condition values. Water levels at the gauge locations are extracted from the resulting ensembles from which an extreme value distribution of stage is constructed (simulated) that is compared to the distribution of the recorded ice jam peak stages (observed). If the two distributions do not coincide, the simulations are repeated until the location and scale parameters of Vice are adjusted. When the simulated and observed stage distributions coincide, the Vice distribution is considered to be calibrated.
Water 11 00095 g017
Figure 18. The forecasting framework is based on the same Monte-Carlo framework as in the previous figure, with the difference that the extreme value distributions of the upstream flow boundary condition, Q, downstream water level boundary condition, W, and volume of ice, Vice, are constrained according to the hydraulic and ice conditions immediately before the ice jam event is suspected to occur.
Water 11 00095 g018
Figure 19. Setup of physical model of the Oder River near Widuchowa, which forks into the Western and Eastern channel branches of the river (adapted from [21]).
Water 11 00095 g019
Figure 20. Wrocław workshop participants (from left to right): Stefan Schlaffer, Zbigniew W. Kundzewicz, Włodzimierz Marszelewski, Marcin Nowak, Karl-Erich Lindenschmidt, Stefan Iwicki, Adam Łazarów, Michał Kubicki, Bogusław Pawłowski, Tomasz Niedzielski, Bernd Hentschel, Wolfgang Fröhlich, Dirk Carstensen, Michael Roers, Cornelia Lauschke, Michael Kögel and Beata Weintrit.
Water 11 00095 g020
Table 1. Characteristics of the three microwave sensors, TerraSAR-X, RADARSAT-2 and Sentinel-1.
TerraSAR-XRADARSAT-2Sentinel-1
frequency/wavelengthX-band/3 cmC-band/5.6 cmC-band/5.6 cm
polarisationsingle-pol, dual-pol, (quad-pol)single-pol, dual-pol, quad-polsingle-pol, dual-pol
spatial resolution (SLC)/scene size0.6 m/4 km (spotlight)
3.3.m/270 km (wide ScanSAR)
8 m/50 km (fine mode)
100 m/500 km (ScanSAR wide mode)
5 m/80 km (StripMap)
20 m/250 km (interferometric wide swath
data accesscommercial distribution of datacommercial distribution of dataopen data policy

