Effects of Intra-Storm Soil Moisture and Runoff Characteristics on Ephemeral Gully Development: Evidence from a No-Till Field Study


Department of Biological and Agricultural Engineering, Kansas State University, Manhattan, KS 66506, USA
*
Author to whom correspondence should be addressed.
Water 2017, 9(10), 742; https://doi.org/10.3390/w9100742
Submission received: 27 August 2017
/
Revised: 24 September 2017
/
Accepted: 26 September 2017
/
Published: 28 September 2017
(This article belongs to the Special Issue Streambank Erosion: Monitoring, Modeling and Management)
Abstract
:Ephemeral gully erosion, prevalent on agricultural landscapes of the Great Plains, is recognized as a large source of soil loss and a substantial contributor to the sedimentation of small ponds and large reservoirs. Multi-seasonal field studies can provide needed information on ephemeral gully development and its relationship to physical factors associated with field characteristics, rainfall patterns, runoff hydrograph, and management practices. In this study, an ephemeral gully on a no-till cultivated crop field in central Kansas, U.S., was monitored in 2013 and 2014. Data collection included continuous sub-hourly precipitation, soil moisture, soil temperature, and 15 field surveys of cross-sectional profiles in the headcut and channelized parts of the gully. Rainfall excess from a contributing catchment was calculated with the Water Erosion Prediction Project (WEPP) model for all storm events and validated on channel flow measurements. Twelve significant runoff events with hydraulic shear stresses higher than the critical value were identified to potentially cause soil erosion in three out of fourteen survey periods. Analysis of shear stress imposed by peak channel flow on soil surface, antecedent soil moisture condition, and channel shape at individual events provided the basis on which to extend the definition of the critical shear stress function by incorporating the intra-storm changes in soil moisture content. One potential form of this function was suggested and tested with collected data. Similar field studies in other agriculturally-dominated areas and laboratory experiments can develop datasets for a better understanding of the physical mechanisms associated with ephemeral gully progression.
1. Introduction
Increasing global population has raised demand for higher productivity from agriculture. One of the essential problems that limits agricultural productivity relates to soil degradation due to loss of topsoil and soil erosion processes [1,2]. Soil erosion is divided into three general types: sheet and rill erosion, ephemeral and classical gully erosion, and stream bank and bed erosion [3]. Soil transported from upland areas through ephemeral and classical gullies contributes to stream and lake sedimentation and intensifies nitrification in the reservoirs of the world [4,5].
An ephemeral gully is a small channel with an average cross-sectional area larger than 0.1 m2 (or about 1 ft2) that is formed due to concentrated surface runoff along the drainage pathways on a hillslope or in the lower part of a cultivated field [3,6]. Ephemeral gullies can normally be removed by tillage operations but tend to re-appear in the same location after intense rainfall events [3,7]. Ephemeral gully can grow into classical gullies if left untreated for prolonged time. The studies worldwide have shown that the impacts of ephemeral gully erosion can vary from 30% to more than 90% with annual soil losses reaching up to 90 Mg/ha [3,8,9,10].
Ephemeral gully development is affected by a number of factors [4,9,11,12,13,14]: rainfall characteristics, soil properties, topographic features, and land use and management, among others. Higher rainfall intensities result in more erosive power in surface runoff, which increases the potential for gully erosion [15]. Field hydrologic conditions, crop type, root structure, vegetation density, and antecedent soil moisture content affect soil detachment and sediment transport [16]. Topographic landscape features direct ways of flow accumulation and direction, controlling the amount of surface runoff and points of flow conversion [9]. Ephemeral gully initiation points and trajectories have been explored by evaluating the attributes of slope, upstream drainage area, planar curvature, and defining topographic index thresholds [9,17,18]. Higher values of the threshold show areas of favorable conditions for concentrated flow pathways and gully trajectories.
Ephemeral gullies predominantly form on cultivated croplands where land cover and above- and below-ground vegetative biomass control their development [19]. Conventional tillage disrupts soil structure and reduces its resistance to soil erosion, promoting channelized flows and ephemeral gully development [20]. In addition, continuous tillage creates a layer of compacted soil (often called a plow-pan) underneath a layer of tilled topsoil, which restricts or slows infiltration and contributes to faster soil saturation and higher surface runoff [21]. No-till, an opposite management practice to conventional tillage, requires direct seed planting with minimum soil disturbance and leaves 30% to 100% of crop residue on the soil surface [22]. No-till has been widely used in the Great Plains due to improved soil health (organic matter, soil structure, carbon storage), increased infiltration, better conservation of subsurface water, and gradual removal of the residual plow-pan [23,24].
Soil texture and its resistance to soil erosion play an important role in gully formation [25,26]. The shearing force of the concentrated flow within a gully can initiate soil particle detachment if the critical threshold is exceeded. Soil critical shear stress τC depends on factors including texture, bulk density, particle size distribution, void space, soil cohesion, surface sealing, crusting, freezing and thawing, and may vary during a runoff event. For ephemeral gully formation, a range of τC can vary from 3 to 32 Pa for silt loam and from 17 to 74 Pa for sandy loams on agricultural fields in Europe [27,28].
An effect of soil moisture content on gully initiation and channel deepening and widening was reported in literature after field and laboratory studies. Capra et al. [14] indicated the impact of 3-day cumulative rainfall depth and the associated elevated soil moisture, while Wells et al. [13] concluded the importance of soil texture, tailwater height, and pore water pressure on promoting gully erosion. Tebebu et al. [29] also noticed the role of soil moisture and stated that gully development events only occurred when ground water table level was higher than the bottom of the gully. Knapen et al. [30] reviewed factors that influence resistance to soil erosion and noted that gravimetric soil moisture content affected critical shear stress and soil erodibility.
Several techniques can be used to determine ephemeral gully erosion in field studies [31,32,33,34,35,36,37,38]. The techniques vary from simple methods of approximating the gully cross-sectional area and length with a pole and a tape to complex approaches that utilize remote sensing and photogrammetry techniques. The 2-D based conventional techniques can be conducted at any time during the crop growing season, but yield a lower resolution reconstructed shape of the gully. Whereas 3-D based complex approaches can be very accurate, but the results can be affected by field condition, stems and canopy cover, as well as rely on equipment availability and cost [36,38]. One approach that combines the accuracy of complex methods while allowing to collect data with mature crop canopy is the use of micro-topographic profiler or a pin-frame as suggested by Casali et al. [34].
Ephemeral gully erosion models use process equations for surface flow, soil erosion, and channel development and incorporate model parameters that depend on topographic, land cover, soil and other properties of a field [39,40,41]. Laboratory and field studies can be used to provide unique data needed to define functional forms and regression curves of relevant physical parameters, and their values for model calibration and validation. However, such experiments on ephemeral gully erosion in controlled field environments with continuously monitoring setup are difficult to conduct for prolonged periods of time due to field availability, management practice, data collection load, and climate variability, among other factors [32,33,34,36,37].
Therefore, the main goal of this research was to conduct a field study of ephemeral gully development on a cultivated crop field under continuous no-till management practice and analyze the factors responsible for soil loss within the gully. The specific objectives were (1) to develop a dataset of continuous changes in ephemeral gully profile and associated physical variables, such as soil moisture, precipitation, runoff, and sheet and rill erosion, (2) to evaluate the impacts of individual runoff events on channel development, and (3) to evaluate channel erosion by analyzing different factors that affect soil detachment.
2. Materials and Methods
2.1. Study Area
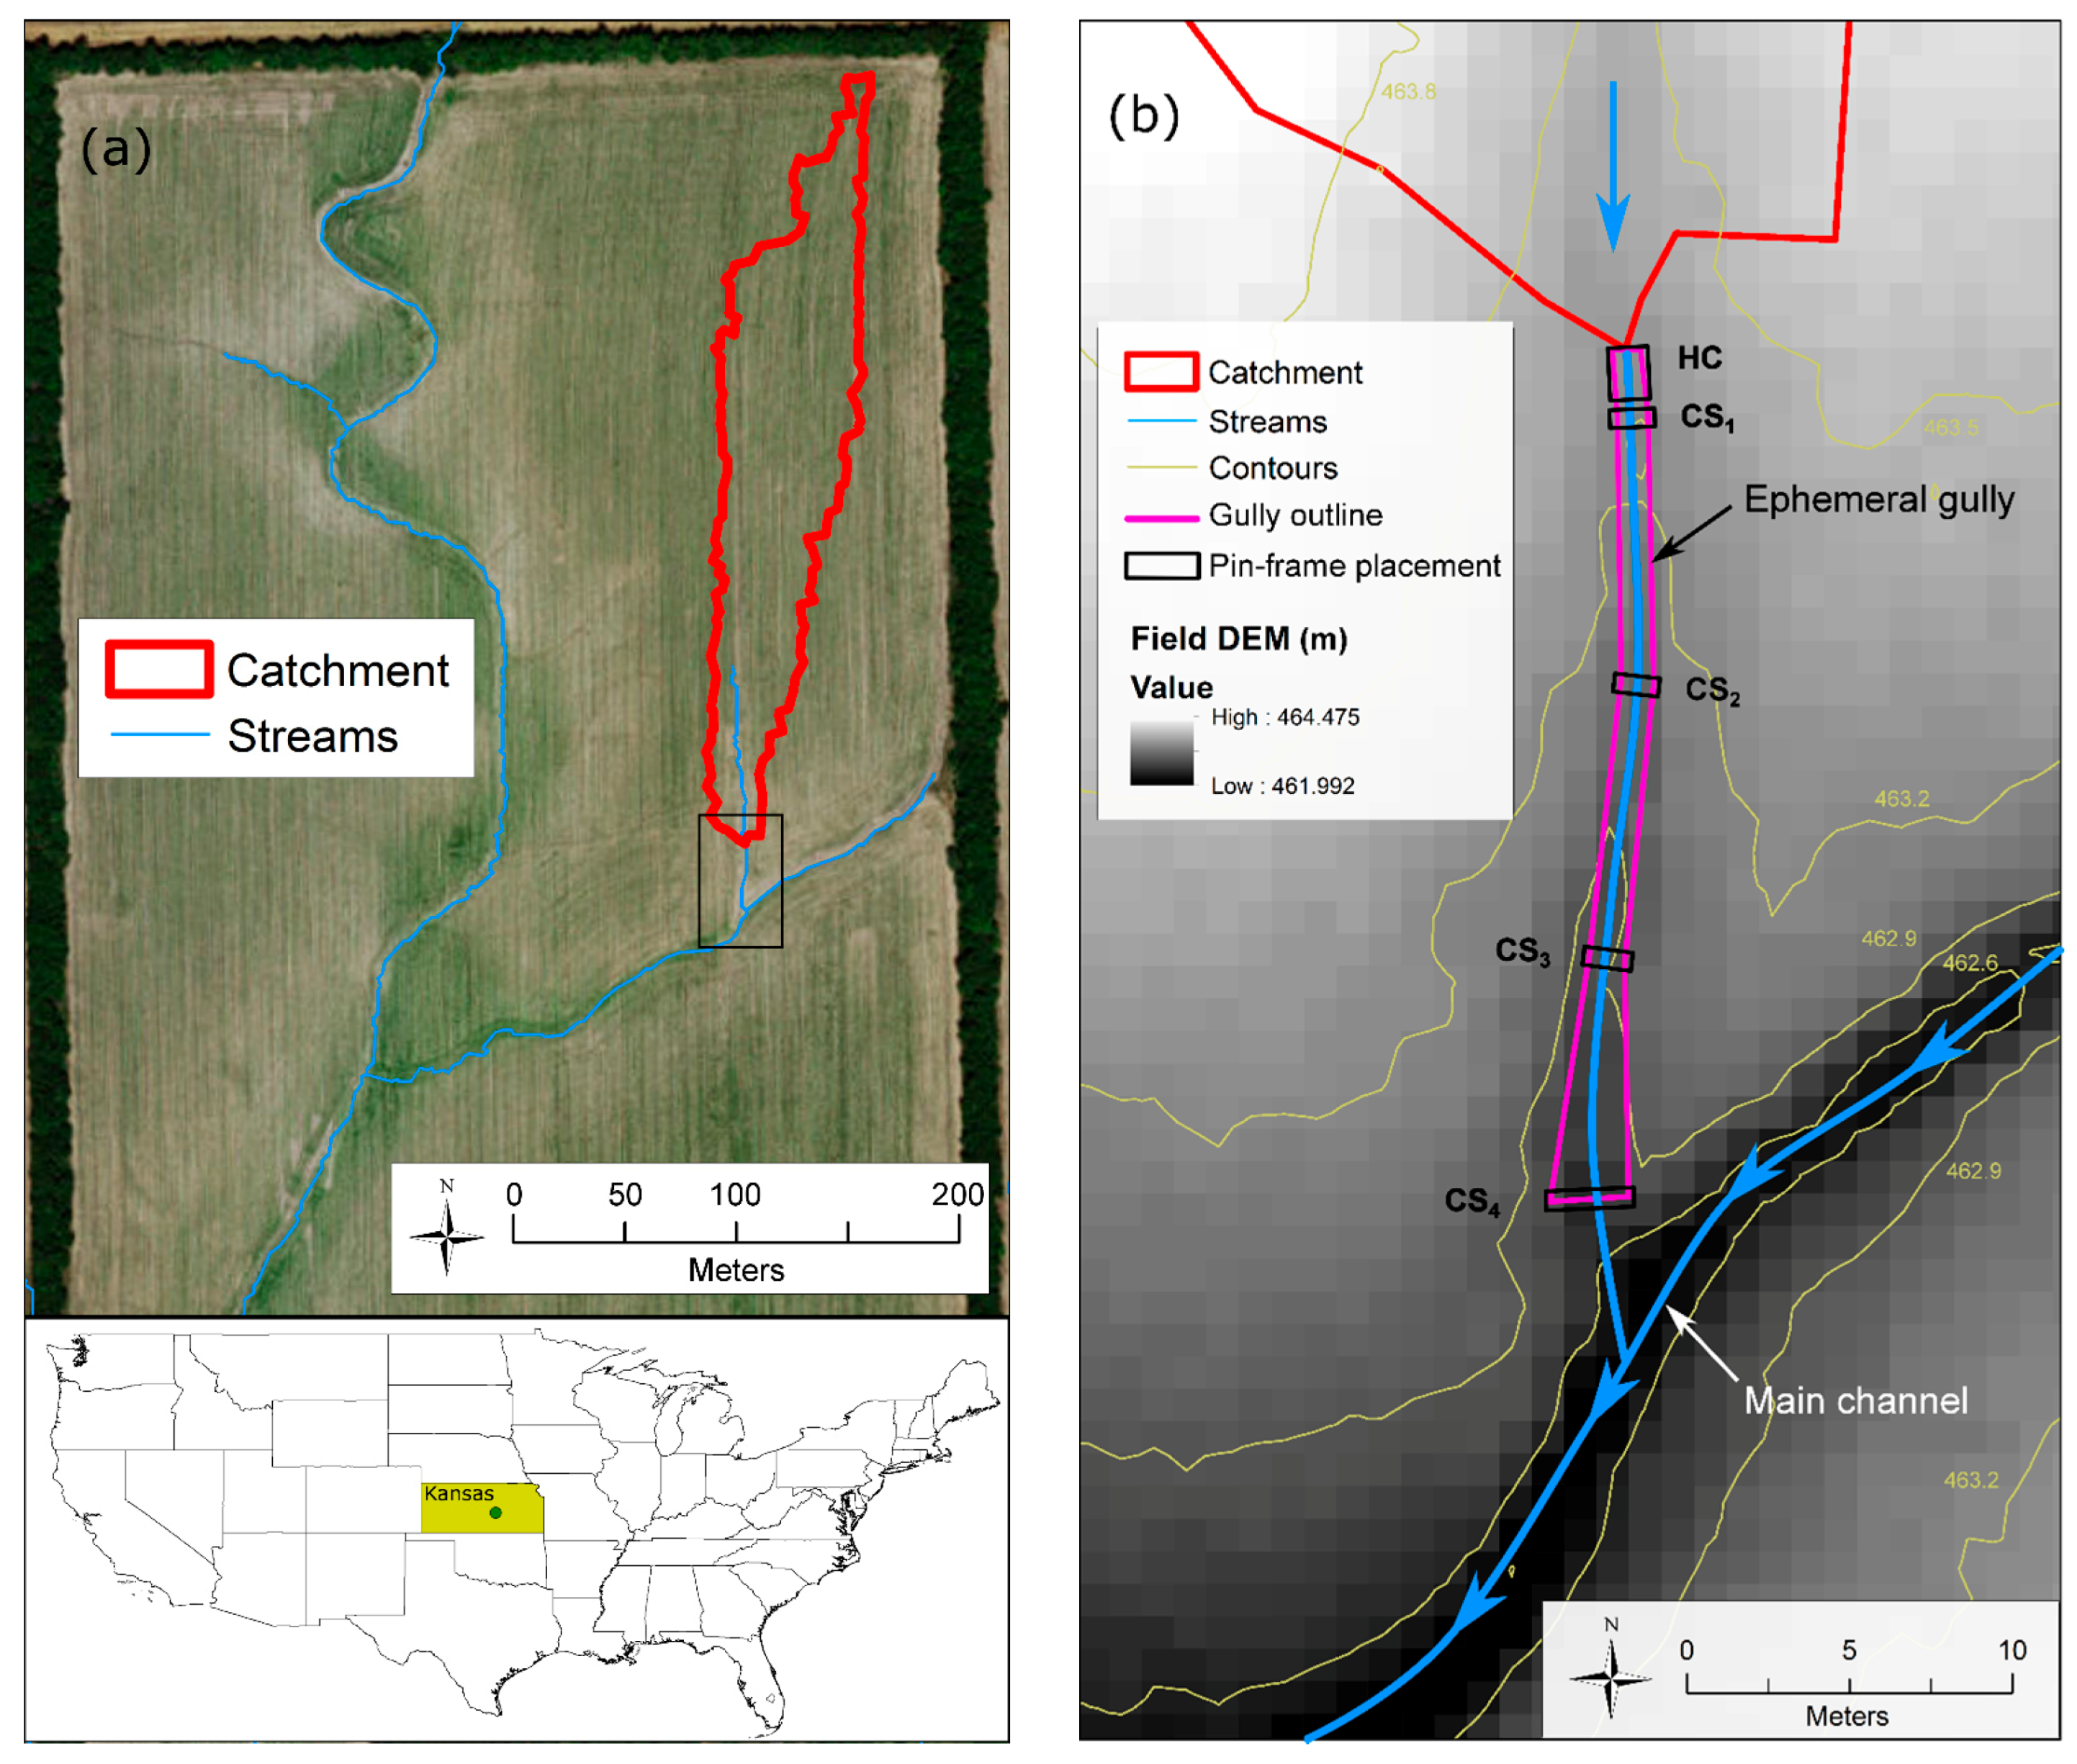
A 32-hectare agricultural field in the Little Arkansas River watershed (8-digit Hydrologic Unit Code 11030012), 10 km east from the city of McPherson in central Kansas USA, was selected for this study (Figure 1). The field has been in cultivated crop production for more than 40 years. The soil was Crete silt loam with a silt content of 55%, clay content of 37%, sand content of 8%, bulk density of 1570 kg∙m−3, and soil critical shear stress coefficient of 3.5 Pa [42,43,44]. A slightly compacted layer of subsoil was detected at the depth of 0.4 m with soil compaction tester. Crete soils are prevalent on interfluves and hillslopes on uplands and stream terraces on river valleys in Central Loess Plains of Kansas and Nebraska, USA [25,44]. The field received average annual precipitation of 830 mm from 1990 to 2010 [45]. Intense rainfall events of late spring and early summer—when land is bare and poorly protected with summer crops in their early growing stages—cause surface runoff and high soil losses due to the sheet, rill, and ephemeral gully erosion.
From 2005 to 2014, the field was under a continuous crop rotation schedule, mainly growing summer crops of corn, grain sorghum, and soybeans. During the studied period of 2013 and 2014, grain sorghum was planted in 2013 followed by soybeans in 2014. Every year, residue was left uncollected after crop harvesting in the fall and fertilizer was applied once a year in June. No-till was adopted for the past 10 years, although farming operations were conducted up and down the slope without following the contours. This practice formed ridges of growing crops along the hillslope and caused overland flow to concentrate between the rows and move toward the field outlet, thus accelerating rill and ephemeral gully erosion.
One catchment with a visible ephemeral gully in the northeast part of the field was selected for the detailed study of ephemeral gully development (Figure 1a). The catchment was fully encapsulated within the field with no inflow from adjacent areas. The catchment drainage area was delineated with ArcGIS ver. 10 software [46] at 1.2 ha with an average slope of 0.6% and the longest flow path of 321 m. Several years prior to 2013, the incised rill was formed on the north bank of the main channel and began progressing upslope with little disturbance from farming activities due to the adopted no-till. At the beginning of this study in the spring of 2013, the rill was enlarged into the size of an ephemeral gully and measured at 19 m from headcut to the junction with the main channel and had depth varied from 0.3 m to 0.5 m (Figure 1b).
2.2. Field Equipment
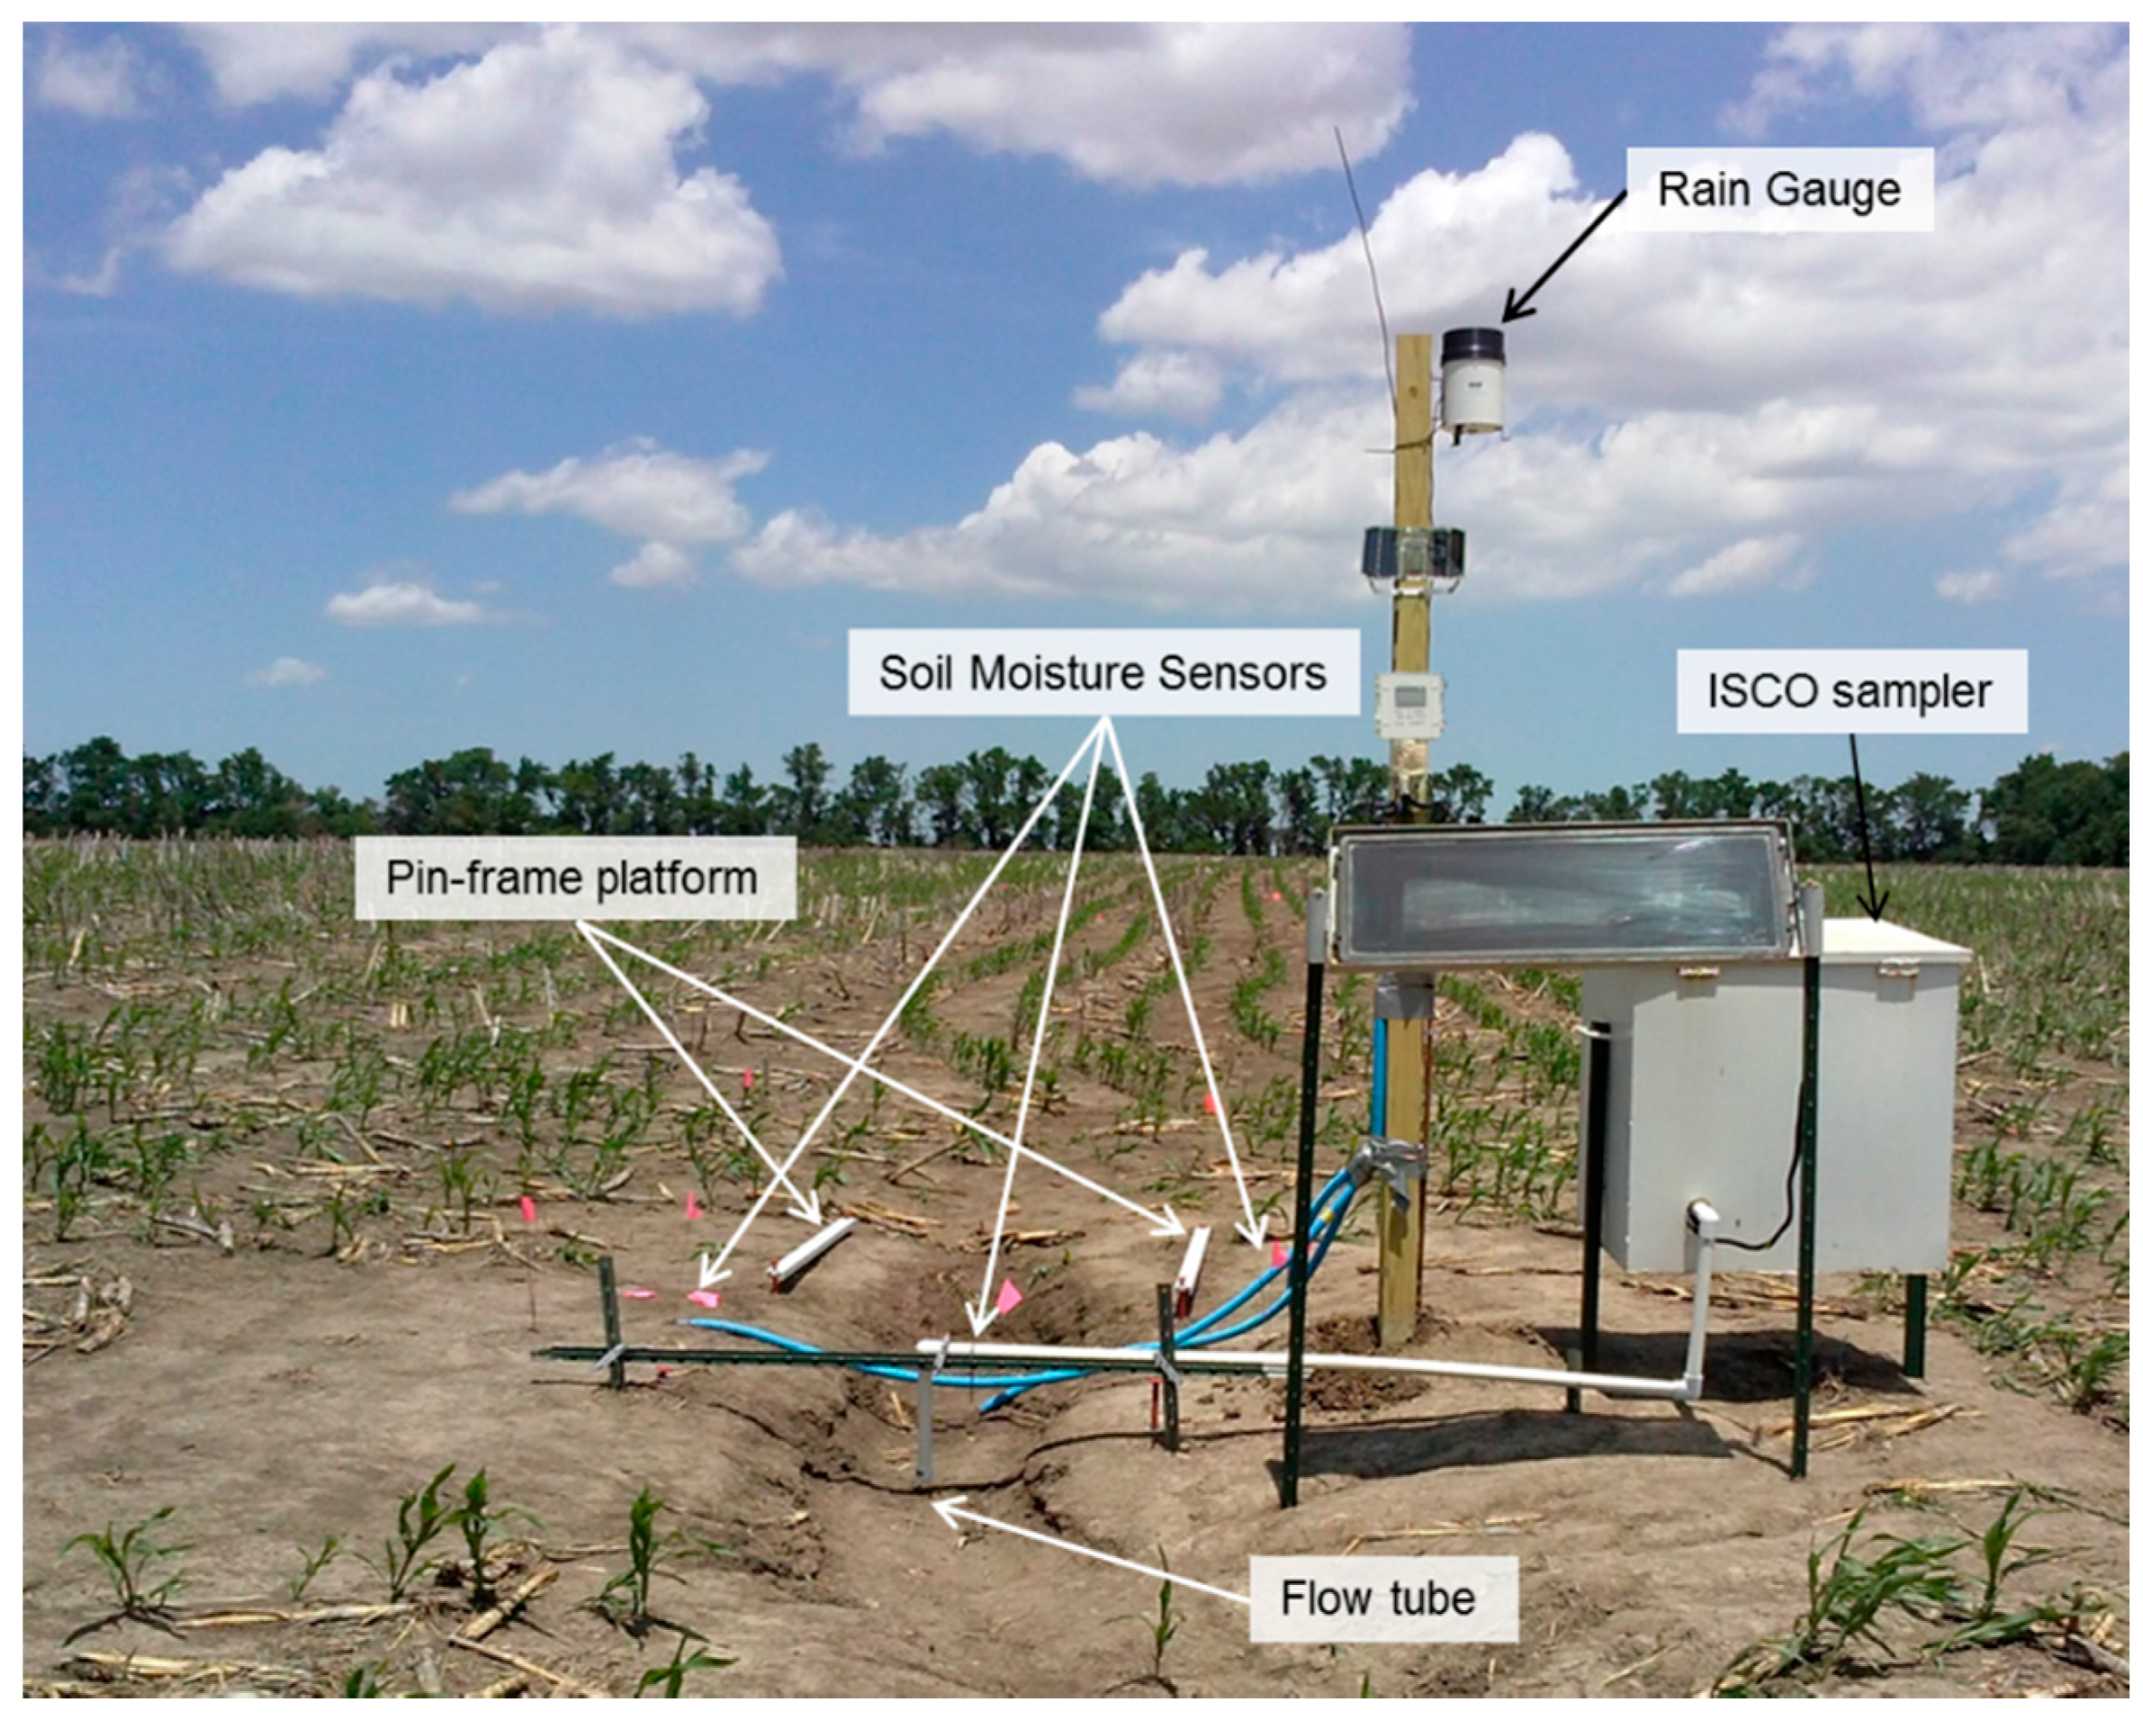
Field equipment was instrumented along the gully to measure hydrologic characteristics associated with ephemeral gully development: volumetric soil moisture content, soil temperature, precipitation depth, surface runoff, and channel morphology (Figure 2). A tipping bucket-type rain gauge, solar panel, and data logger [47] were installed on the wooden post 1 m downslope of the headcut and 1 m east from the bank of the gully. Precipitation depth was recorded every 2.54 mm (0.01 in). Eight volumetric soil moisture probes [48] were carefully inserted with minimum disturbance into the soil 1.5 m downslope of the gully headcut and connected to the data logger. Six probes were installed at depths of 5 cm, 20 cm, and 50 cm on both banks of the gully channel and about 15 cm away from the edge to cover the range of soil moisture distribution from topsoil to plow pan layer. Two additional probes were placed in the middle of the gully at depths of 5 cm and 20 cm. To eliminate ambient temperature effect on soil moisture sensor reading, three temperature sensors were installed at the same depths and used for probe reading adjustment [48,49]. Soil moisture content and temperature were recorded continuously with a 2 min interval.
A portable water sampler (Model 6700; ISCO Inc., Lincoln, NE, USA) with automatic stage recorder module (Model 7300; ISCO Inc., Lincoln, NE, USA) was installed 0.5 m downstream of soil moisture probes to continuously record channel inflow stage [50]. A bubbler flow tube was secured with PVC pipes in the center of the channel and connected to the stage recorder (Figure 2). Channel cross-section (CS1; Figure 1b) at the location of the bubbler tube was frequently surveyed during field visits. Local channel slope at CS1 was measured at 1.7%. Eight runoff events were recorded and event hydrographs were developed. These events were used for the calibration of the soil erosion model.
2.3. Measuring Channel Cross Sections
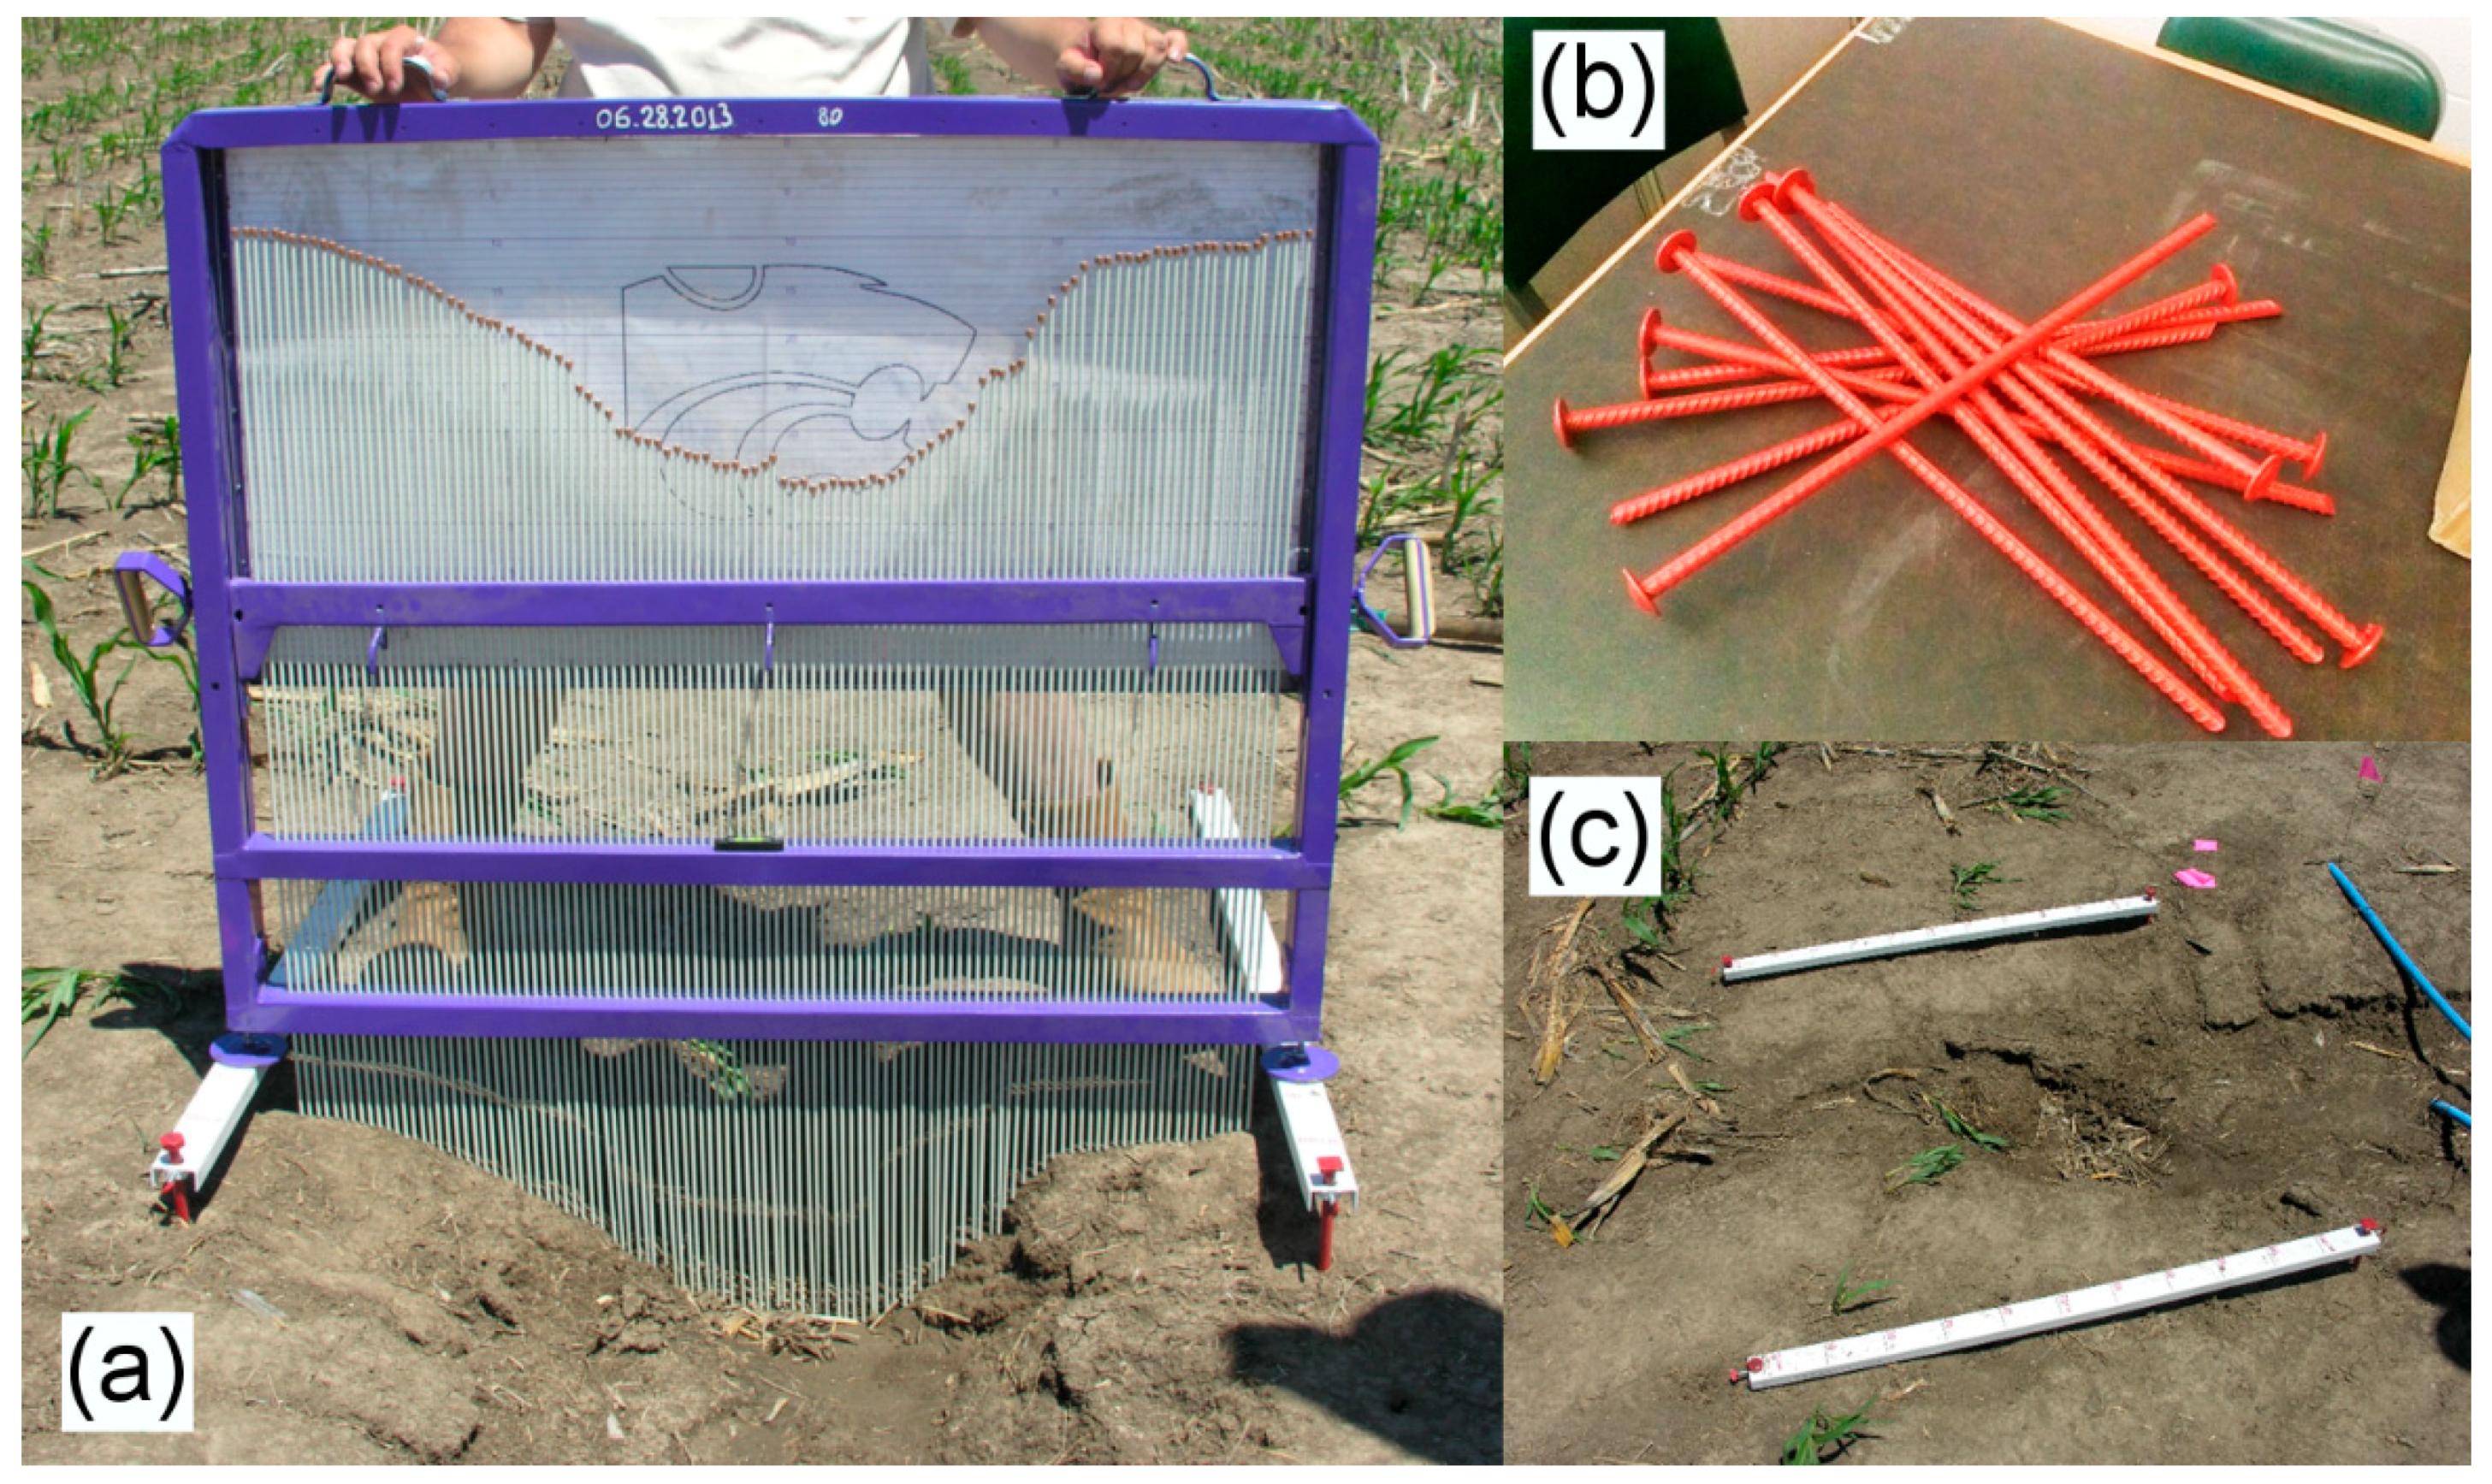
To measure an ephemeral gully cross-sectional profile, a custom pin-frame was designed and manufactured in the workshop of the Department of Biological and Agricultural Engineering at Kansas State University (Figure 3a). The pin-frame device was made from a welded metal frame that contained 110 fiberglass rods (or pins), 100-cm long and equally spaced 1 cm apart from each other. The rods were mounted on the frame and allowed to freely fall when the pin-frame was placed above the ground. The fiberglass rods were made of lightweight material, which lowered the impact of the tip on the soil, thus decreasing potential soil deformation. A white cardboard with 0.5 cm horizontal marks was attached to the back of the frame as a reference board for depth measurements. When the rods touched the ground, their top ends formed a profile that was used to represent a gully cross-section. The rods were then photographed from a distance of 2 m with a high-resolution digital camera aimed perpendicular to the face of the frame. The digital image was digitized later in the lab during the post-processing steps. The accuracy of the depth measurement for each rod was evaluated to be within 0.5 cm.
To preserve the accuracy of repetitive measurements of the same cross-section, a leveled reference base for setting the pin-frame above ground was established by installing either individual earth pins (Figure 3b) or base foundation platforms (Figure 3c) on the banks of the gully. Earth pins were 60-cm long, made of a steel rebar with a 5 cm (2 in) washer welded to one end (Figure 3b). The base foundation platform was 100-cm long, made out of a U-shape steel beam, with eleven locations marked every 10 cm for the placement of the pin-frame leg (Figure 3c). The platform was held in place by two earth pins at both ends. The platform was designed to cover larger channel area within the headcut with cross-sections measured every 10 cm (shown HC in Figure 1b), while earth pins were used for measurements of four individual cross-sections along the channelized part of the gully (identified as CS1 to CS4 in Figure 1b). All pins and platforms were horizontally leveled and referenced to specific elevation on the wooden post with a laser level to ensure the same reference point. During field visits, they were frequently re-referenced to ensure constant reference elevation for channel profile measurements with a pin-frame.
Taking pin-frame measurements at each 10-cm mark on the platform created a grid of 110 × 11 elevation points that completely covered the splash pool area at the beginning of 2013 campaign. The first location, CS1, was at the bubbler flow tube place (Figure 2). The cross-section measurements at CS1 were used to update the function of hydraulic radius in the Manning’s equation to supplement the sampler readings for runoff hydrograph calculations. The second CS2 and third CS3 locations were 6 and 12 m downstream of the first location, respectively. The fourth location CS4 was 18 m below the headcut and at the mouth of the gully confluence with the main channel (Figure 1b). Gully width at CS1, CS2, and CS3 was less than 100 cm, thus pin-frame covered the whole channel width. Between CS3 and CS4, the channel widened greater than the size of the pin-frame, reaching close to 200 cm in width at CS4. Therefore, to measure the whole span of the channel profile, one 100-cm long earth pin was built and placed in the middle of the channel allowing the cross-section CS4 to be measured as a combination of two pin-frame measurements.
2.4. Estimating Ephemeral Gully Erosion
During the two-year data collection campaign of 2013 to 2014, fifteen elevation surveys were conducted. The change in channel depth was calculated based on measurements of cross-sections at HC, CS1, CS2, CS3, and CS4 (Figure 1b). Eleven cross-sections in HC were referenced to the same level, which provided a 100 cm × 110 cm elevation grid. Four cross-sections CS1–CS4 were referenced to a different elevation, thus an assumption of linear interpolation along the channel slope was made, and the depth was calculated as a product of length and linear change in elevation for each rod between the cross-sections. For the gully section between CS3 and CS4 where the gully widens from 100 cm to 200 cm, middle points in the profile were introduced at 0.5 cm interval in CS3 and a planar interpolation was used to connect the points in CS3 and CS4. The outline of the simulated gully shape is shown by the pink line in Figure 1b. After gully elevation profiles were established, the changes in elevation depths and volumes of soil loss or accumulation between field visits were computed in Matlab software [51].
2.5. Estimating Sheet and Rill Erosion
The Water Erosion Prediction Project (WEPP) model [43] was used to calculate rainfall excess and sheet and rill erosion rates from the contributing catchment. WEPP is a complex process-based soil erosion and hydrologic model uniquely designed for prediction of sheet and rill erosion on agricultural hillslopes. The model accommodates various components of the hydrologic budget and, as a result, simulates overland flow, soil moisture infiltration and redistribution, and evapotranspiration, among other water budget components. The event-based hillslope version of WEPP [52] uses field characteristics of the representative flow pathway, such as slope, soil properties, land management, growing plants, etc., and meteorological data as inputs into the model.
Input files for the WEPP model were prepared with the use of online datasets, field measurements, and personal communications with Kansas State University extension specialists. The Digital Elevation Model (DEM), 1 × 1 m2 LiDAR product from Kansas Data Access and Support Center [53], was used in ArcGIS software [46] to identify representative hillslope flowpath to the gully headcut. Based on major breaks in hillslope contours determined by the GIS analysis, the representative flowpath was divided into ten hillslope segments. Each segment had a constant slope and contained three soil layers. Each layer had unique properties of soil found from the soil database [54], land cover, management, and other operations. Grain sorghum was set as a crop in 2013, while soybeans were used for 2014. No-till option was selected for crop management and tillage operations. The precipitation and antecedent soil moisture content time series were built based on 2 min rain gauge and soil moisture sensor readings for each storm event.
The WEPP model outputs at the end of the representative flow path are surface runoff hydrograph and event-total soil erosion rates. These outputs were collected for each rainfall event in 2013 and 2014. The runoff hydrograph was compared with flow data from ISCO sampler at eight events, and WEPP model was calibrated by adjusting effective hydraulic conductivity and parameters related to field condition prior to each rainfall event, i.e., soil moisture content, surface roughness after last tillage, and depth of primary tillage layer. The calibrated model showed statistics of Nash-Sutcliffe Efficiency (NSE = 0.86) and percentage bias (pBIAS = −0.5) for total runoff volume, and NSE = 0.65 and pBIAS = −67.5 for peak runoff rate that were qualified for good to very good performance [55].
2.6. Erosion and Hydrologic Characteristics of a Runoff Event
The soil erosion rate along the flow path, E (kg∙m−3∙s−1), is predicted based on the excess shear stress equation:
where τ (Pa) is the hydraulic shear stress in the rill, τC (Pa) is the critical shear stress, kd (s∙m−1) is the erodibility coefficient, and a is constant (often assumed unity, a = 1). If the shear stress τ is less than the critical value, τC, there is no erosion and E = 0.
The hydraulic shear stress depends on flow discharge, density of flowing water, channel wetted perimeter and slope, and bed roughness, according to the Manning’s equation. One widely used formula for τ is the following [56]:
where γ (kg∙m−2∙s−2) is the specific weight of water, R (m) is the hydraulic radius, and S is the average channel slope. Since shear stress τ depends on the geometry of the channel, the same runoff hydrograph pattern can yield different peak shear stresses calculated at different stages of gully development, i.e., τ is higher for gullies with the higher hydraulic radius R.
The soil critical shear stress coefficient τC defines the critical threshold for τ, at which it allows flow to detach soil particles and causes soil erosion. According to [43], the base τC (specified here as τC0) can be defined based on the fractions of very fine sand (mvfs) and clay (mclay) in the surface soil and is assumed to be constant during the runoff event:
An impact of a storm event on ephemeral gully erosion can be determined by the form of runoff hydrograph, soil condition, and channel shape. The following six hydrologic characteristics were collected for each runoff event:
- time at peak runoff hydrograph, tp (h);
- time 1 h prior to rainfall event, ta (h);
- duration of runoff event, td (h);
- antecedent soil moisture content, θa (%) at t = ta;
- 60 min peak runoff rate qp (m3∙s−1), and;
- channel flow depth hp (cm) at t = tp.
The characteristics of peak runoff were selected due to the highest runoff erosion potential and the highest hydraulic shear stress at the peak discharge in a gully during the event. The time from 1 h prior to rainfall beginning to runoff peak discharge tpa = tp − ta identifies runoff intensity and ability to saturate the soil. The duration of runoff td provides the information on the impact of flow in the gully and potential to deposit sediment produced by sheet and rill erosion.
In addition, the change of soil moisture from the antecedent condition at ta to that at the peak runoff time tp, was obtained, and the rate of change i was calculated as:
i = (θp − θa)/(tp − ta).
3. Results
3.1. Soil Erosion and Accumulation between Soil Surveys
Changes in the ephemeral gully over the study period were obtained based on measured elevation profiles in the headcut (HC in Figure 1b) and channelized parts of the gully (CS1 to CS4) from 15 field visits. In contrast, sheet and rill erosion from the contributing area was calculated by the WEPP model for each rainfall event and aggregated for each period between surveys. Summary of the measured and simulated data for fourteen periods P1 to P14 between 15 field surveys consists of number of rain events, dry days, wet days, total rainfall and runoff, measured ephemeral gully erosion in headcut and channelized parts of the gully, and simulated sheet and rill erosion (Table 1).
Each period contained at least one wet day with at least one rainfall event. The largest total rainfall amount was detected in period P2 (270 mm) followed by period P3 (146 mm)—both in 2013—while period P14 (131 mm) was in 2014. Based on the number of wet days in each period, periods P4 (2 wet days) and P14 (3 wet days) had significantly higher daily average rainfall depth (40 mm/day and 44 mm/day, respectively) than other periods including 25 mm/day in P2. However, while events in P2 and P14 caused soil loss, period P4 did not produce any runoff and no soil loss was either calculated or measured. This shows that the factors other than rainfall depth and intensity can be important in gully progression.
Based on the model output, ten periods (P2, P3, P6, P8–P14) were found to generate runoff into the gully and have associated sheet and rill erosion, however, not all runoff events were able to cause soil loss in the gully. Measurements showed different fluctuations of soil profiles in headcut and channelized parts of the ephemeral gully. Of 15 periods, three periods (P2, P10, P14) showed soil erosion in the headcut area, whereas the channelized part had soil loss in four periods (P2, P3, P10, P11). Sediment accumulation was detected between seven surveys (P5, P6, P8, P12–P14) for the channelized part and in two periods (P3, P8) for the headcut. Only two periods (P2, P10) had erosion and one period (P8) had deposition in both, headcut and channelized, parts of the gully, while other periods with runoff (P3, P5, P6, P11–P14) had opposite soil elevation changes in the gully.
Period P2 had the largest total rainfall and runoff (Table 1) and caused soil erosion in all parts of the gully. However, in comparison to P2, P10 had had a 65% smaller runoff, an 87% higher headcut erosion, and a 200% higher channel erosion, whereas sheet and rill erosion was 73% lower. Periods P3 and P14 with higher rainfall and runoff than in period P10 showed opposite soil losses in headcut and channel while generating similar sheet and rill erosion rates. This link between surface runoff and ephemeral gully erosion signifies the fact that erosion within the gully does not follow main lumped characteristics of rainfall and runoff but rather depends on other factors related to intra-storm characteristics of overland flow and dynamic soil properties.
3.2. Seasonal Changes in the Headcut Area
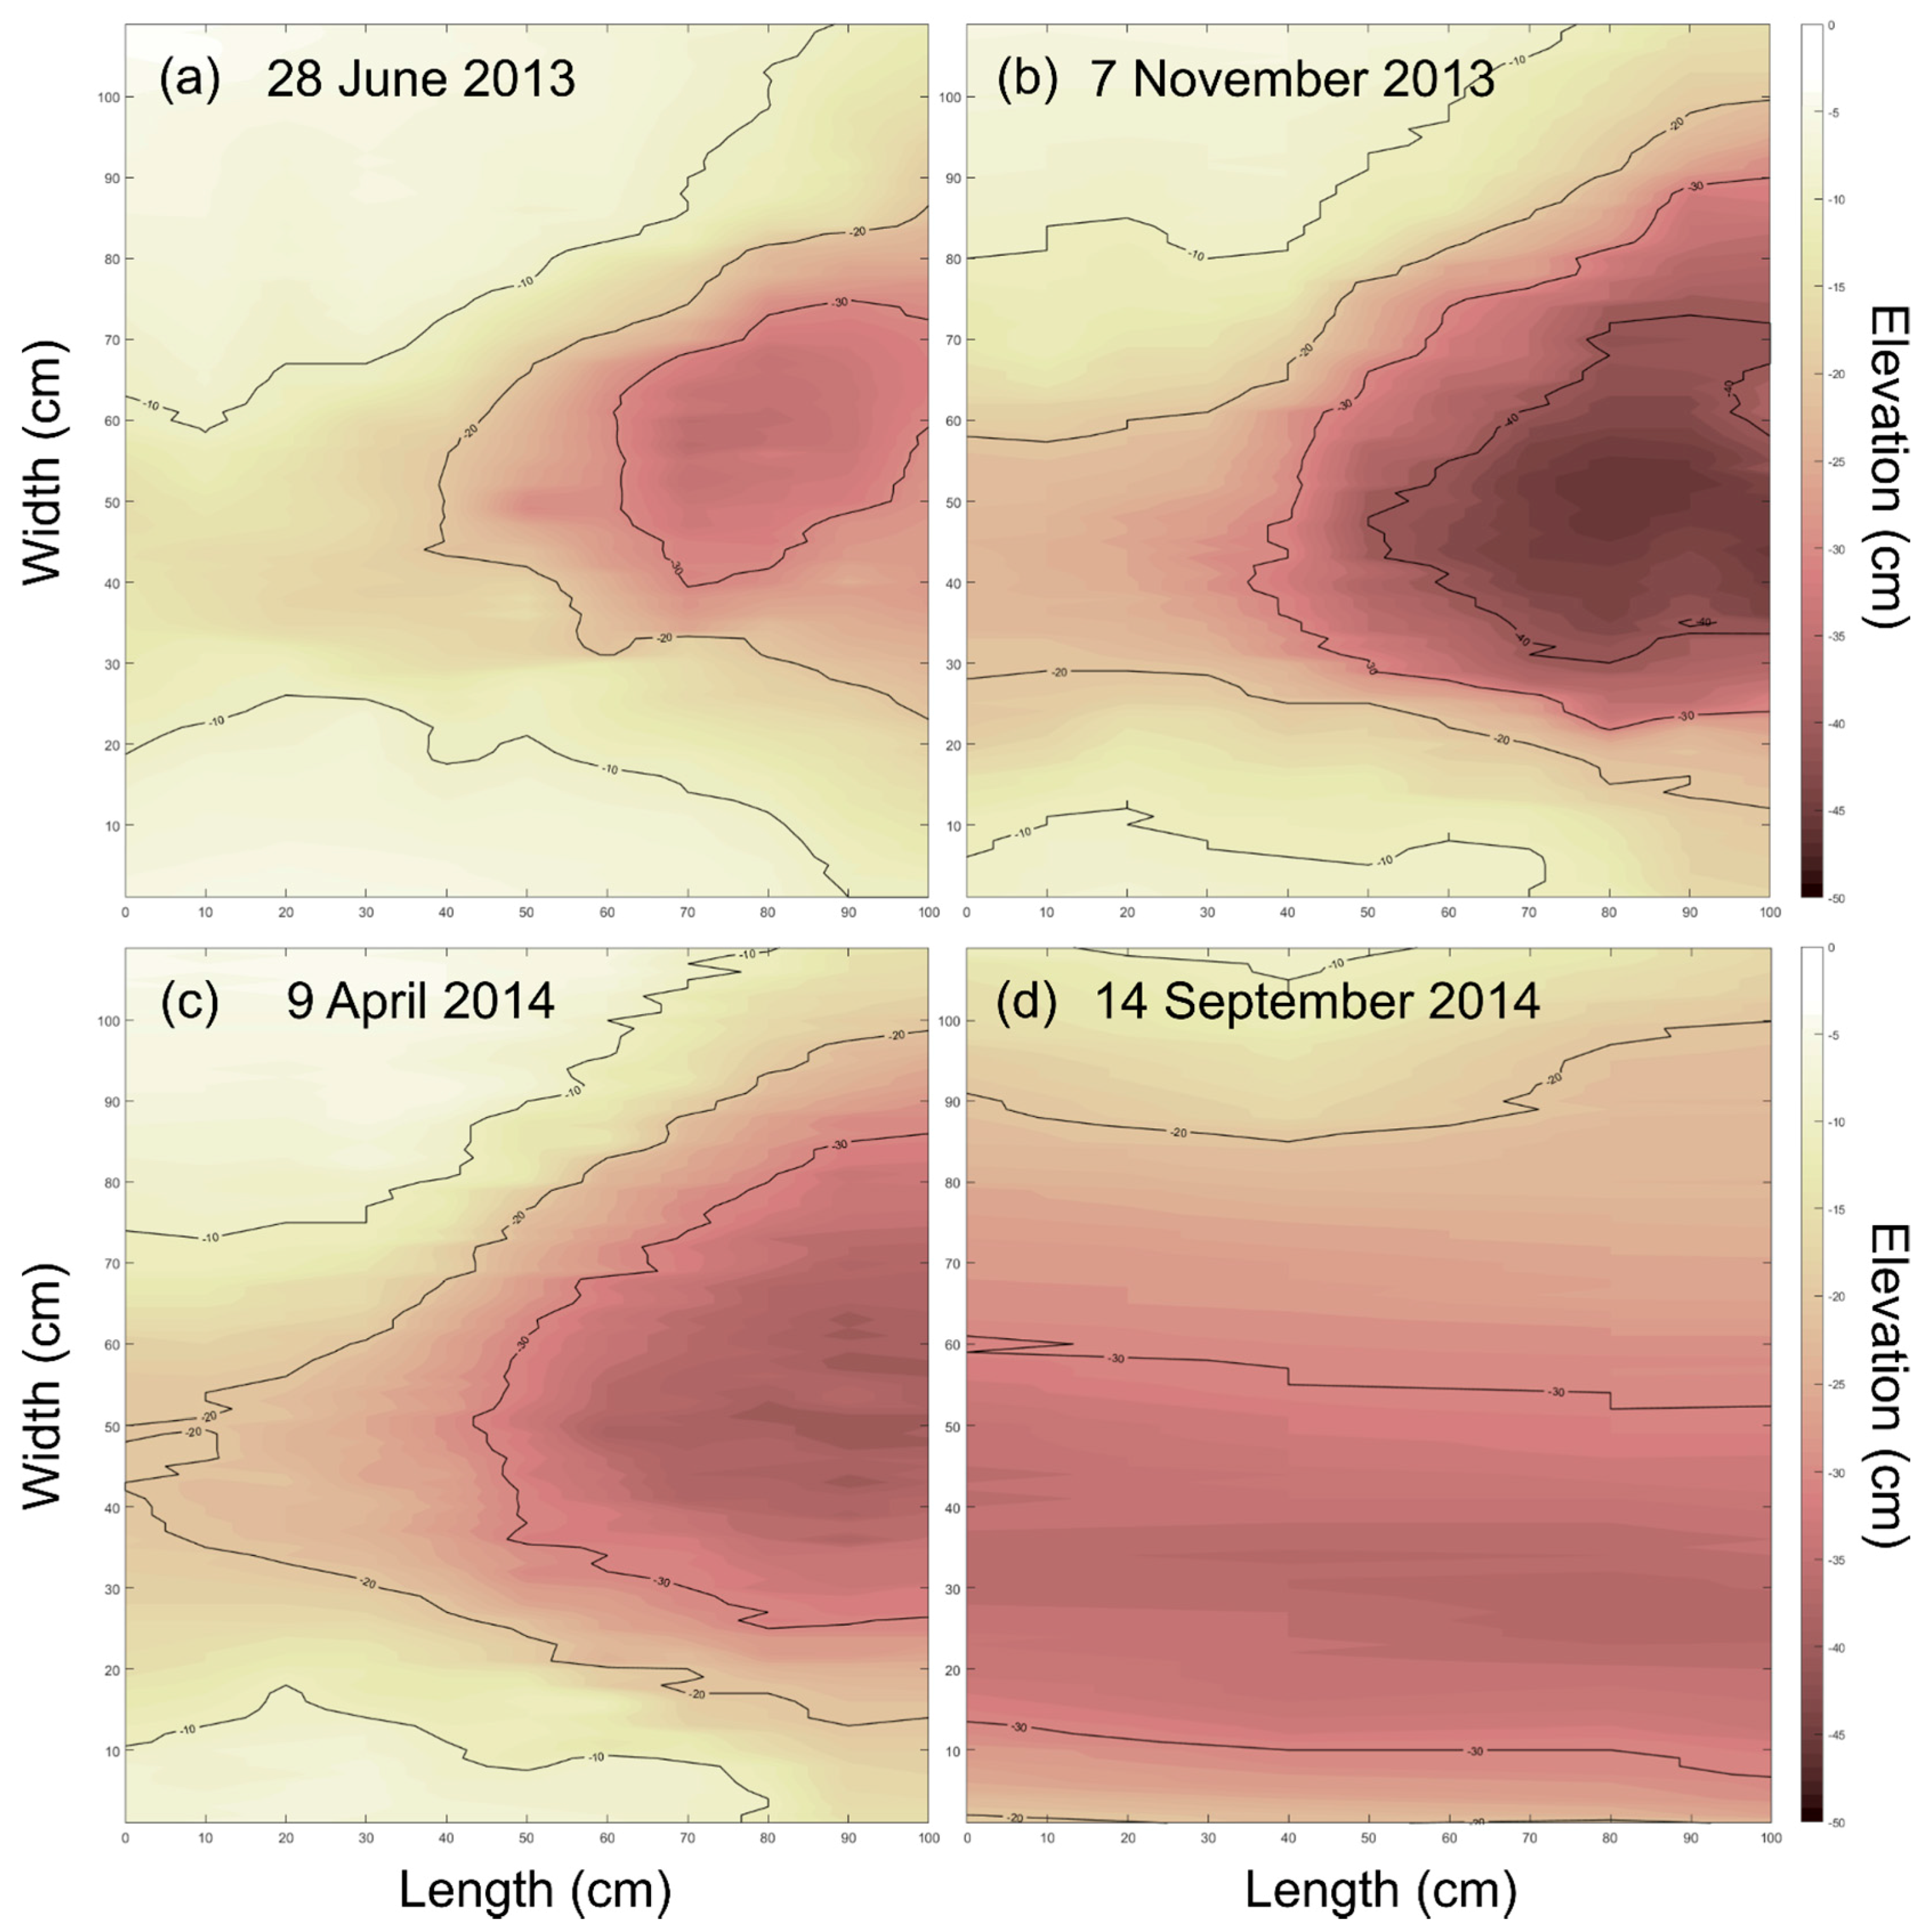
Headcut elevation maps in Figure 4 show seasonal progression of the gully at the beginning and end of 2013 and 2014 campaigns. At the beginning of the study in 2013, the nick point of the gully was well defined with the headcut at about 50 cm and a splash pool at 75 cm marks on the base platform (Figure 4a). The elevation drop at the nick point was about 20 cm and the splash pool area was around 20 × 20 cm2.
After one growing season, the headcut area became deeper by 12 cm and wider by 15 cm, whereas the uphill rill started to cut deeper into the soil connecting with the drop point into the splash pool (Figure 4b). The months of cold weather between November 2013 and April 2014 slightly extended the splash pool area and had about 5 cm of sediment deposited in it, however, the nick point stayed at the same place (Figure 4c). Rainfall events during the summer of 2014 generated sufficient runoff into the gully, which eroded the area immediately uphill and connected the incoming rill with the splash pool. As a result, the headcut nick point moved upstream and away from the base platform coverage (Figure 4d), converting the headcut area into a channelized part.
3.3. Elevation Changes along Ephemeral Gully
Elevation profiles at the 10-cm mark on the base platform are shown in Figure 5 for seven representative survey periods. Surveys for the periods P3–P7 between 6 August 2013 and 9 April 2014 were combined into a single thick blue curve due to small changes of surface elevations. In 2013, only a single sizable change was observed between field visits on 11 July and 6 August. During the 26-day period (P2 in Table 1), there were 11 wet days with 17 rainfall events. Total precipitation of 270 mm generated 131 mm of runoff (runoff coefficient CRO = 0.49), mainly in late July, which caused erosion of 1 cm on the sides and almost 15 cm in the center of the gully. The drop was consistent for all cross-sections throughout the base platform in the headcut. Total mass of lost soil from the headcut alone during that period was estimated at 124 kg with the sediment load of 0.10 tn/ha. In August of 2013, 146 mm of rainfall in P3 did not cause erosion, although generated 82 mm of runoff into the gully (CRO = 0.56). The events during periods P4, P5 and P6 had no effect on the headcut while forced a deposition of 666 kg of sediment at the lower part of the channel. Freezing and melting processes during winter of 2014 (P7) smoothed soil surface in the headcut but did not force the gully to advance (Figure 4b,c). Small rainfall events combined with low temperatures in periods P7, P8 and P9 slightly eroded the east bank by 5 cm and shifted the thalweg to the east by 10 cm, but did not deepen the gully (Figure 5). High sediment deposition during periods P6 and P8 was partially caused by the impact of farming equipment driving across parts of the gully channel during harvesting and fertilizer application operations resulting in 571 kg and 1031 kg of soil accumulation.
A substantial change in elevation occurred during a sequence of rainfall events in the first half of June in period P10. The depth increased by 10 cm on the sides and close to 15 cm in the thalweg area in CS1. The total soil loss from the headcut area was estimated at 232 kg with the load of 0.19 tn/ha. In addition, most of the sediment deposited in periods P5, P6, and P8 was moved downstream from the channel (erosion of 1937 kg) and banks were undercut forcing their sloping, and gully deepening and widening.
While the headcut was contained within the pin-frame coverage for the duration of the whole year in 2013, runoff events in June 2014 (P10) forced the headcut to move uphill from the pin-frame coverage (curves for 31 May and 27 June 2014 in Figure 5). After June 2014, the splash pool below the headcut was converted into a channelized part of the gully and started to exhibit the behavior similar to cross-sections CS1 to CS4. The following runoff events caused gully depth fluctuations due to deposition of incoming sediment from the sheet and rill erosion as result of the insufficient power of runoff to fully transport it through the whole length of the gully. The runoff events at the beginning of September 2014 (P11) moved the accumulated in July sediment further downstream.
3.4. Daily Climate Dataseries
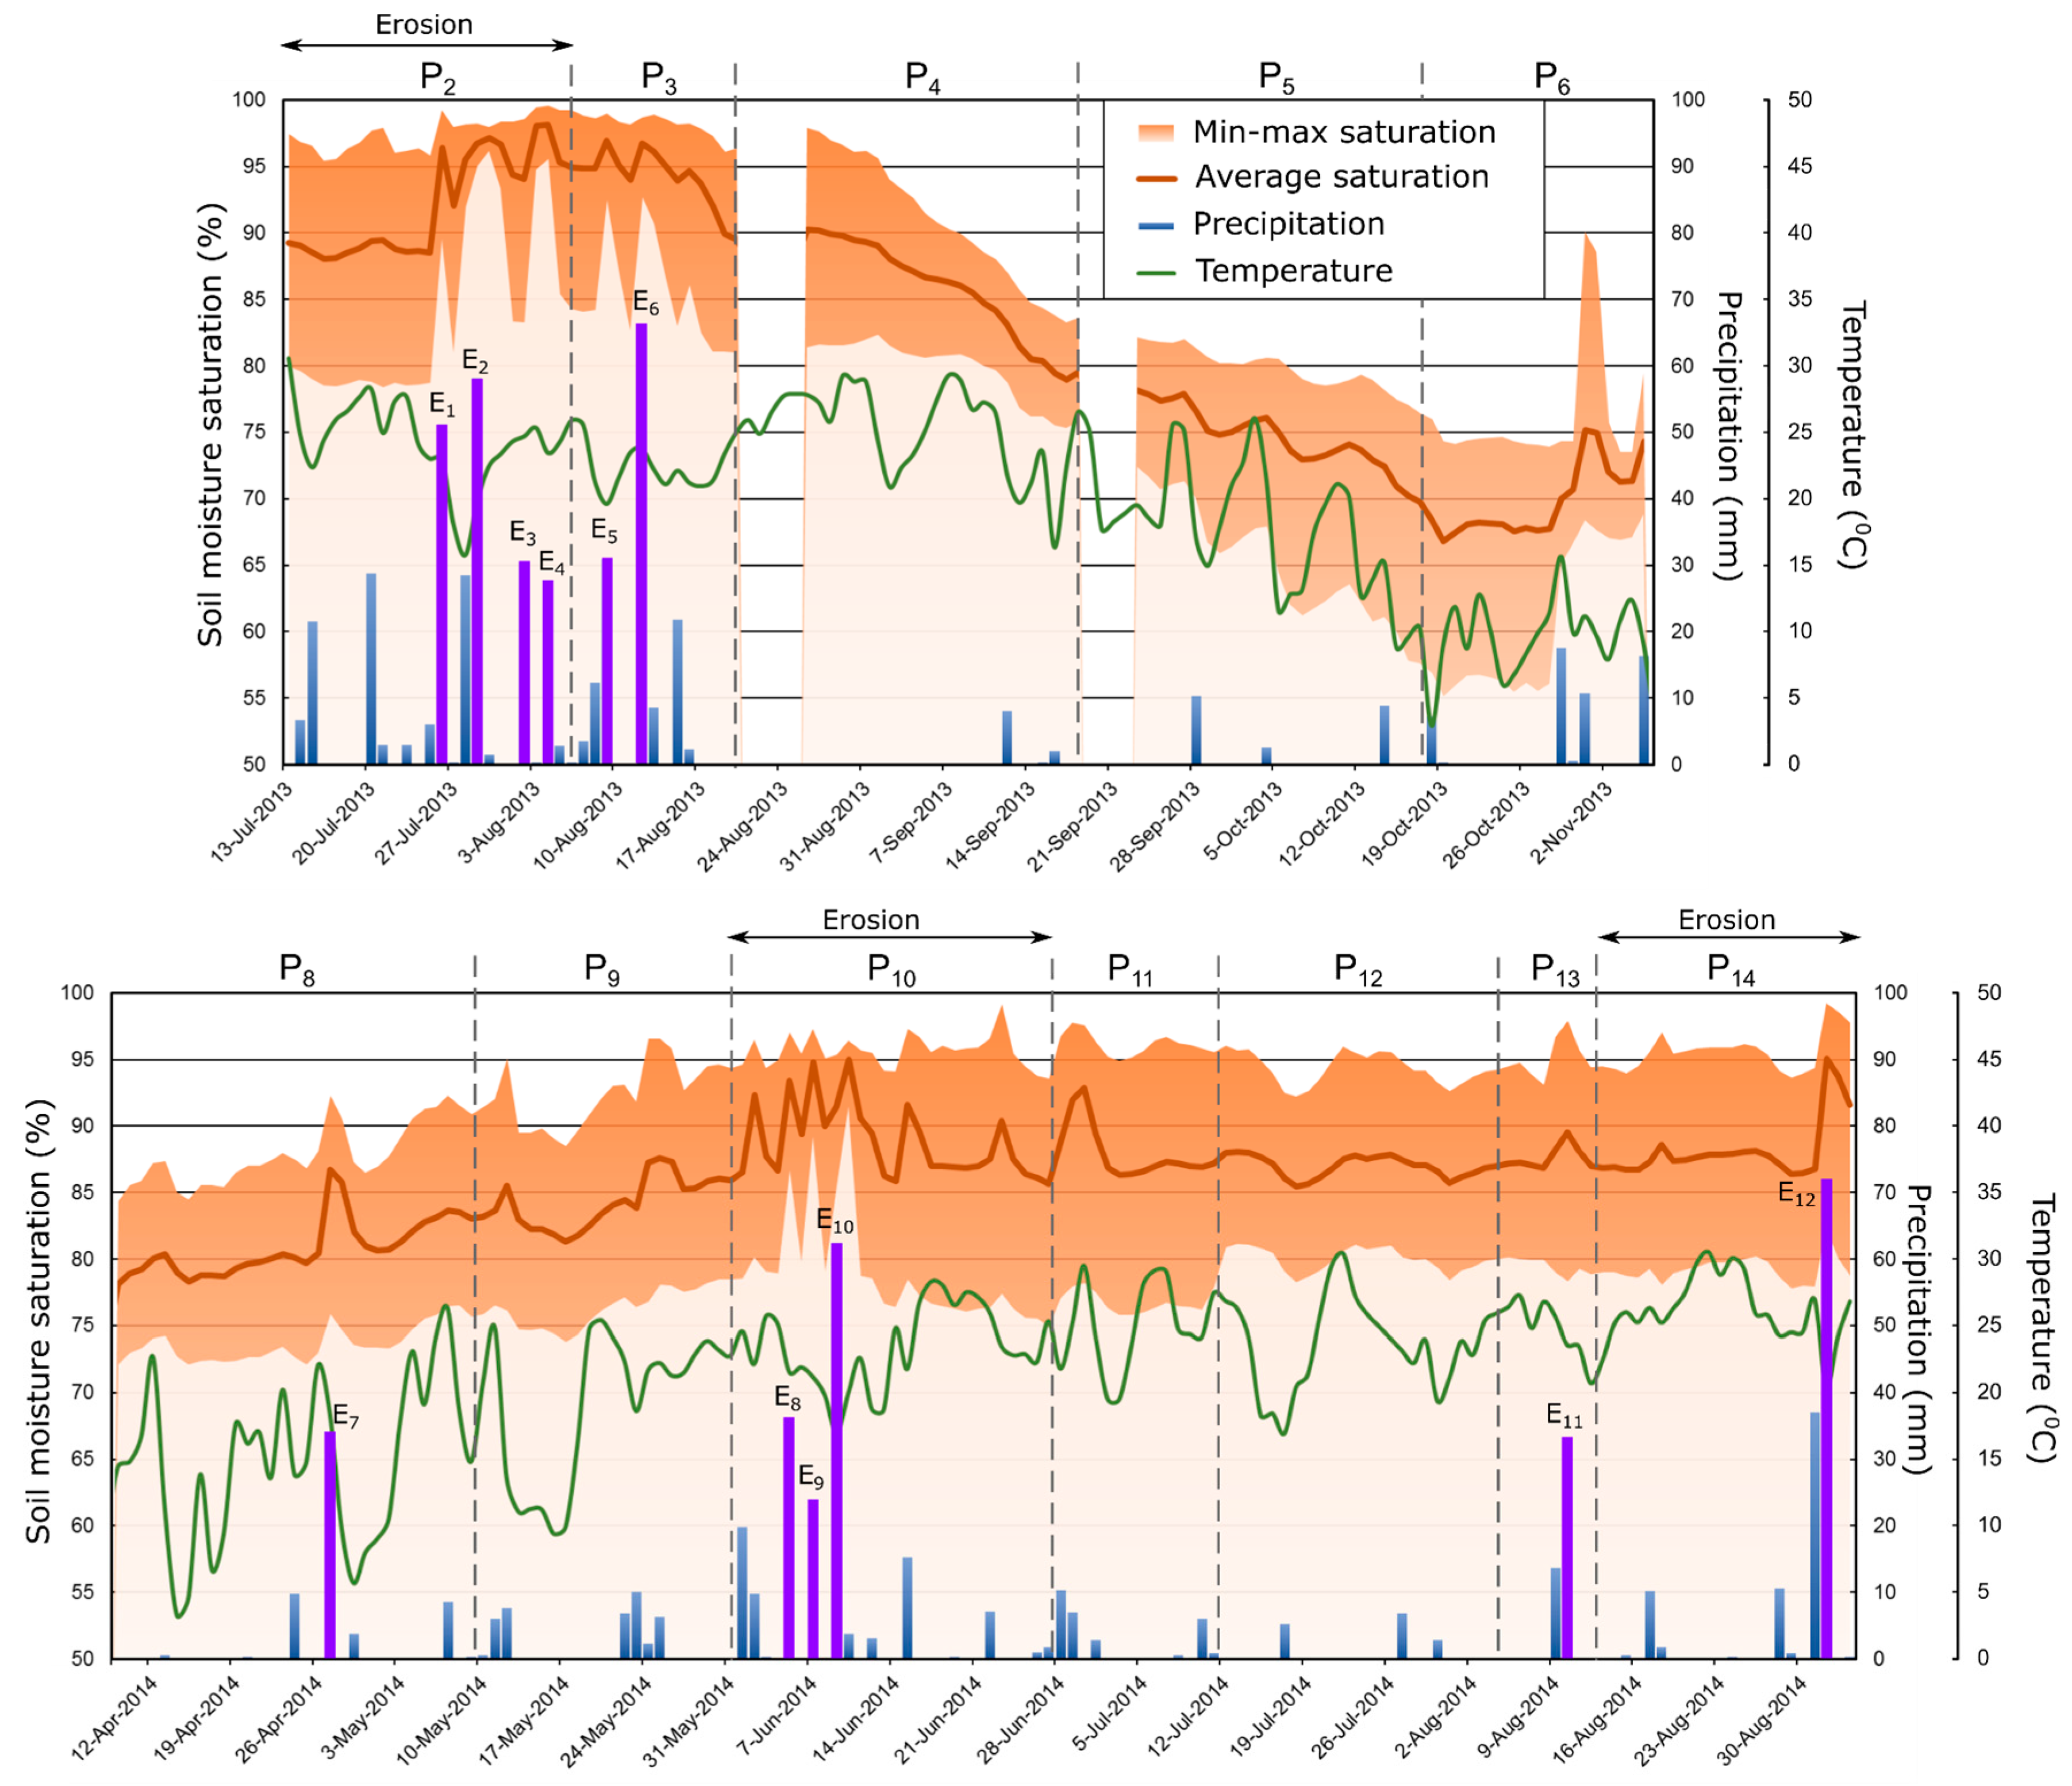
Changes in an ephemeral gully depend on the characteristics of rainfall events and specific field conditions. Daily time series of precipitation, air temperature, and soil moisture content are presented in Figure 6. The survey dates are identified by vertical dash lines. Data collection was interrupted during two periods in 2013 due to battery malfunction (19–24 August; 18–23 September) affecting the data logger operation; however, no rainfall and changes to ephemeral gully were detected. Data for winter period P7 are not presented in Figure 6. Readings from eight soil moisture sensors at the depths of 5 cm, 20 cm and 50 cm showed a range of soil moisture condition around the gully.
Of the 291 monitored days in 2013 and 2014 field campaigns (excluding winter period P7), there were recorded 51 wet days and 61 rainfall events with 977 mm of total rainfall. In 2013, the majority of rainfall (416 mm) occurred in periods P2 and P3 in July and August when crop had established canopy cover, whereas in 2014 a series of high intensity rainfall events occurred in early June (P10, 85 mm) when crop was in its early growing stage, and soil was poorly protected by vegetation. Strong events in early September 2014 (P14, 131 mm) also had an impact on soil erosion.
For all periods except P5 and P6, the measured daily average soil moisture content was above 75%. The range of soil moisture content was within 15% to 20% for most days excluding eight multi-day periods in 2013 and 2014, in which the lower end of the soil moisture range increased to above 87%. During these days, soil around ephemeral gully profile was considered fully saturated. Six of these eight periods occurred during periods P2 and P10 of positive gully erosion.
Seventeen days had daily rainfall higher than 20 mm (Figure 6) with 21 identified individual rainfall events. Based on the results from the WEPP model, it was found that only 12 events from 12 days had generated surface runoff. Rainfall on these 12 days is highlighted by purple bars in Figure 6, and the selected 12 events presented in Table 2. Six critical events E1 to E6 in 2013 occurred in periods P2 and P3 of July and August, while six events E7 to E12 of 2014 were distributed over four periods P8, P10, P13 and P14 from April to September.
According to field surveys (Table 1), gully erosion occurred during periods P2, P10, and P14, which makes the surface runoff generated during events E1–E4, E8–E10 and E12 responsible for soil detachment and sediment transport within the gully. Events E5, E6, E7 and E11 were not able to cause erosion although the soil was highly saturated. Interestingly, event E6 had one of the highest daily rainfall (67 mm) and produced high surface runoff (11 mm), but was not able to cause changes in the ephemeral gully. Events E1–E6 and E8–E10 exhibited a substantial reduction in the range of soil moisture content and an increase in its average value, which contrasted with events E7, E11, E12 that had only a minor increase.
3.5. Significant Runoff Events
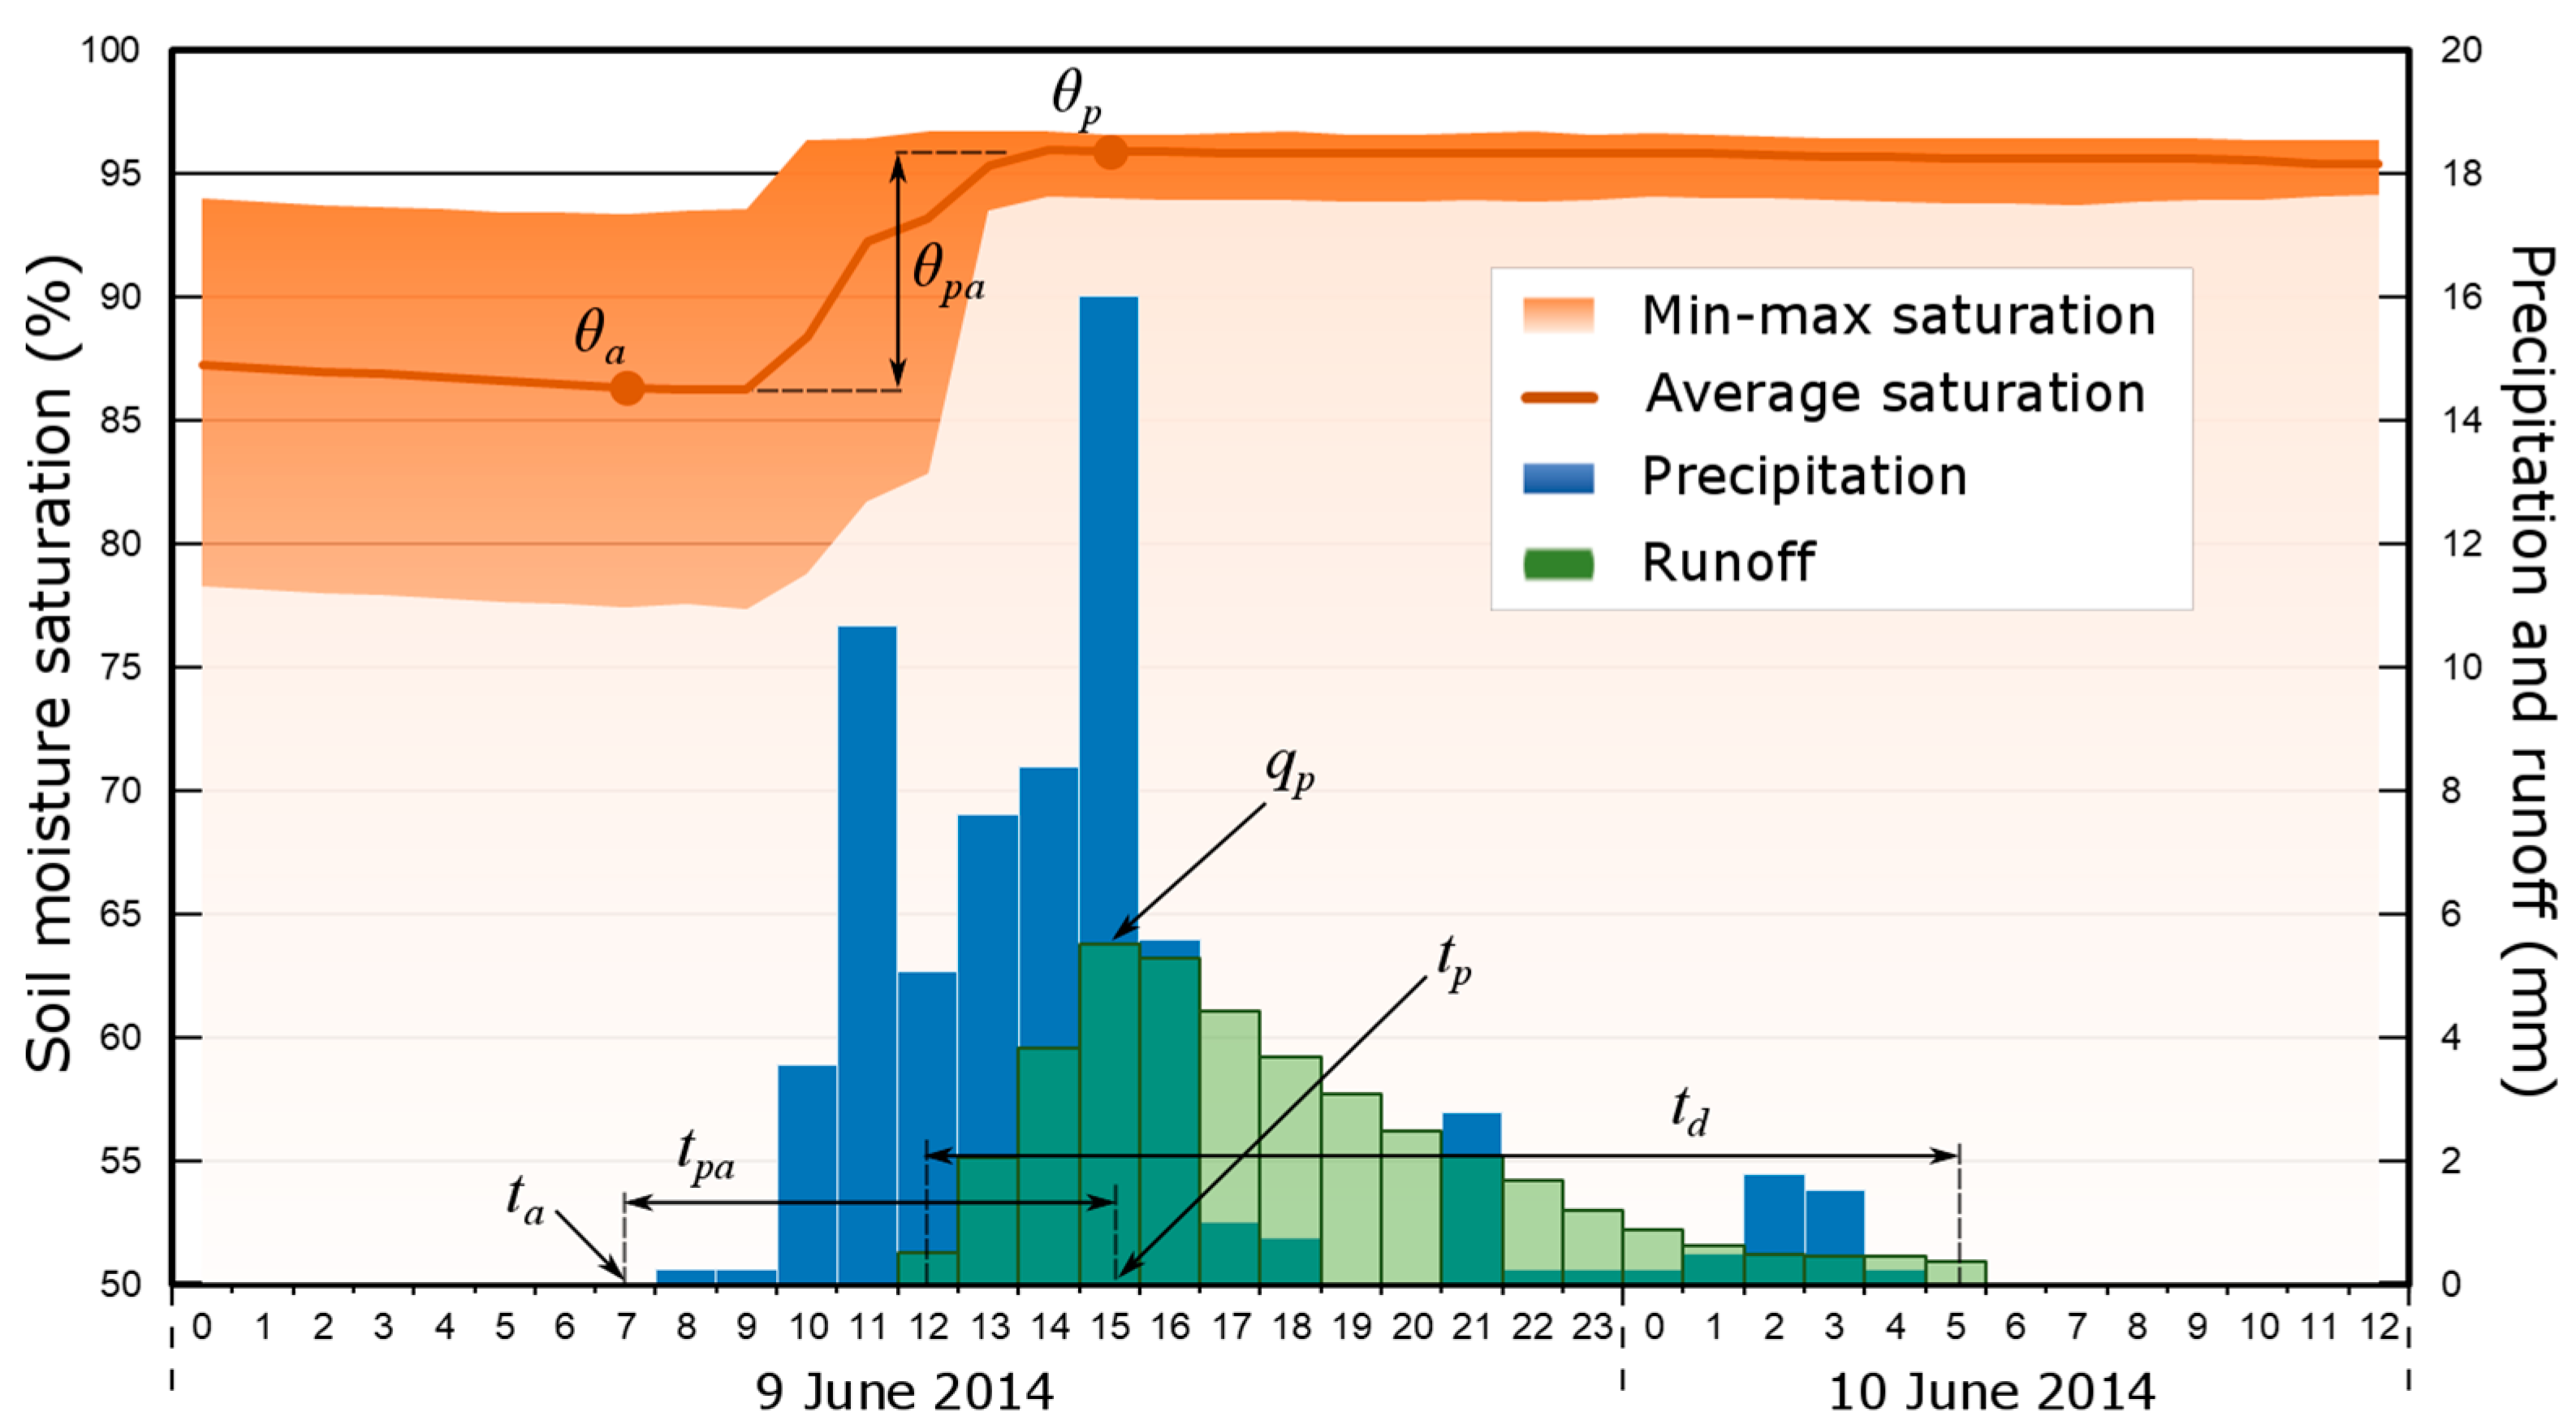
Twelve significant runoff events, selected on the criteria of at least 20 mm daily precipitation and non-zero surface runoff, were analyzed at the hourly time-step using measured rainfall and soil moisture content and WEPP-simulated runoff hydrograph. Each event had unique hydrologic and erosion characteristics of runoff hydrographs (Table 2). An example of hourly rainfall, runoff and soil moisture distributions for runoff event E10 is shown in Figure 7. The duration of runoff (td) ranged from 4 to 17.8 h with an average time of 7.1 h, whereas the time from rainfall to peak runoff (tpa) ranged from 2 to 10 h on average of 4.4 h. The event E2 had much longer time tpa to peak runoff (10 h) than the other events while having below average duration of runoff td. In addition, high antecedent soil moisture content (96%) and low rainfall rates prior to peak runoff time tp during event E2 were able to fully saturate the soil and create favorable conditions for surface runoff while making soil less cohesive and susceptible to soil detachment. In contrast, event E10 was unique by having very long runoff duration (17.8 h) continuously supported by rainfall that lasted 20 h (Figure 7). Except for the event E2 with its unique rainfall pattern prior to tp, all other events yielded longer runoff duration td than time to peak tpa while having lower antecedent soil moisture content.
Events E1, E6 and E12 generated peak discharges qp into the gully much higher than other events, which translated into high depths of peak channel flow hp within the gully. While events E1 and E12 occurred during periods P2 and P14 with visible gully erosion, event E6 occurred during the period P3 when no erosion was detected. Therefore, while peak surface flow discharge is important for generating maximum shear stresses on soil surface during an event, the actual soil erosion may depend on other factors including soil moisture content that change during the event. This will require developing a holistic approach to consider the interactions between channel flow and dynamic soil characteristics.
4. Discussion
4.1. Characteristics of the Critical Shear Stress
The analysis of field measurements and surface modeling results revealed twelve runoff events that created favorable conditions for soil erosion within the ephemeral gully. The events produced peak surface runoff that was sufficient to generate hydraulic shear stresses higher than the base critical shear stress of 3.5 Pa for silty clay soil. According to the excess shear stress Equation (1) with the base critical shear stress value, all of these twelve events should be able to cause soil erosion within the gully. However, field measurements showed that only events during periods P2, P10 and P14 made substantial changes in gully profiles, while the other events either did not produce erosion in any part of the gully or showed soil accumulation. This points to the fact that modifications to the critical shear stress definition are required.
The laboratory experiments on soil erosion [57,58,59] and tests on soil erodibility parameters [60,61] among other evidence in the literature showed the dependency of erodibility parameters, including τC, on soil properties other than the texture in (3), such as soil moisture content, pore pressure, seepage forces, soil cohesion, etc. In addition, Tebebu et al. [29] showed that soil detachment can depend on (antecedent) soil moisture content prior to the beginning of the rainfall event. Following these considerations, the critical shear stress can be expressed as a product of two terms, τC0 and τC1:
where τC0 was defined by (3), and τC1 is a function of event specific soil and peak flowrate characteristics.
Applying (4) to the data from twelve significant runoff events (see Table 2), we propose the following functional form of τC1 depending on the change of soil moisture content from the antecedent condition at ta to that at the peak runoff time tp:
where coefficients β > 0 and b > 0 are constants.
According to (5), the critical shear stress remains close to the base value τC0 if there was a very small change in soil moisture content from antecedent to peak time. This may occur for two conditions: (i) if soil was already pre-wet prior to the rainfall event (antecedent soil moisture content is high), and most rainfall was converted to runoff, or (ii) if the raising limb of runoff hydrograph took long time, hence runoff reached its peak value very slow, and the denominator tpa in (5) had high value. In both cases, soil becomes very saturated before the peak runoff is reached, which reduces soil cohesion and promotes soil particle detachment. This situation is consistent with the findings by Nouwakpo et al. [58], which postulated that under saturated condition channel bottom appeared to behave as a fluidized bed with rates of soil erosion much higher than defined with standard or base critical shear stress. For other situations when i > 0 in (5), τC is larger than the base value τC0, which requires higher runoff rates and larger values of τ to cause soil erosion.
4.2. Applicability of the Critical Shear Stress Function to Field Experiment
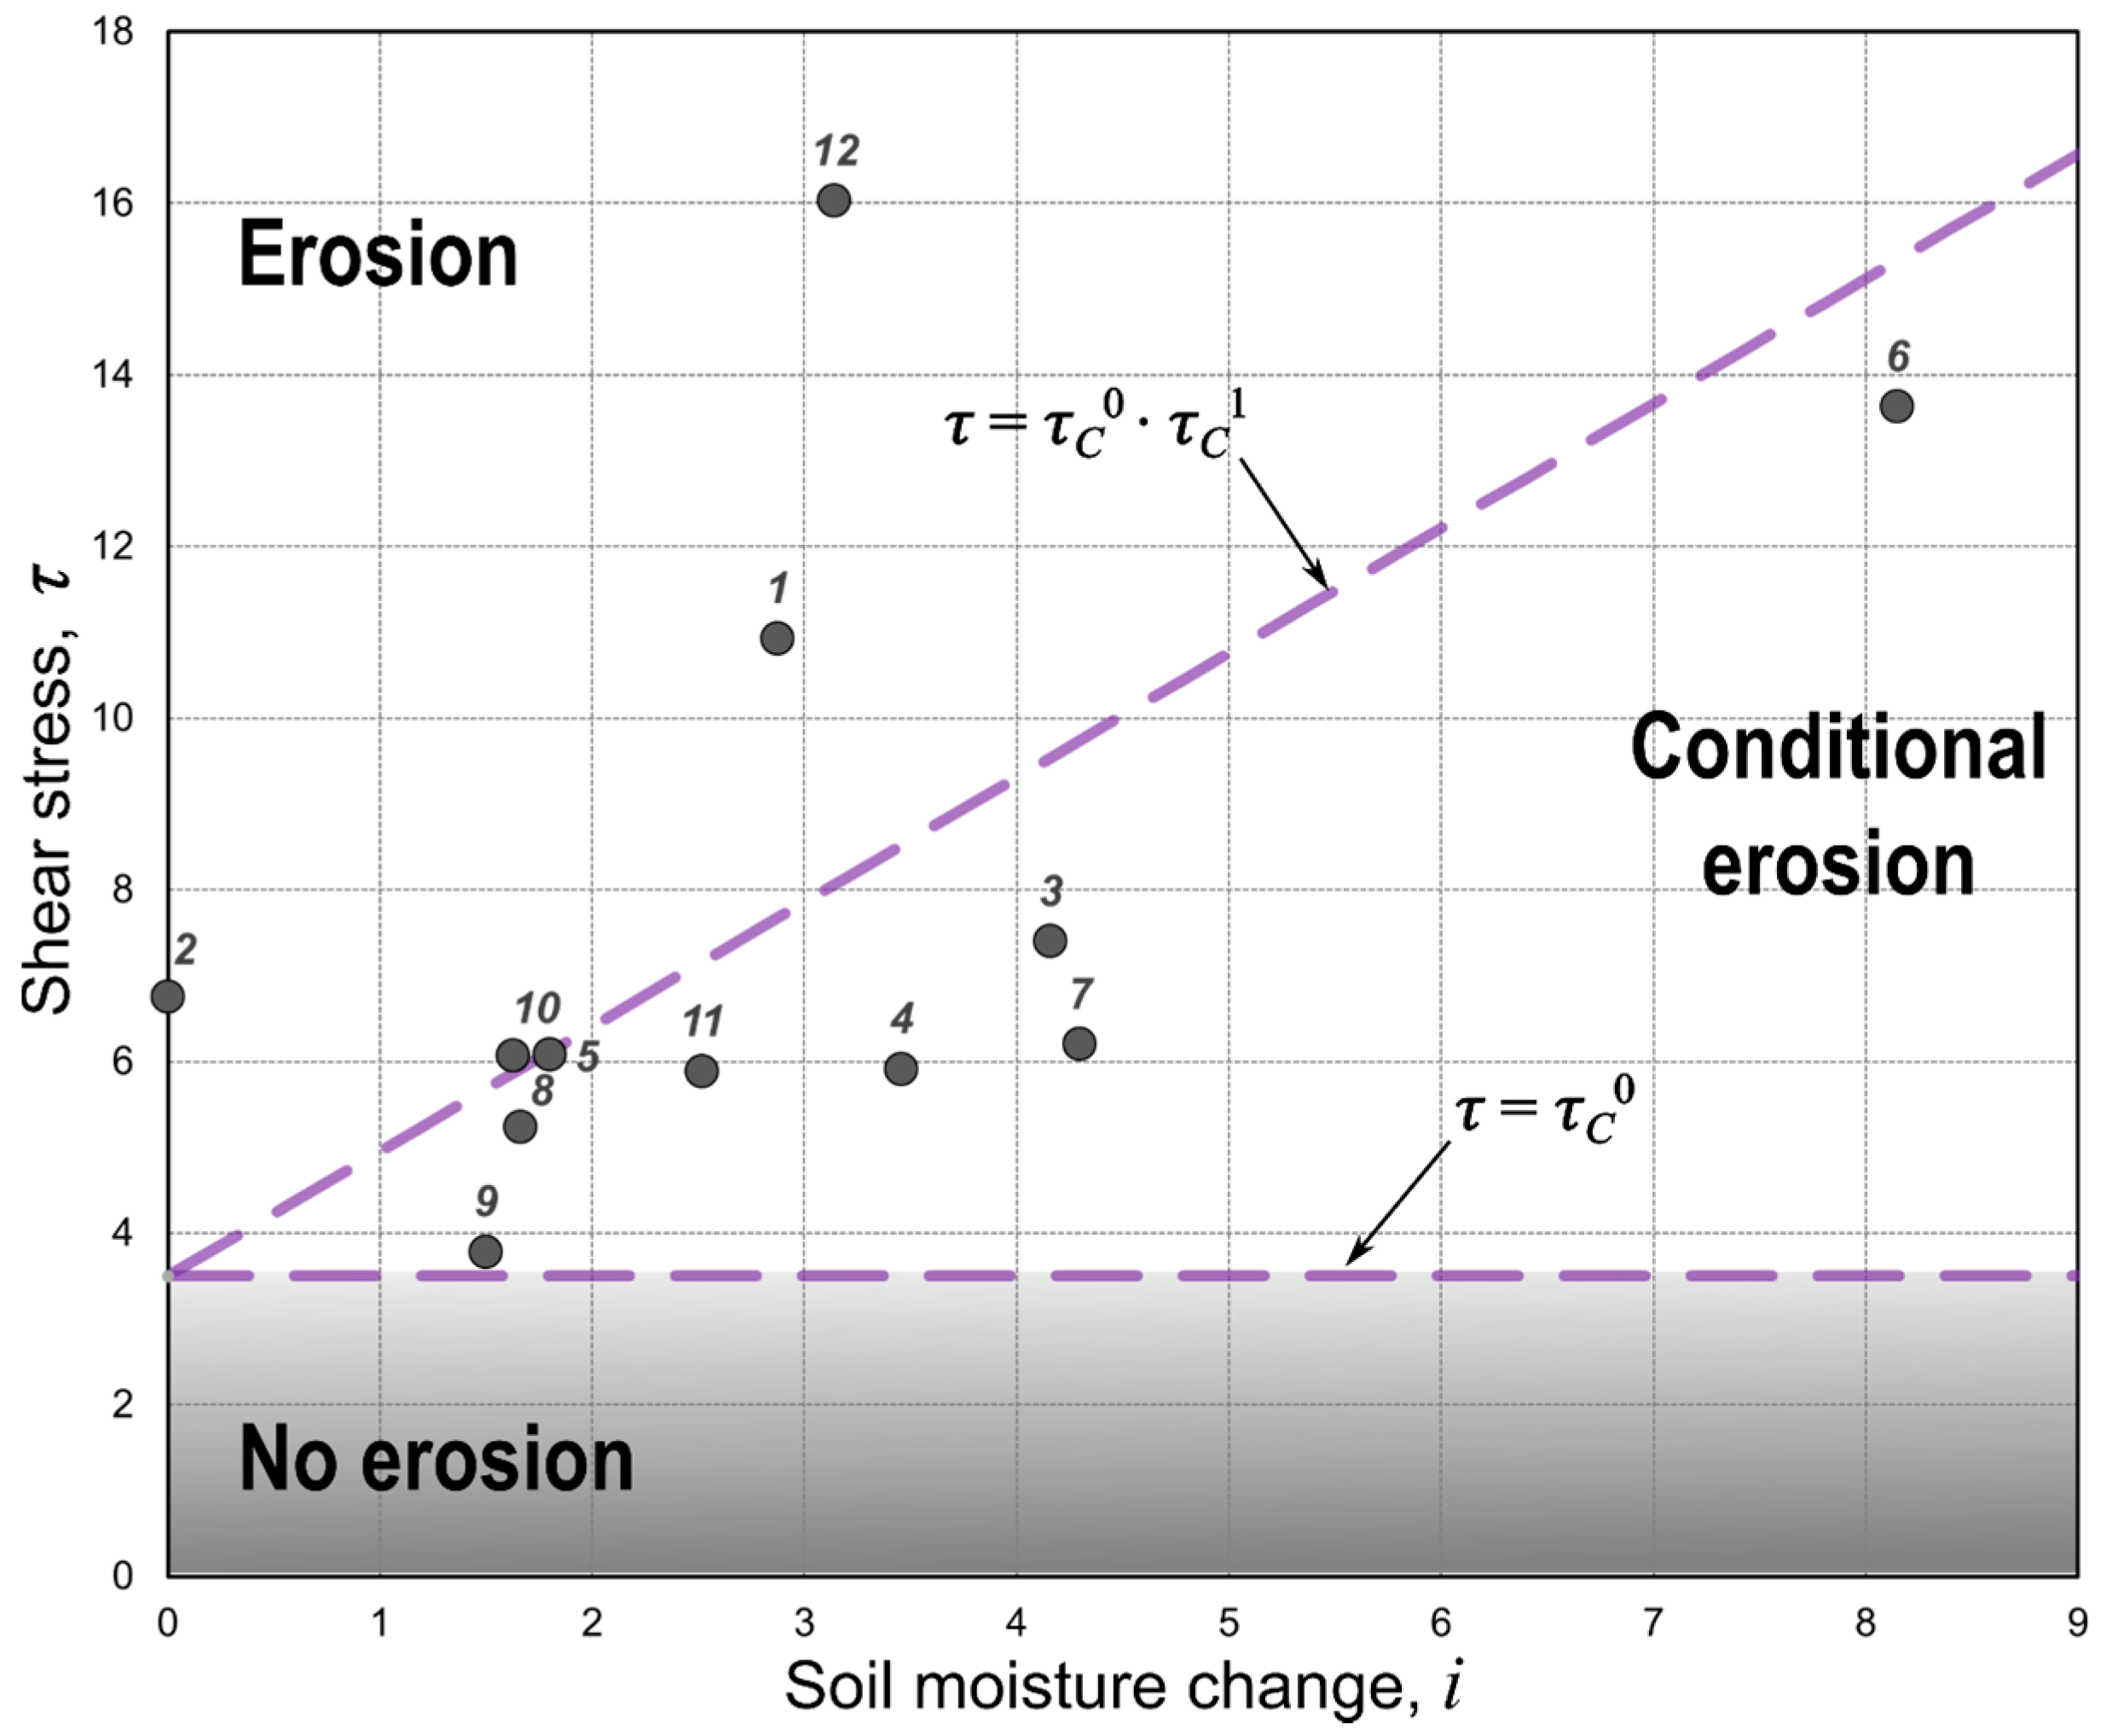
The proposed functional dependency of τC on soil moisture change i in (5) was tested on the collected data for 12 significant runoff events (Figure 8). The values of shear stress τ acting on the bottom of the gully were determined based on the Equation (2) using peak runoff rates, shape and slope of the channel, and flow depth specific to each event (Table 2). The rate of soil moisture change i was calculated using the recorded soil moisture data and tpa.
For all events τ was found greater than τC0 = 3.5, while i varied from 0 to 8.1. Ten events had a value of i between 1.5 and 4.5 with the exclusion of events E2 and E6. Event E2 had high antecedent soil moisture content that forced i to be close to zero with τ = 6.7. Event E6 had low tpa, low θa, which caused i to be greater than 8 and had a high τ of 13.6. In addition, event E12 had extremely high qp and τ = 16, but low θa and tpa.
Based on the characteristics of eight events during three survey periods—P2, P10, P14—when gully erosion was detected, four events were found to be more likely to cause soil erosion than the other events: E1 and E2 in P2, E10 in P10, and E12 in P14. Event E12 was the only runoff event in P14; E10 had the highest τ comparing to other runoff events in P10; E1 had the highest τ in P2, while E2 exhibited the fully saturated condition prior to the rainfall. These events are presented in the upper left half of the chart in Figure 8, where the excess shear stress Equation (1) would show soil erosion if the critical shear stress coefficient were to depend on soil moisture change i in Equation (4).
To follow the framework and functional equations defined above, the whole domain in Figure 8 can be divided into three zones:
- (i)
- a zone of definite erosion (τ > τC0τC1, τC1 > 1);
- (ii)
- a zone of no erosion (τ < τC0); and
- (iii)
- a zone of conditional erosion (τC0 < τ < τC0τC1, τC1 > 1).
The four events that caused soil erosion (E1, E2, E10, E12) fall into the zone of definite soil erosion if b = 1 and β = 0.4 in Equation (5). This yields the general form of critical shear stress as τC = 3.5(1 + 0.4i). The other significant events form Table 2 were placed into the zone of conditional erosion. Other events from 2013 to 2014, not presented in Table 2, had either no runoff (τ = 0) or low qp and fell into the zone of no erosion.
4.3. Factors Affecting Ephemeral Gully Erosion
Many intra-storm factors can contribute to soil loss within an ephemeral gully. The most considered are peak runoff depth and peak runoff intensity due to their effect on submerged shear forces that act on soil particles in a headcut zone from the inflowing overland water. High antecedent soil moisture content decreases infiltration, reduces time of concentration, and promotes surface runoff from a contributing catchment to reach a higher peak rate faster. For silty clay loams specifically, higher soil moisture content generally decrease cohesion between soil particles, which may affect soil erodibility properties.
This study evaluated the change in soil moisture content during a rainfall event and showed that factors related to soil moisture condition can affect soil detachment as much as the hydraulic shear forces. The change in soil moisture can be viewed as an indicator of how rapid soil becomes fully saturated and loses its cohesion, which forces a channel bed to behave similarly to a fluidized bed with much higher potential for particle detachment [58]. Similar findings regarding a link between antecedent moisture content and erosion rates were reported by Tebebu et al. [29].
The mechanism of the impact of soil moisture content on soil erosion has yet to be fully understood but studies have reported the influence of subsurface seepage forces on soil stability and the decrease of critical shear stress [58,60,62]. These forces can cause side walls to slide and channel to meander. Specific to the studied field, factors such as a high water table and a compacted layer below the soil surface (or a plow pan) could also contribute to gully erosion by decreasing the time taken to reach full saturation around the gully. Planted soybeans in 2014, compared with grain sorghum in 2013, have a higher rainfall interception and generally cause lower runoff thus decreasing the hydraulic forces of flow in the gully.
Future studies in other agriculturally-dominated areas are needed to develop a better understanding of the physical mechanisms associated with gully progression. In addition to the established factors of antecedent soil moisture content and peak runoff rates, other physical factors that vary during the event must be considered and analyzed both experimentally and by modeling. These will provide additional insight into the gully erosion process and improve mitigation strategies for soil loss reduction from agricultural fields.
5. Conclusions
This study examined intra-storm characteristics and the impacts of surface runoff and soil moisture on the development of an ephemeral gully on a cultivated crop field under no-till management in central Kansas. Data collection included continuous sub-hourly precipitation, soil moisture content, soil temperature, and 15 field surveys of ephemeral gully cross-sectional profiles in headcut and channelized parts. Soil losses and sediment accumulation within the gully were calculated based on cross-sectional profiles for each period between the surveys. Rainfall excess from the contributing catchment was calculated with the WEPP model for all runoff events and validated on channel flow measurements. Analysis of hourly and daily results were conducted for all precipitation events during crop growing seasons in 2013 and 2014 and ephemeral gully conditions were documented. Factors affecting soil erosion within the ephemeral gully were discussed.
The results of the study can be summarized as follows:
- Of 14 survey periods, soil erosion was observed during 3 periods in headcut and 4 periods in the channelized part of the ephemeral gully, whereas sediment accumulation was detected during 2 periods in headcut and 6 periods in the channelized part. Fluctuations of soil loss and accumulation in the headcut area were mainly caused by physical interactions between hydraulic shear forces and the soil surface, soil condition, and sediment load. In addition to physical factors similar to those in the headcut part, the channelized part of the gully experienced elevation changes due to the side wall collapsing, channel meandering, farming operations, and soil crusting.
- Twelve significant runoff events from 6 survey periods were identified to create hydraulic shear stresses at the peak flow rate that were higher than the base critical value. Under standard considerations all these events must cause soil erosion, however, it is contradictory to have observed erosion in 3 out of the 6 periods.
- Intra-storm flow and soil characteristics provided additional insight into channel development. Hydraulic shear stress and soil moisture content at peak flow rate, antecedent soil moisture content, and channel geometry were examined during 12 significant runoff events. The analysis provided the basis on which to extend the definition of the critical shear stress and explain the reasons for soil erosion for 4 relevant events.
- One functional form of the critical shear stress function was suggested by incorporating the changes in soil moisture content from its antecedent condition with the time of highest runoff intensity and testing it with collected data. This form allowed the excess shear stress equation to define the specific function of τ versus i and determine the zones of definite erosion, conditional erosion, and no erosion for the studied ephemeral gully.
Acknowledgments
This material is based on work partially supported by the USDA National Institute of Food and Agriculture (NIFA) under Agreement No. 2011-51130-31128, Kansas NRCS-CIG grant No. 69-6215-13-0003, Hatch Project No. S-1063, and the Kansas Agricultural Experiment Station, Manhattan, Kan., Contribution No. 18-114-J. The authors thank Gerard Kluitenberg for many discussions and valuable comments regarding ephemeral gully erosion processes, Philip Barnes for assisting with the ISCO sampler, and Jonathan Zeller for helping with the design and construction of the pin-frame. The authors are grateful to the owner of the studied field for adjusting farming operations and allowing use of the area around the ephemeral gully for research. Constructive comments by two anonymous reviewers are greatly appreciated. Publication of this article was funded in part by the Kansas State University Open Access Publishing Fund.
Author Contributions
Vladimir R. Karimov and Aleksey Y. Sheshukov conceived and designed the field experiments, performed the simulations, analyzed the data, and wrote the paper.
Conflicts of Interest
The authors declare no conflict of interest.
References
- Panagos, P.; Borrelli, P.; Meusburger, K.; Yu, B.; Klik, A.; Jae Lim, K.; Yang, J.E.; Ni, J.; Miao, C.; Chattopadhyay, N.; et al. Global rainfall erosivity assessment based on high-temporal resolution rainfall records. Sci. Rep. 2017, 7, 4175. [Google Scholar] [CrossRef] [PubMed]
- Keesstra, S.D.; Bouma, J.; Wallinga, J.; Tittonell, P.; Smith, P.; Cerdà, A.; Montanarella, L.; Quinton, J.N.; Pachepsky, Y.; van der Putten, W.H.; et al. The significance of soils and soil science towards realization of the United Nations Sustainable Development Goals. SOIL 2016, 2, 111–128. [Google Scholar] [CrossRef]
- Foster, G.R. Understanding Ephemeral Gully Erosion. In Soil Conservation: Assessing the National Resources Inventory, Vol. 2; Committee on Conservation Needs and Opportunities, National Research Council; National Academy Press: Washington, DC, USA, 1986; pp. 90–125. [Google Scholar]
- Fox, G.A.; Sheshukov, A.Y.; Cruse, R.; Kolar, R.L.; Guertault, L.; Gesch, K.R.; Dutnell, R.C. Reservoir Sedimentation and Upstream Sediment Sources: Perspectives and Future Research Needs on Streambank and Gully Erosion. Environ. Manag. 2016, 57, 945–955. [Google Scholar] [CrossRef] [PubMed]
- Hargrove, W.L.; Johnson, D.; Snethen, D.; Middendorf, J. From Dust Bowl to Mud Bowl: Sedimentation, conservation measures, and the future of reservoirs. J. Soil Water Conserv. 2010, 65, 14A–17A. [Google Scholar] [CrossRef]
- Rodrigo-Comino, J.; Wirtz, S.; Brevik, E.C.; Ruiz-Sinoga, J.D.; Ries, J.B. Assessment of agri-spillways as a soil erosion protection measure in Mediterranean sloping vineyards. J. Mt. Sci. 2017, 14, 1009–1022. [Google Scholar] [CrossRef]
- Soil Science Society of America (SSSA). Glossary of Soil Science Terms 2008; Soil Science Society of America: Fitchburg, WI, USA, 2008. [Google Scholar]
- Taguas, E.V.; Guzmán, E.; Guzmán, G.; Vanwalleghem, T.; Gómez, J.A. Characteristics and importance of rill and gully erosion: A case study in a small catchment of a marginal olive grove. Cuad. Investig. Geográfica 2015, 41, 107. [Google Scholar] [CrossRef]
- Daggupati, P.; Sheshukov, A.Y.; Douglas-Mankin, K.R. Evaluating ephemeral gullies with a process-based topographic index model. Catena 2014, 113, 177–186. [Google Scholar] [CrossRef]
- Osmond, D.; Meals, D.; Hoag, D.; Arabi, M.; Luloff, A.; Jennings, G.; McFarland, M.; Spooner, J.; Sharpley, A.; Line, D. Improving conservation practices programming to protect water quality in agricultural watersheds: Lessons learned from the National Institute of Food and Agriculture-Conservation Effects Assessment Project. J. Soil Water Conserv. 2012, 67, 122A–127A. [Google Scholar] [CrossRef]
- Valentin, C.; Poesen, J.; Li, Y. Gully erosion: Impacts, factors and control. Catena 2005, 63, 132–153. [Google Scholar] [CrossRef]
- Zhang, Y.; Wu, Y.; Liu, B.; Zheng, Q.; Yin, J. Characteristics and factors controlling the development of ephemeral gullies in cultivated catchments of black soil region, Northeast China. Soil Tillage Res. 2007, 96, 28–41. [Google Scholar] [CrossRef]
- Wells, R.R.; Bennett, S.J.; Alonso, C.V. Effect of soil texture, tailwater height, and pore-water pressure on the morphodynamics of migrating headcuts in upland concentrated flows. Earth Surf. Process. Landf. 2009, 34, 1867–1877. [Google Scholar] [CrossRef]
- Capra, A.; Porto, P.; Scicolone, B. Relationships between rainfall characteristics and ephemeral gully erosion in a cultivated catchment in Sicily (Italy). Soil Tillage Res. 2009, 105, 77–87. [Google Scholar] [CrossRef]
- Römkens, M.J.M.; Wells, R.R.; Wang, B.; Zheng, F.; Hickey, C.J. Soil Erosion on Upland Areas by Rainfall and Overland Flow. In Advances in Water Resources Engineering. Handbook of Environmental Engineering; Yang, C., Wang, L., Eds.; Springer International Publishing: Cham, Swizerland, 2015; Volume 14, pp. 361–405. [Google Scholar]
- Ziadat, F.M.; Taimeh, A.Y. Effect of rainfall intensity, slope, land use and antecedent soil moisture on soil erosion in an arid environment. Land Degrad. Dev. 2013, 24, 582–590. [Google Scholar] [CrossRef]
- Yi, L.; Zhang, W.-C.; Yan, C.-A. A modified topographic index that incorporates the hydraulic and physical properties of soil. Hydrol. Res. 2017, 48, 370–383. [Google Scholar] [CrossRef]
- Daggupati, P.; Douglas-Mankin, K.R.; Sheshukov, A.Y. Predicting ephemeral gully location and length using topographic index models. Trans. ASABE 2013, 56, 1427–1440. [Google Scholar]
- Poesen, J.W.A.; Torri, D.B.; Vanwalleghem, T. Gully Erosion: Procedures to Adopt When Modelling Soil Erosion in Landscapes Affected by Gullying; Morgan, R.P.C., Nearing, M.A., Eds.; Blackwell Publishing Ltd.: Hoboken, NJ, USA, 2011; pp. 360–386. [Google Scholar]
- Deng, J.; Jing, Y.; Yin, D. Soil erosion studies should consider the effect of water erosion on tillage erosion. J. Soil Water Conserv. 2017, 72, 38A–41A. [Google Scholar] [CrossRef]
- Blanco-Canqui, H.; Wienhold, B.J.; Jin, V.L.; Schmer, M.R.; Kibet, L.C. Long-term tillage impact on soil hydraulic properties. Soil Tillage Res. 2017, 170, 38–42. [Google Scholar] [CrossRef]
- Soane, B.D.; Ball, B.C.; Arvidsson, J.; Basch, G.; Moreno, F.; Roger-Estrade, J. No-till in northern, western and south-western Europe: A review of problems and opportunities for crop production and the environment. Soil Tillage Res. 2012, 118, 66–87. [Google Scholar] [CrossRef]
- Pollock, C.; Reeder, R. No-Till—Plenty of Positives. Resour. Mag. 2010, 17, 4–7. [Google Scholar]
- Zuber, S.; Behnke, G.; Nafziger, E. Multivariate assessment of soil quality indicators for crop rotation and tillage in Illinois. Soil Tillage 2017, 174, 147–155. [Google Scholar] [CrossRef]
- Osouli, A.; Karimpour, M.; Bahri, P.S. Erosion Characteristics of Silty to Clayey Soils Using EFA and Lab-Scaled Levee-Floodwall Tests. Geotech. Test. J. 2017, 40, 20160152. [Google Scholar] [CrossRef]
- Ollobarren, P.; Capra, A.; Gelsomino, A.; Spada, C. La Effects of ephemeral gully erosion on soil degradation in a cultivated area in Sicily (Italy). Catena 2016, 145, 334–345. [Google Scholar] [CrossRef]
- Nachtergaele, J.; Poesen, J.; Sidorchuk, A.; Torri, D. Prediction of concentrated flow width in ephemeral gully channels. Hydrol. Process. 2002, 16, 1935–1953. [Google Scholar] [CrossRef]
- Poesen, J.; Nachtergaele, J.; Verstraeten, G.; Valentin, C. Gully erosion and environmental change: Importance and research needs. Catena 2003, 50, 91–133. [Google Scholar] [CrossRef]
- Tebebu, T.Y.; Abiy, A.Z.; Zegeye, A.D.; Dahlke, H.E.; Easton, Z.M.; Tilahun, S.A.; Collick, A.S.; Kidnau, S.; Moges, S.; Dadgari, F.; et al. Surface and subsurface flow effect on permanent gully formation and upland erosion near Lake Tana in the northern highlands of Ethiopia. Hydrol. Earth Syst. Sci. 2010, 14, 2207–2217. [Google Scholar] [CrossRef]
- Knapen, A.; Poesen, J.; Govers, G.; Gyssels, G.; Nachtergaele, J. Resistance of soils to concentrated flow erosion: A review. Earth-Sci. Rev. 2007, 80, 75–109. [Google Scholar] [CrossRef]
- Wells, R.R.; Momm, H.G.; Rigby, J.R.; Bennett, S.J.; Bingner, R.L.; Dabney, S.M. An empirical investigation of gully widening rates in upland concentrated flows. Catena 2013, 101, 114–121. [Google Scholar] [CrossRef]
- Di Stefano, C.; Ferro, V. Measurements of rill and gully erosion in Sicily. Hydrol. Process. 2011, 25, 2221–2227. [Google Scholar] [CrossRef]
- Gong, J.G.; Jia, Y.W.; Zhou, Z.H.; Wang, Y.; Wang, W.L.; Peng, H. An experimental study on dynamic processes of ephemeral gully erosion in loess landscapes. Geomorphology 2011, 125, 203–213. [Google Scholar] [CrossRef]
- Casalí, J.; Giménez, R.; Bennett, S. Gully erosion processes: Monitoring and modelling. Earth Surf. Process. Landf. 2009, 34, 1839–1840. [Google Scholar] [CrossRef]
- Thomas, A.W.; Welch, R. Measurement of ephemeral gully erosion. Trans. Am. Soc. Agric. Eng. 1988, 31, 1723–1728. [Google Scholar] [CrossRef]
- Castillo, C.; Pérez, R.; James, M.R.; Quinton, J.N.; Taguas, E.V.; Gómez, J.A. Comparing the Accuracy of Several Field Methods for Measuring Gully Erosion. Soil Sci. Soc. Am. J. 2012, 76, 1319. [Google Scholar] [CrossRef] [Green Version]
- Karimov, V.; Sheshukov, A.; Barnes, P. Impact of precipitation and runoff on ephemeral gully development in cultivated croplands. In Sediment Dynamics: From the Summit to the Sea; Xu, Y.J., Ed.; IAHS Press: Wallingford, UK, 2014; pp. 87–92. [Google Scholar]
- Gómez-Gutiérrez, Á.; Schnabel, S.; Berenguer-Sempere, F.; Lavado-Contador, F.; Rubio-Delgado, J. Using 3D photo-reconstruction methods to estimate gully headcut erosion. Catena 2014, 120, 91–101. [Google Scholar] [CrossRef]
- Gordon, L.M.; Bennett, S.J.; Bingner, R.L.; Theurer, F.D.; Alonso, C.V.; Gordon, L.M.; Bennett, S.J.; Bingner, R.L.; Theurer, F.D.; Alonso, C.V. Simulating ephemeral gully erosion in AnnAGNPS. Trans. ASABE 2007, 50, 857–866. [Google Scholar] [CrossRef]
- Merkel, W.H.; Woodward, D.E.; Clarke, C.D. Method to Predict Cropland Ephemeral Gully Erosion; ASCE: New Orleans, LA, USA, 1989; pp. 356–361. [Google Scholar]
- Foster, G.R.; Lane, L.J. Erosion by concentrated flow in farm fields. In Proceedings of the D.B. Simons Symposium on Erosion and Sedimentation, Fort Collins, CO, USA, 1983; pp. 9.65–9.82. [Google Scholar]
- Sheshukov, A.Y.; Daggupati, P.; Douglas-Mankin, K.R. High Spatial Resolution Soil Data for Watershed Modeling: 2. Assessing Impacts on Watershed Hydrologic Response. J. Nat. Environ. Sci. 2011, 2, 32–41. [Google Scholar]
- Flanagan, D.; Nearing, M. USDA-Water Erosion Prediction Project: Hillslope Profile and Watershed Model Documentation; NSERL Report No. 10; USDA-ARS National Soil Erosion Research Laboratory: West Lafayette, IN, USA, 1995.
- Soil Survey Staff Soil Series Classification Database. Natural Resources Conservation Service, United States Department of Agriculture. Available online: https://www.nrcs.usda.gov/wps/portal/nrcs/main/soils/survey/class/ (accessed on 20 September 2017).
- NOAA-NCEI Climate-Radar Data Inventories. Available online: https://www.ncdc.noaa.gov/ (accessed on 1 January 2016).
- ESRI ArcMap 10; Environment System Resource Institute: Redlands, CA, USA, 2016.
- Onset Inc. Onset HOBO Dataloggers. Available online: http://www.onsetcomp.com/ (accessed on 15 October 2014).
- Decagon Inc. Decagon Devices. Available online: http://www.decagon.com/ (accessed on 15 October 2014).
- Cobos, D.; Campbell, C. Correcting Temperature Sensitivity of ECH2O Soil Moisture Sensors Application Note; Onset Inc.: Bourne, MA, USA, 2016; Available online: http://www.onsetcomp.com/files/15923-B Correcting Temperature Sensitivity of ECH2O Soil Moisture Sensors.pdf (accessed on 27 September 2017).
- ISCO Inc. Portable Sampler. Available online: http://www.teledyneisco.com/waterandwastewater/Pages/Portable-Samplers.aspx (accessed on 15 October 2016).
- Mathworks Inc. MATLAB: R2014a; Mathworks Inc.: Natick, MA, USA, 2014. [Google Scholar]
- Flanagan, D.; Fu, H.; Frankenberger, J.; Livingston, S.; Meyer, C. A Windows interface for the WEPP erosion model. In Proceedings of the Annual International Meeting of the American Society of Agricultural Engineers, St. Joseph, MI, USA, 12–16 July 1998. ASAE Paper No. 98-2135. [Google Scholar]
- Date Access and Support Center (DASC). The Kansas Data Access and Support Center Data Catalog. Available online: http://www.kansasgis.org/ (accessed on 28 March 2017).
- Sheshukov, A.Y.; Daggupati, P.; Douglas-Mankin, K.R.; Lee, M.-C. High Spatial Resolution Soil Data for Watershed Modeling: 1. Development of a SSURGO-ArcSWAT Utility. J. Nat. Environ. Sci. 2011, 2, 15–24. [Google Scholar]
- Moriasi, D.; Arnold, J.; Liew, M.V.; Bingner, R. Model evaluation guidelines for systematic quantification of accuracy in watershed simulations. Trans. ASABE 2007, 50, 885–900. [Google Scholar] [CrossRef]
- Flanagan, D.C.; Ascough, J.C.; Nicks, A.D.; Nearing, M.A.; Laflen, J.M. Overview of the WEPP Erosion Prediction Model; Technical Documentation; USDA-Water Erosion Prediction Project (WEPP): West Lafayette, IN, USA, 1995.
- Nouwakpo, S.K.; Huang, C.; Bowling, L.; Owens, P. Impact of Vertical Hydraulic Gradient on Rill Erodibility and Critical Shear Stress. Soil Sci. Soc. Am. J. 2010, 74, 1914. [Google Scholar] [CrossRef]
- Nouwakpo, S.K.; Huang, C. A Fluidized Bed Technique for Estimating Soil Critical Shear Stress. Soil Sci. Soc. Am. J. 2012, 76, 1192–1196. [Google Scholar] [CrossRef]
- Huang, C.; Laften, J.M. Seepage and Soil Erosion for a Clay Loam Soil. Soil Sci. Soc. Am. J. 1996, 60, 408. [Google Scholar] [CrossRef]
- Al-Madhhachi, A.T.; Fox, G.A.; Hanson, G.J.; Tyagi, A.K.; Bulut, R. Mechanistic Detachment Rate Model to Predict Soil Erodibility Due to Fluvial and Seepage Forces. J. Hydraul. Eng. 2014, 140, 4014010. [Google Scholar] [CrossRef]
- Regazzoni, P.-L.; Marot, D.; Nguyen, H.H. Surface Erosion: Erodibility Characterisation and Physical Parameters Effects. In Proceedings of the ICSE—International Conference on Scour and Erosion, Francisco, CA, USA, 7–10 November 2010; American Society of Civil Engineers: San Francisco, CA, USA, 2010; pp. 182–191. [Google Scholar]
- Fox, G.A.; Wilson, G.V. The Role of Subsurface Flow in Hillslope and Stream Bank Erosion: A Review. Soil Sci. Soc. Am. J. 2010, 74, 717. [Google Scholar] [CrossRef]
Figure 1.
Maps of (a) the studied field and (b) ephemeral gully in central Kansas, USA. The contributing catchment is illustrated by red line, gully trajectory is shown as blue line, and a black rectangle in (a) outlines a close-up view in (b). The map in (b) also shows the positions of pin-frame placement (black outlines) in headcut (HC) and along channelized part of the gully (CS1–CS4), gully area (pink outline), and surface runoff direction from contributing catchment and within the downslope channel (blue lines and arrows).

Figure 2.
Field equipment installed along the gully.

Figure 3.
(a) Pin-frame, (b) earth pins, and (c) base foundation platforms for measuring gully cross-sectional profile.
Figure 3.
(a) Pin-frame, (b) earth pins, and (c) base foundation platforms for measuring gully cross-sectional profile.

Figure 4.
Surface plots of elevation grid within the headcut area obtained by pin-frame measurements at the beginning and end of field campaigns in 2013 (a,b) and 2014 (c,d). Direction of surface runoff is from left to right.
Figure 4.
Surface plots of elevation grid within the headcut area obtained by pin-frame measurements at the beginning and end of field campaigns in 2013 (a,b) and 2014 (c,d). Direction of surface runoff is from left to right.

Figure 5.
Gully elevation profiles at 10 cm cross-section in the headcut area (see Figure 4) for 15 field surveys in 2013 and 2014.
Figure 5.
Gully elevation profiles at 10 cm cross-section in the headcut area (see Figure 4) for 15 field surveys in 2013 and 2014.

Figure 6.
Average daily soil moisture content (m3/m3), temperature (°C), and total precipitation (mm) in 2013 and 2014 campaigns for periods P2–P6 and P8–P14. Twelve significant wet days, E1 to E12, are identified by purple bars. Survey periods of substantial gully erosion are P2, P10, and P14.
Figure 6.
Average daily soil moisture content (m3/m3), temperature (°C), and total precipitation (mm) in 2013 and 2014 campaigns for periods P2–P6 and P8–P14. Twelve significant wet days, E1 to E12, are identified by purple bars. Survey periods of substantial gully erosion are P2, P10, and P14.

Figure 7.
Hourly soil moisture content (%), precipitation and surface runoff (mm) for significant runoff event E10 on 9–10 June 2014. Major event characteristics (ta, tp, td, θa, θp, qp) are also shown.
Figure 7.
Hourly soil moisture content (%), precipitation and surface runoff (mm) for significant runoff event E10 on 9–10 June 2014. Major event characteristics (ta, tp, td, θa, θp, qp) are also shown.

Figure 8.
Hydraulic shear stress in the headcut area versus the rate of change in soil moisture content from antecedent to peak runoff time for 12 runoff events. Parameters τC0 = 3.5, b = 1, and β = 0.4.
Figure 8.
Hydraulic shear stress in the headcut area versus the rate of change in soil moisture content from antecedent to peak runoff time for 12 runoff events. Parameters τC0 = 3.5, b = 1, and β = 0.4.


Table 1.
Summary for 14 survey periods. Rainfall (days, events, depth) and gully elevation changes were measured, and surface runoff and sheet and rill erosion were simulated. For erosion data, soil loss is positive, and sediment accumulation is negative.
Table 1.
Summary for 14 survey periods. Rainfall (days, events, depth) and gully elevation changes were measured, and surface runoff and sheet and rill erosion were simulated. For erosion data, soil loss is positive, and sediment accumulation is negative.
| No. | Survey Period | All Days | Wet Days | Rain Events | Rain Fall (mm) | Surface Runoff (mm) | Sheet-Rill Erosion (kg) | Headcut Erosion (kg) | Channel Erosion (kg) |
|---|---|---|---|---|---|---|---|---|---|
| P1 | 28 June 2013–11 July 2013 | 13 | 1 | 1 | 4 | 0 | 0 | 0 | 0 |
| P2 | 11 July 2013–6 August 2013 | 26 | 11 | 17 | 270 | 131 | 831 | 124 | 645 |
| P3 | 6 August 2013–12 August 2013 | 15 | 7 | 8 | 146 | 82 | 687 | −26 | 133 |
| P4 | 21 August 2013–19 September 2013 | 29 | 2 | 3 | 79 | 0 | 0 | 0 | 0 |
| P5 | 19 September 2013–17 October 2013 | 28 | 3 | 3 | 22 | 0 | 0 | 0 | −95 |
| P6 | 17 October 2013–7 November 2013 | 21 | 4 | 4 | 53 | 7 | 24 | 0 | −571 |
| P7 | 7 November 2013–9 April 2014 | 153 | 6 | 6 | 6 | 0 | 0 | 0 | 0 |
| P8 | 9 April 2014–9 May 2014 | 30 | 4 | 5 | 56 | 36 | 542 | −50 | −1031 |
| P9 | 9 May 2014–31 May 2014 | 22 | 4 | 5 | 40 | 14 | 84 | 0 | 0 |
| P10 | 31 May 2014–27 June 2014 | 27 | 4 | 4 | 85 | 46 | 228 | 232 | 1937 |
| P11 | 27 June 2014–11 July 2014 | 14 | 4 | 4 | 28 | 4 | 36 | 0 | 97 |
| P12 | 11 July 2014–5 August 2014 | 25 | 2 | 2 | 16 | 1 | 12 | 0 | −43 |
| P13 | 5 August 2014–12 August 2014 | 7 | 2 | 2 | 47 | 35 | 313 | 0 | −223 |
| P14 | 12 August 2014–14 September 2014 | 34 | 3 | 3 | 131 | 89 | 687 | 28 | −834 |
Table 2.
Characteristics of twelve significant runoff events E1 to E12 with potential to cause soil erosion within the ephemeral gully: time from beginning of rainfall to peak runoff (tpa), duration of runoff event (td), antecedent soil moisture content (θa), peak runoff rate (qp), peak channel flow depth (hp), and hydraulic shear stress (τ).
| Event Number | Survey Period | Date | tpa (h) | td (h) | θa (%) | qp (10−2 m3 s−1) | hp (cm) | τ (Pa) |
|---|---|---|---|---|---|---|---|---|
| E1 | P2 | 25 July 2013 | 4 | 6.7 | 84 | 3.8 | 11 | 10.9 |
| E2 | P2 | 29 July 2013 | 10 | 5.5 | 96 | 1.4 | 7 | 6.7 |
| E3 | P2 | 2 August 2013 | 2 | 4.0 | 89 | 1.7 | 8 | 7.4 |
| E4 | P2 | 4 August 2013 | 4 | 8.3 | 83 | 1.0 | 6 | 5.9 |
| E5 | P3 | 9 August 2013 | 3 | 8.8 | 91 | 1.3 | 7 | 6.2 |
| E6 | P3 | 12 August 2013 | 2 | 5.3 | 80 | 6.2 | 14 | 13.6 |
| E7 | P8 | 27 April 2014 | 3 | 4.0 | 75 | 1.9 | 8 | 6.2 |
| E8 | P10 | 5 June 2014 | 5 | 8.0 | 85 | 1.1 | 7 | 5.2 |
| E9 | P10 | 7 June 2014 | 6 | 6.0 | 83 | 0.5 | 5 | 3.8 |
| E10 | P10 | 9 June 2014 | 7 | 17.8 | 81 | 1.8 | 9 | 6.1 |
| E11 | P13 | 10 August 2014 | 3 | 5.0 | 76 | 1.8 | 8 | 5.9 |
| E12 | P14 | 1 September 2014 | 4 | 6.2 | 75 | 12.1 | 16 | 16.0 |
© 2017 by the authors. Licensee MDPI, Basel, Switzerland. This article is an open access article distributed under the terms and conditions of the Creative Commons Attribution (CC BY) license (http://creativecommons.org/licenses/by/4.0/).
Share and Cite
MDPI and ACS Style
Karimov, V.R.; Sheshukov, A.Y. Effects of Intra-Storm Soil Moisture and Runoff Characteristics on Ephemeral Gully Development: Evidence from a No-Till Field Study. Water 2017, 9, 742. https://doi.org/10.3390/w9100742
AMA Style
Karimov VR, Sheshukov AY. Effects of Intra-Storm Soil Moisture and Runoff Characteristics on Ephemeral Gully Development: Evidence from a No-Till Field Study. Water. 2017; 9(10):742. https://doi.org/10.3390/w9100742
Chicago/Turabian StyleKarimov, Vladimir R., and Aleksey Y. Sheshukov. 2017. "Effects of Intra-Storm Soil Moisture and Runoff Characteristics on Ephemeral Gully Development: Evidence from a No-Till Field Study" Water 9, no. 10: 742. https://doi.org/10.3390/w9100742
Note that from the first issue of 2016, this journal uses article numbers instead of page numbers. See further details here.