Batch Test Screening of Industrial Product/Byproduct Filter Materials for Agricultural Drainage Water Treatment

U.S. Department of Agriculture, Agricultural Research Service, Soil Drainage Research Unit, 590 Woody Hayes Drive, Columbus, OH 43210, USA
Water 2017, 9(10), 791; https://doi.org/10.3390/w9100791
Submission received: 31 August 2017
/
Revised: 30 September 2017
/
Accepted: 10 October 2017
/
Published: 14 October 2017
(This article belongs to the Special Issue Additives in Stormwater Filters for Enhanced Pollutant Removal)
Abstract
:Filter treatment may be a viable means for removing the nitrate (NO3−), phosphate (PO43−), and pesticides discharged with agricultural drainage waters that cause adverse environmental impacts within the U.S. on local, regional, and national scales. Laboratory batch test screening for agricultural drainage water treatment potential was conducted on 58 industrial product/byproduct filter materials grouped into six categories: (1) high carbon content media; (2) high iron content media; (3) high aluminum content media; (4) surfactant modified clay/zeolite; (5) coal combustion residuals; and (6) spent foundry sands. Based on a percent contaminant removal criteria of 75% or greater, seven industrial products/byproducts were found to meet this standard for NO3− alone, 44 met this standard for PO43−, and 25 met this standard for the chlorinated triazine herbicide, atrazine. Using a 50% or greater contaminant removal criteria, five of the industrial product/byproduct filter materials exhibited potential for removing NO3−, PO43−, and atrazine together; eight showed capability for combined NO3− and PO43− removal; 21 showed capability for combined PO43− and atrazine removal; and nine showed capability for combined NO3− and atrazine removal. The results of this study delineated some potential industrial product/byproduct filter materials for drainage water treatment; however, a complete feasibility evaluation for drainage water treatment of any of these filter materials will require much more extensive testing.
1. Introduction
In humid regions, such as the Midwest U.S., agricultural drainage practices commonly employ buried pipe networks to remove excess soil moisture by lowering the shallow water table, which in turn improves crop yields. Subsurface drainage is also utilized in semiarid to arid regions to prevent soil salinity build-up in farm fields. Agricultural fertilizer and pesticide applications, combined with subsurface drainage practices, often produce adverse water quality impacts within the U.S. on local, regional, and national scales [1,2,3,4,5].
Nitrate (NO3−) is a major environmental concern with respect to subsurface drainage. Research conducted in the Midwest U.S. and Canada indicates that the nitrate-nitrogen (NO3−-N) concentration in waters discharged from agricultural subsurface drainage systems typically range from 0 to 50 mg/L, although higher values are fairly common [6,7,8]. Phosphate (PO43−, also referred to as orthophosphate, dissolved phosphorous, or soluble reactive phosphorous) is another nutrient typically found in subsurface drainage waters. A review of previous investigations indicate that subsurface drainage phosphate-P (PO43−-P) values in agricultural settings are typically below 0.25 ppm, and, in fact, most often 0.1 ppm or less; however, values as high and even exceeding 1.0 ppm have been reported [9,10,11,12,13,14]. Pesticides are likewise frequently present in agricultural drainage water [11,15], and atrazine, a chlorinated triazine herbicide, used extensively for corn and sorghum production in the U.S. and Canada, happens to be one of the most common. Atrazine is usually found in subsurface drainage waters at relatively low concentrations, normally well less than 0.1 mg/L [16,17,18], although Gaynor et al. [19] did measure a maximum subsurface drainage water atrazine concentration of 0.35 mg/L in research conducted on small test plots. A typical agricultural subsurface drainage system is comprised of drainage pipe laterals that connect to a main collector pipe that outlets into a ditch or small stream. Consequently, an in-line filter treatment system located on the main collector pipe near the subsurface drainage system outlet could be a viable means for removing oxyanion nutrients (NO3− and PO43−) and pesticides from drainage waters before these waters are discharged into the environment. However, choosing the appropriate porous, permeable, chemically reactive material that is incorporated into a filter system to remove nutrients and/or pesticides will be critical for obtaining effective and efficient agricultural drainage water treatment.
One possible mechanism by which various filter materials could remove NO3− is anion adsorption due to electrostatic attraction between negatively charged NO3− ions and positively charged surfaces of filter material particles [20,21]. Filter materials might also remove NO3− via oxidation/reduction reactions that convert NO3− to ammonia/ammonium, NH3/NH4+, or nitrogen gas, N2 [22,23,24,25,26]. Compounds containing NO3− tend to be extremely soluble in water [27], and, consequently, chemical precipitation is an unlikely NO3− removal mechanism. Nevertheless, cations (e.g., Al3+, Ca2+, Fe3+, Mg2+, etc.) dissolved from filter materials can combine with PO43− to form low solubility chemical precipitates [28,29,30,31]. Direct PO43− adsorption typically involves ligand exchange at oxygen containing functional group sites present along surfaces of filter material particles [29,30,31,32,33]. Phosphate adsorption can also occur due to electrostatic attraction between negatively charged PO43− ions and positively charged filter material surfaces [34,35,36]. The chlorinated triazine herbicide, atrazine, can be classified as an organochloride pesticide, and organochloride pesticides, such as atrazine, can be removed by filter materials through London–van der Waals dispersion forces, hydrophobic interactions, and reductive dechlorination [37,38,39,40].
A large number of industrial products/byproducts could have potential as filter materials utilized for removing oxyanion nutrients (i.e., NO3− and PO43−) and/or organochloride pesticides (e.g., atrazine, alchlor, metolachlor, 2,4-D, etc.) from agricultural drainage waters. Simple batch tests can be employed for an initial determination as to whether a particular industrial product/byproduct filter material has some capability for drainage water treatment. As such, these tests can prove very useful for preliminary screening purposes by clearly indicating which industrial products/byproducts do not remove NO3−, PO43−, and/or organochloride pesticides and are accordingly not appropriate filter materials for drainage water treatment. Obviously, for those filter materials that do pass this batch test screening process, more extensive evaluation is certainly needed (hydraulic conductivity measurements, adsorption isotherm experiments, long duration column tests, etc.) in order to completely determine overall viability for use in treating nutrients and pesticides present in drainage waters. Consequently, the stated goal of this research project was to carry out batch test screening of 58 industrial products/byproducts to find ones exhibiting some capacity for removing NO3−, PO43−, and/or atrazine, thereby delineating those warranting further investigation as possible drainage water treatment filter materials.
2. Materials and Methods
2.1. Industrial Product/Byproduct Filter Materials
The industrial products/byproducts screened as potential drainage water treatment filter materials in this study can be grouped into six categories: (1) high carbon content media—14 in total; (2) high iron content media—17 in total; (3) high aluminum content media—6 in total; (4) surfactant modified clay/zeolite—6 in total; (5) coal combustion residuals—8 in total; and (6) spent foundry sands—7 in total. These six categories of filter materials were chosen on the basis of past research indicating capability for removing oxyanion and/or organic contaminants from wastewaters [24,38,41,42,43,44,45]. For consistency, so that all filter materials passed a No. 10 sieve (2 mm), some of the industrial product/byproducts were broken up into smaller granules using a ceramic mortar and pestle. The only filter materials requiring more extensive preparation were the surfactant modified clay or zeolite, which were generated by mixing 100 g of surfactant, 250 g of clay or zeolite, and 500 g of ultrapure deionized water, allowing 24 h for the mixture to equilibrate, and then afterwards draining excess liquid from the surfactant coated clay or zeolite particles. The 58 industrial product/byproducts tested are listed by category as follows and include: (1) the designated short notation for the material used throughout the rest of the article; (2) a descriptive name of the material; (3) organization and/or facility source of the material; and, if applicable, (4) material marketing/research number. The industrial product/byproduct lists are formatted in the following manner:
FILTER MATERIAL NOTATION: Filter Material Description (Filter Material Source), Marketing/Research Number.
High Carbon Content Media
COAL1: Lignite (American Coal Foundation, Washington, DC, USA).
COAL2: Bituminous Coal (American Coal Foundation, Washington, DC, USA).
COAL3: Sub-Bituminous Coal–Wyodak–Anderson Mine, Wyoming, USA (Argonne National Laboratory, Lemont, IL, USA).
COAL4: Bituminous Coal—Illinois #6 Mine, Illinois, USA (Argonne National Laboratory, Lemont, IL, USA).
COAL5: Bituminous Coal—Bailey Enlow Fork Mine, Pennsylvania, USA (CONSOL Energy Inc., Canonsburg, PA, USA).
COAL6: Bituminous Coal—Emery Mine, Utah, USA (Consol Energy, Canonsburg, PA, USA).
COKE1: Metallurgical Coke (Mid-Continent Coal and Coke Company, Cleveland, OH, USA).
COKE2: Petroleum Coke (Oxbow Carbon LLC, West Palm Beach, FL, USA).
CHAR: Charcoal (Wicked Good Charcoal, Inc., Kennebunk, ME, USA).
AC1: Steam Activated Carbon (Alfa Aesar, Ward Hill, MA, USA).
AC2: Coconut Shell Based Granular Steam Activated Carbon (PICA USA, Inc., Columbus, OH, USA), G55-C(6) 12x30.
AC3: Hardwood Based Chemically Activated Carbon (PICA USA, Inc., Columbus, OH, USA), GX191 12x40.
AC4: Coal Based Granular Steam Activated Carbon (PICA USA, Inc., Columbus, OH, USA), HYDRO F22 12x40.
AC5: Hardwood Based Powdered Steam Activated Carbon (PICA USA, Inc., Columbus, OH, USA), HYDRO MP23.
High Iron Content Media
ZVI1: Iron Aggregate (Connelly-GPM, Inc., Chicago, IL, USA), CC-1190.
ZVI2: Iron Aggregate (Connelly-GPM, Inc., Chicago, IL, USA), CC-1004.
ZVI3: Carbon Reduced Zero Valent Iron (Hepure Technologies, Inc., Flemington, NJ, USA), H-200.
ZVI4: Hydrogen Reduced Zero Valent Iron (North American Höganäs, Inc., Hollsopple, PA, USA), R-12.
SMI1: Sulfur Modified Iron (North American Höganäs, Inc., Hollsopple, PA, USA), #5014.
SMI2: Sulfur Modified Iron (North American Höganäs, Inc., Hollsopple, PA, USA), R12S6.
SMI3: Sulfur Modified Iron (North American Höganäs, Inc., Hollsopple, PA, USA), W40S6.
PIC: Porous Iron Composite (North American Höganäs, Inc., Hollsopple, PA, USA).
IS1: Pyrite—Natural (FeS2) (Alfa Aesar, Ward Hill, MA, USA).
IS2: Iron Sulfide (FeS) (Alfa Aesar, Ward Hill, MA, USA).
IS3: Pyrrhotite—Natural (Fe(1-x)S with x = 0 to 0.2) (Ward’s Science, Rochester, NY, USA).
IO1: Granular Ferric Oxide (FeOOH) (Severn Trent—North America, Horsham, PA, USA), E33.
IO2: Black Ion Oxide (Severn Trent—North America, Horsham, PA, USA), E33 HC-F.
IO3: Geothite—Natural (FeOOH) (Ward's Science, Rochester, NY, USA).
IO4: Hematite—Natural (Fe2O3) (Ward's Science, Rochester, NY, USA).
IO5: Ferrihydrite Sludge (Fe2O3·0.5H2O) (Water Treatment Plant in Memphis, TN, USA.
IO6: Iron Oxyhydroxide (Amorphous FeOOH and Ferrihydrite) (Mach I, Inc., King of Prussia, PA, USA), NANOCAT® SFIO.
High Aluminum Content Media
AO1: Bauxite (Ward's Science, Rochester, New York, USA).
AO2: Aluminum Hydroxide (Al(OH)3) (Alfa Aesar, Ward Hill, MA, USA).
AO3: Synthetic Gibbsite (Al(OH)3) (Ward's Science, Rochester, NY, USA).
AO4: Aluminum Oxide (Al2O3) (Alfa Aesar, Ward Hill, MA, USA).
AO5: Aluminum Oxide—Alpha (Al2O3) (Alfa Aesar, Ward Hill, MA, USA).
AO6: Aluminum Oxide—Gamma (Al2O3) (Alfa Aesar, Ward Hill, MA, USA).
Surfactant Modified Clay/Zeolite
SMC1: Surfactant Modified Clay—(1-Hexadecyl)trimethylammonium Bromide (Alfa Aesar, Ward Hill, MA, USA) + Sodium Montmorillonite (The Clay Minerals Society, Chantilly, VA, USA), SWy-2.
SMC2: Surfactant Modified Clay—Alkyldimethylnaphthyl Ammonium Chloride (Mason Chemical Company, Arlington Heights, IL, USA), Maquat NKC-50 I + Sodium Montmorillonite (The Clay Minerals Society, Chantilly, VA, USA), SWy-2.
SMC3: Surfactant Modified Clay—Cocoalkylmethyl PEG-15 Ammonium Chloride (Mason Chemical Company, Arlington Heights, IL, USA), Maquat C-15 + Sodium Montmorillonite (The Clay Minerals Society, Chantilly, VA, USA), SWy-2.
SMZ1: Surfactant Modified Zeolite—(1-Hexadecyl)trimethylammonium Bromide (Alfa Aesar, Ward Hill, MA, USA) + Clinoptilolite (Z-Olite Inc., Logan, UT, USA).
SMZ2: Surfactant Modified Zeolite—Alkyldimethylnaphthyl Ammonium Chloride (Mason Chemical Company, Arlington Heights, Illinois, USA), Maquat NKC-50 I + Clinoptilolite (Z-Olite Inc., Logan, UT, USA).
SMZ3: Surfactant Modified Zeolite—Cocoalkylmethyl PEG-15 Ammonium Chloride (Mason Chemical Company, Arlington Heights, IL, USA), Maquat C-15 + Clinoptilolite (Z-Olite Inc., Logan, UT, USA).
Coal Combustion Residuals
CCR1: Fly Ash—Gavin Power Plant, Ohio, USA (American Electric Power, Columbus, OH, USA).
CCR2: Bottom Ash—Gavin Power Plant, Ohio, USA (American Electric Power, Columbus, OH, USA).
CCR3: FGD Material (Scrubber Sludge)—Gavin Power Plant, Ohio, USA (American Electric Power, Columbus, OH, USA).
CCR4: Gypsum Quality FGD Material—Gavin Power Plant, Ohio, USA (American Electric Power, Columbus, OH, USA).
CCR5: Fly Ash—Conesville Power Plant, Ohio, USA (American Electric Power, Columbus, OH, USA).
CCR6: Fly Ash—Mitchell Power Plant, West Virginia, USA (American Electric Power, Columbus, OH, USA).
CCR7: Fly Ash—W. C. Beckjord Power Plant, Ohio, USA (Duke Energy, Charlotte, NC, USA).
CCP8: Calciment Fly Ash (Mitek Resources, Beavercreek, OH, USA).
Spent Foundry Sands
FS1: Green Sand—Steel Casting Foundry (Columbus Steel Castings Company, Columbus, OH, USA).
FS2: No Bake Sand—Steel Casting Foundry (Fisher Cast Steel, Inc., West Jefferson, OH, USA).
FS3: Green Sand—Aluminum Casting Foundry (Industrial Aluminum and Bronze Foundry, Columbus, OH, USA).
FS4: Green Sand—Iron Casting Foundry—Vine Street Facility, Kenton, Ohio, USA (Kenton Iron Products, Kenton, OH, USA).
FS5: No Bake Sand—Iron Casting Foundry—Vision Drive Facility, Kenton, Ohio, USA (Kenton Iron Products, Kenton, OH, USA).
FS6: No Bake Sand—Iron Casting Foundry (Liberty Casting Company, Delaware, OH, USA).
FS7: Green Sand—Iron Casting Foundry (General Motors Powertrain Defiance Foundry, Defiance, OH, USA).
2.2. Nitrate/Phosphate/Atrazine Test Solution
Potential industrial product/byproduct filter materials were screened using a test solution that, by drainage water standards, had relatively high concentrations of nitrate (NO3−), phosphate (PO43−), and the organochloride pesticide, atrazine. This test solution contained 50 ppm nitrate-nitrogen (NO3−-N), 0.25 ppm phosphate-phosphorous (PO43−-P), and 0.4 ppm atrazine. Nitrate was added as potassium nitrate (KNO3—360 ppm), and PO43− was added as dibasic sodium phosphate (Na2HPO4—1.15 ppm). Using a test solution with NO3−, PO43−, and atrazine concentrations that were relatively high by drainage water standards ensured a more rigorous evaluation as to whether specific industrial product/byproduct filter materials exhibited promise for drainage water treatment.
Furthermore, 565 mg/L calcium sulfate (CaSO4) and 140 mg/L potassium chloride (KCl) were also added so that inorganic anions/cations (SO42−, Cl−, Ca2+, and K+) normally found in drainage water were also included in the test solution. The dissolution of Na2HPO4 added a small amount of sodium (Na+), another cation commonly found in drainage waters. Electrical conductivity (EC) is used to gauge the solution salinity, and, hence, the amount of dissolved anions/cations present. The EC of the batch test solution was 1.38 dS/m. Based on unreported drainage water EC measurements in northwest Ohio (ECAVG—0.31 dS/m) and central Ohio (ECAVG—0.70 dS/m), the test solution EC probably represents the upper range of EC values likely found for subsurface drainage under Midwest U.S. conditions. However, agricultural subsurface drainage EC values can be substantially larger in locations with arid or semi-arid climates. Subsurface drainage discharge EC values of 32 dS/m have been reported for the Murrumbidgee Irrigation Area, of New South Wales, Australia [46], and subsurface drainage EC values as high as 8 dS/m (converted from total dissolved solid concentrations) have been measured at the Broadview Water District in the San Joaquin Valley, California [47]. Based on the most commonly employed salinity classification scale for water extracted from a saturated soil paste [48,49], the solution used for the batch tests in this study would be classified as non-saline (0 to 2 dS/m). Consequently, the total amounts of dissolved anions and cations present in the test solution is not unrealistic considering the wide range of EC measured salinity found around the world for subsurface drainage waters.
2.3. Batch Test Screening Procedures
As previously stated, the overall goal of this laboratory investigation was to evaluate whether specific industrial product/byproduct filter materials exhibited promise with respect to agricultural drainage water treatment. This goal was accomplished by conducting batch test screening to measure the percent NO3−, PO43−, and atrazine removal by various filter materials. In each filter material batch test, 1 to 5 g (5 g predominately) of filter material and 38 to 40 g of test solution (40 g predominantly) were combined in a 50 mL Teflon FEP (fluorinated ethylene propylene) centrifuge tube. Less than 5 g of filter material and/or 40 g of test solution were used in some batch tests in order to accommodate the limited 50 mL volume of the centrifuge tubes. The predominant filter material to solution ratio (1:8 by weight) employed for this investigation was chosen based on the filter material to solution ratios used in previous batch test studies [50,51,52,53]. The filter material and solution were thoroughly mixed by placing the centrifuge tube containing filter material and solution on a laboratory rotator (Mini LabRoller Rotator, Labnet International, Inc., Woodbridge, NJ, USA) operated at 20 rpm (Figure 1). Each batch was then stopped after 24 h of mixing. A 24 h mixing period was employed so as to allow ample time for chemical reactions to occur by which NO3−, PO43−, and atrazine could be removed by the industrial products/byproducts evaluated. Procedures for the control batch tests were the same except that only solution (40 g), but no filter material, was added to the Teflon centrifuge tube.
Once these tests were completed, the Teflon centrifuge tubes containing filter material and solution were centrifuged at 2500 rpm (800 g) for 10 min in order to separate the filter material from the solution. Part of the solution, set aside for analysis of atrazine, was decanted into a 15 mL glass centrifuge tube and centrifuged at 2500 rpm (800 g) for an additional 60 min, then decanted once more into a second 15 mL glass centrifuge tube to ensure that all filter material had been removed from contact with the solution. The remaining solution in the original Teflon centrifuge tube was used for analysis of NO3− and PO43−. This remaining solution was itself decanted into a 50 mL polypropylene centrifuge tube and centrifuged at 2500 rpm (800 g) for an additional 60 min, then decanted once more into a 40 mL glass vial, again to ensure that filter material had been removed from contact with solution. The rather rigorous process of separating the solution from the filter material was done for the purpose of discontinuing chemical reactions between the filter material and test solution after the batch test had completed. For consistency purposes, the same solution separation procedures were employed after completion of the control batch tests, even though these batch tests were conducted with solution only and no filter material.
Solution pH was measured at batch test completion using a Hanna Instruments (Woonsocket, RI, USA) Checker pH meter. Nitrate-nitrogen was determined colorimetrically by a copperized-cadmium reduction method [54] using a Lachat Instruments (Milwaukee, WI, USA), QuikChem 8000 Flow Injection Analysis System. Phosphate-phosphorous was determined colorimetrically by an ascorbic acid reduction method [54] also using the Lachat Instruments, QuikChem 8000 Flow Injection Analysis System. Two different methods were employed to measure the atrazine present in solution at batch test completion. Immunoassay [55] was one of the atrazine analysis methods, and for this method, a Strategic Diagnostic Inc. (Newark, NJ, USA), RaPID Assay Atrazine Test Kit and RPA-I Analyzer (spectrophotometer) were utilized. The U.S. Environmental Protection Agency Method 525.2, based on gas chromatography–mass spectrometry (GC-MS), was the second atrazine analysis method [56]. The GC-MS atrazine analysis done for this study used a Varian, Inc. (Palo Alto, CA, USA), Saturn 2200 Ion Trap GC/MS System.
A small number of solution samples from the filter material screening batch tests were submitted for atrazine analysis to an accredited/certified outside laboratory (Soil, Water, and Agricultural Testing Laboratory, New Mexico State University, Las Cruces, New Mexico) for the purpose of evaluating the atrazine analysis accuracy of the immunoassay and GC-MS methods that were used in-house. The outside laboratory atrazine analysis (GC-MS methods) indicated that the in-house immunoassay atrazine analysis tended to somewhat underestimate the amount of filter material induced atrazine removal (higher measured values for atrazine concentration), while the in-house GC-MS atrazine analysis tended to somewhat overestimate the amount of filter material induced atrazine removal (lower measured values for atrazine concentration). Therefore, to avoid bias, results are reported for both the in-house immunoassay atrazine analysis and the in-house GC-MS atrazine analysis. Batch tests for screening porous iron composite (PIC) and spent foundry sands were analyzed for atrazine with just the immunoassay method due to repairs being carried out at the time on the Varian, Inc., Saturn 2200 Ion Trap GC/MS System.
Six batch test replicates were carried for each filter material, while, for control tests (no filter material present), there were seven replicates. Solution concentrations of NO3−, PO43−, and atrazine were measured for each of the six replicates corresponding to a particular filter material and also for the seven control test replicates. The known solution concentrations at the beginning of the batch tests and the measured solution concentrations at batch test completion were used to calculate percent NO3−, PO43−, and atrazine removal with the following equation.
Solution pH was also measured for all batch test replicates, with the exception of PIC and the spent foundry sands. Due to a miscommunication regarding procedures, the pH for PIC was measured on just three of the six replicates, while the pH for the spent foundry sands were measured on only one replicate.
3. Results and Discussion
Results for the batch test screening of 58 industrial products/byproducts are provided in Table 1 (high carbon content media), Table 2 (high iron content media), Table 3 (high aluminum content media), Table 4 (surfactant modified clay/zeolite), Table 5 (coal combustion residuals), and Table 6 (spent foundry sands). These tables report the amounts of filter material and test solution used, pH of solution at batch test completion, along with the average (and standard deviation) of the percent nitrate (NO3−), phosphate (PO43−), and atrazine removal. For reference, nitrate-nitrogen (NO3−-N), phosphate-phosphorous (PO43−-P), and atrazine removal calculated as mg of contaminant per g of filter material is provided in the Appendix Table A1, Table A2, Table A3, Table A4, Table A5 and Table A6. The standard deviation of percent NO3−, PO43−, and atrazine removal was in general relatively small compared to the corresponding percent NO3−, PO43−, and atrazine removal average, which shows that for a particular filter material there was usually good consistency in contaminant removal results between replicate batch tests.
Percent removal standard deviation values of ~0.0% correspond to an average percent removal of 100%, indicating that solution concentrations for NO3−, PO43−, or atrazine at batch test completion were below measurement method detection limits (i.e., essentially all originally present NO3−, PO43−, or atrazine had been removed by the filter material). With the exception of gas chromatography–mass spectrometry (GC-MS) measured atrazine for batch tests with high aluminum content media, negative values for average percent NO3−, PO43−, or atrazine removal tend to be relatively minor (0.0% to −9.0%) and are the result of inherent laboratory measurement variability combined with the filter material having in effect removed no NO3−, PO43−, or atrazine. The more negative values of −48.0% to −9% for GC-MS measured atrazine removals obtained with five of six high aluminum content media did not correspond very well with the average percent atrazine removal measured by immunoassay methods for these same filter materials (9% to 19%), which may mean that even very limited dissolution of aluminum oxides could for whatever reason adversely impact GC-MS atrazine measurement.
The notation *** represents batch tests results where the amount of PO43− present in solution at batch test completion is substantially greater, by a factor of two or more, than the PO43− present in the original test solution. Consequently, *** indicates that readily released PO43− was initially present with the filter material, which was found to have occurred with eight different industrial products/byproducts (five of the high carbon content media, one of the high iron content media, and two of surfactant modified clay/zeolite). However, *** does not necessarily imply that the filter material is incapable of removing PO43− from agricultural drainage waters. For porous iron composite (PIC), one of the filter materials evaluated in this study, laboratory column tests showed that, once the PO43− originally present with PIC leached out, PIC then became very effective removing substantial quantities of drainage water PO43− [26].
The initial pH of the test solution was 7.01. For the seven replicate control batch tests conducted with 40 g of test solution only (no filter material), the average pH was 7.38, the average of the percent NO3− removal was −0.3% (standard deviation = 1.2%), the average of the percent PO43− removal was 8.3% (standard deviation = 9.3%), the average of the percent atrazine removal measured by immunoassay methods was 11.1% (standard deviation = 12.7%), and the average of the percent atrazine removal measured by GC-MS was −10.6% (standard deviation = 10.3%). Results from the control batch tests therefore show that the experimental equipment and procedures alone did not substantially alter solution pH or cause excessive loss of NO3−, PO43−, or atrazine.
Table 1, Table 2, Table 3, Table 4, Table 5 and Table 6 show a wide range of solution pH at batch test completion, from 1.97 to 13.05. With an initial test solution pH of 7.01 and an average control batch pH of 7.38, clearly many of the industrial product/byproduct filter materials have capacity to significantly alter drainage water pH. Releasing either extremely low or high pH drainage waters into local streams, rivers, or lakes can cause ecosystem damage. Therefore, the impact on pH needs to be considered when choosing a particular industrial product/byproduct filter material for drainage water treatment.
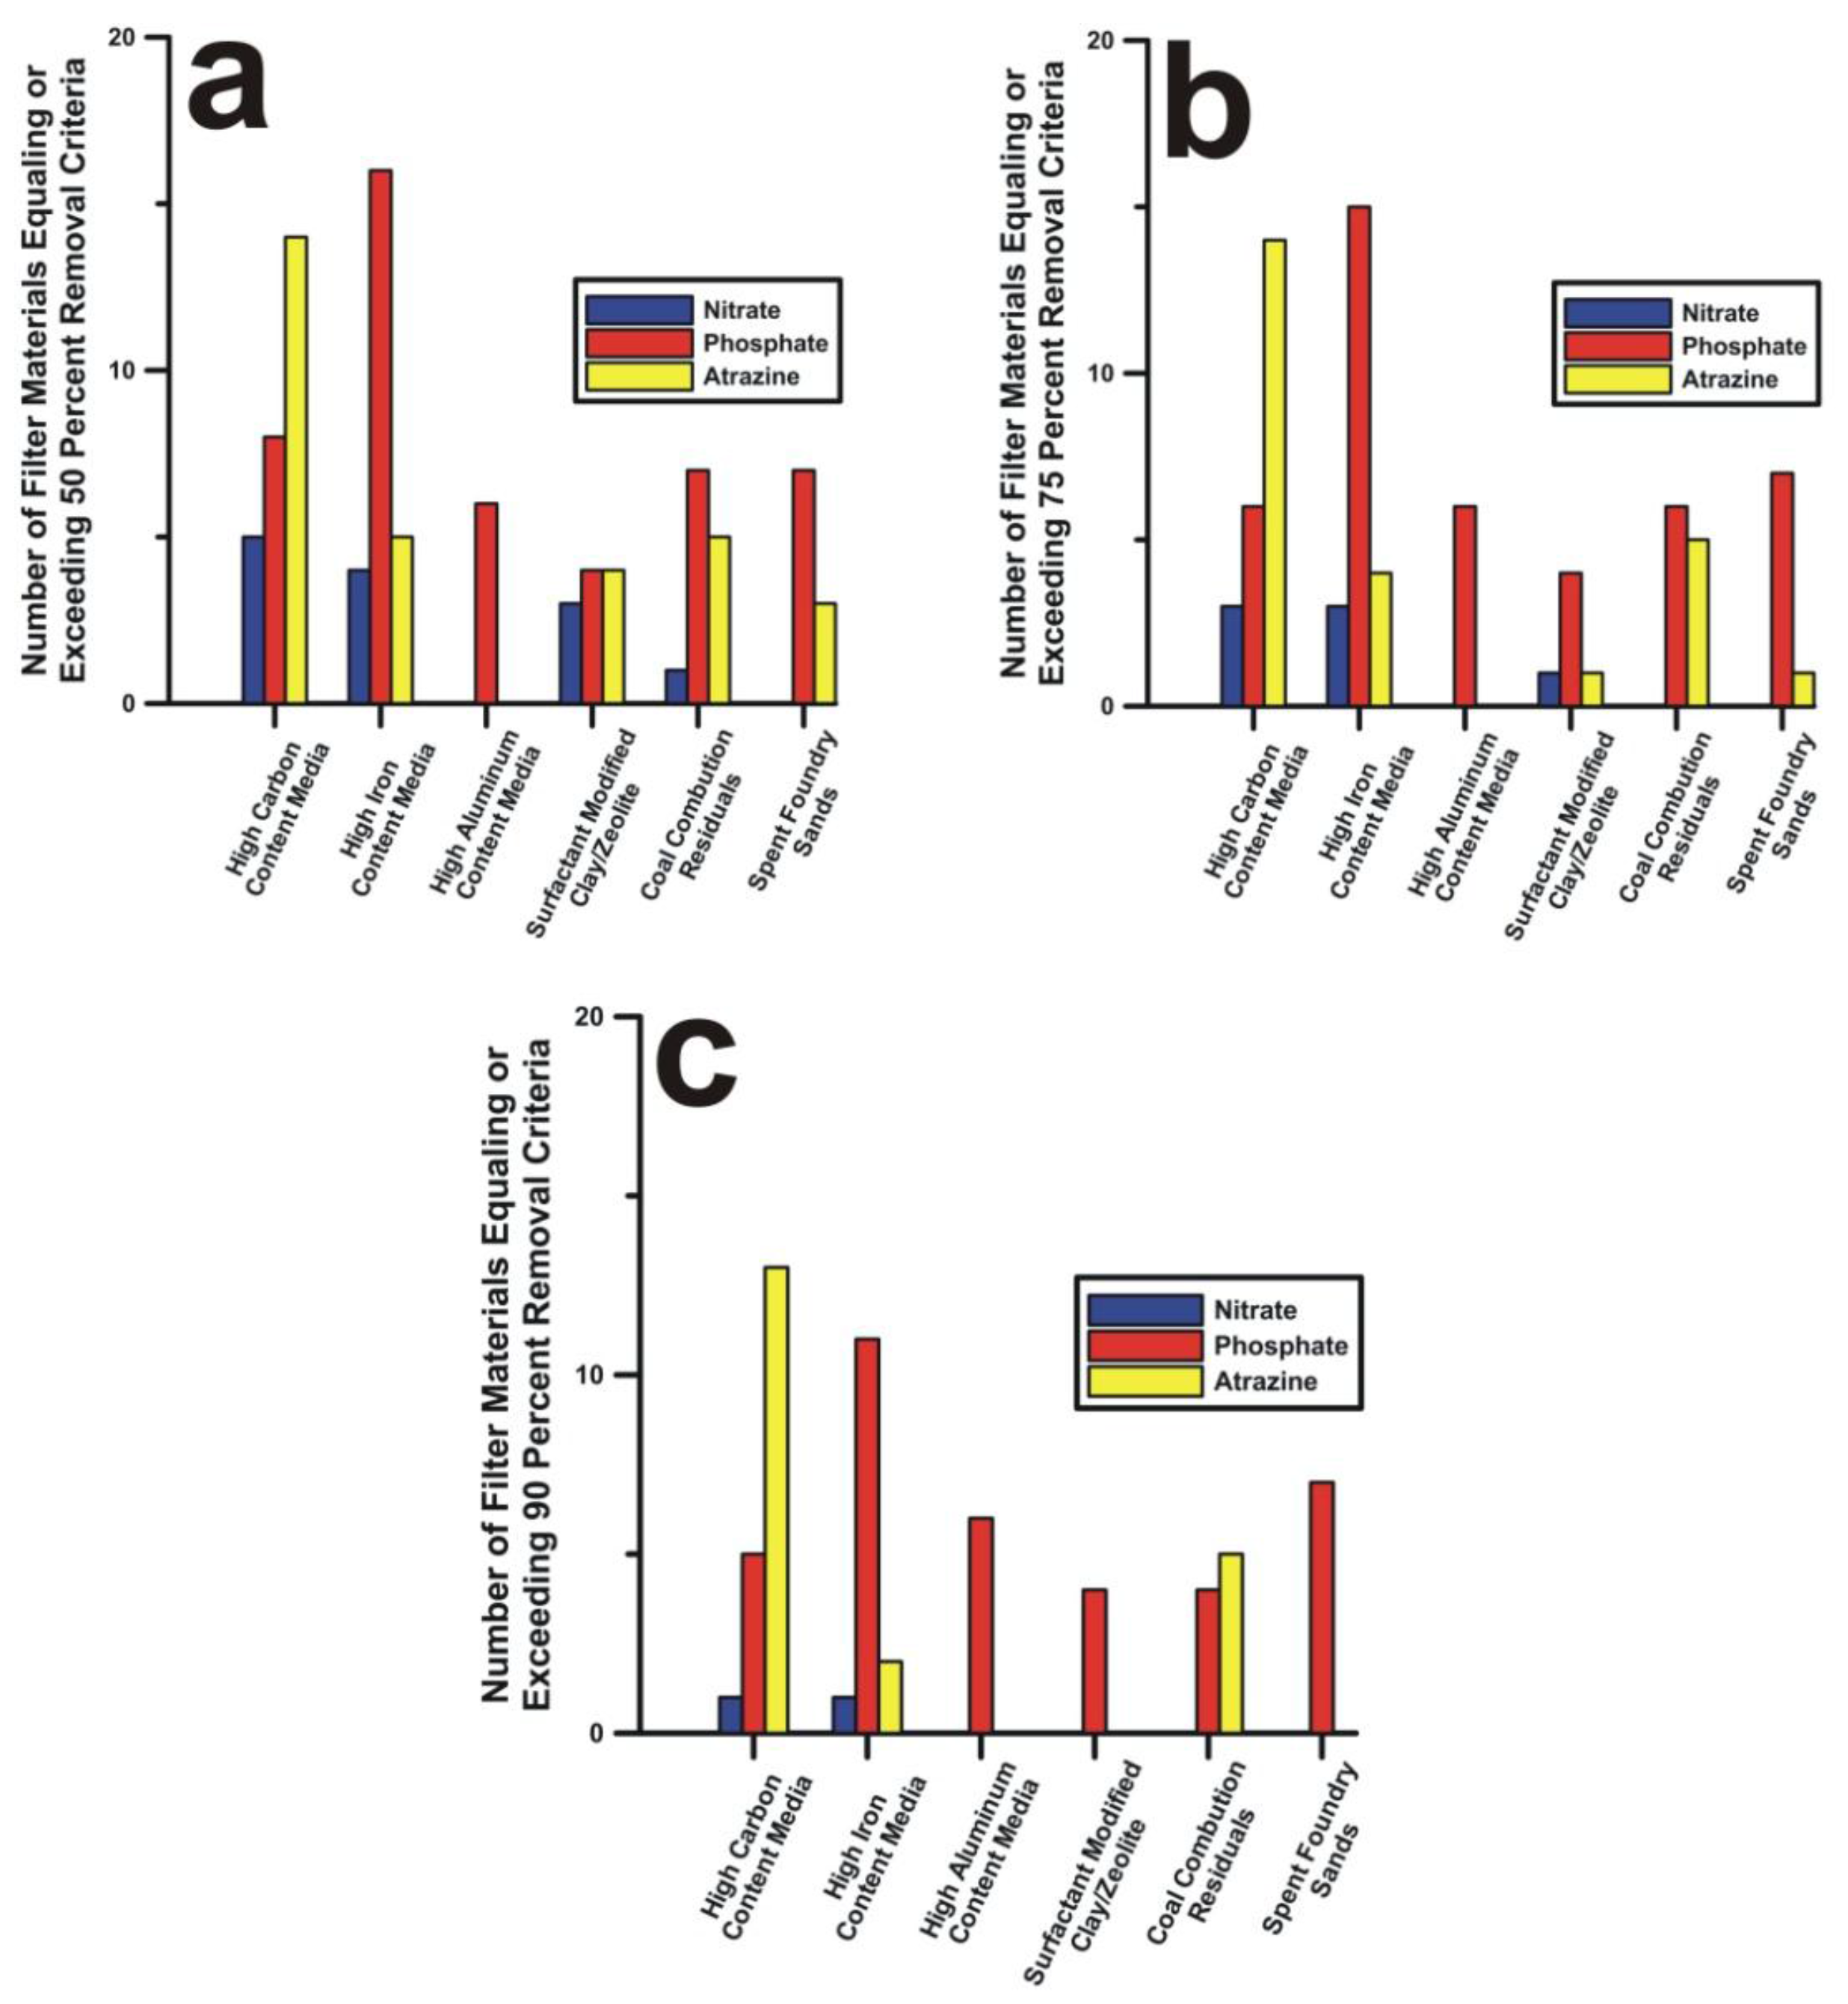
Inspection of Table 1, Table 2, Table 3, Table 4, Table 5 and Table 6 indicate that many of the 58 industrial products/byproducts may have some promise as filter materials for treating NO3−, PO43−, and/or atrazine in agricultural drainage waters. Threshold limits can be employed for quantitative determination of which filter materials have potential for drainage water treatment. For this threshold analysis, immunoassay and GC-MS measurements for percent atrazine removal were averaged together, except for the PIC and the spent foundry sand batch tests that had only immunoassay measurements available. Based on a percent contaminant removal criteria of 50% or greater, Table 1, Table 2, Table 3, Table 4, Table 5 and Table 6 show that 13 industrial products/byproducts met this standard for NO3−, 48 met this standard for PO43−, and 31 met this standard for atrazine. Based on a more selective percent contaminant removal criteria of 75% or greater, Table 1, Table 2, Table 3, Table 4, Table 5 and Table 6 show that seven industrial products/byproducts met this standard for NO3−, 44 met this standard for PO43−, and 25 met this standard for atrazine. Based on an even more stringent percent contaminant removal criteria of 90% or greater, Table 1, Table 2, Table 3, Table 4, Table 5 and Table 6 show that two industrial products/byproducts met this standard for NO3−, 37 met this standard for PO43−, and 20 met this standard for atrazine. Regardless of the criteria utilized, there were relatively few industrial products/byproducts capable of removing NO3−, while a majority can remove PO43−. The number of industrial products/byproducts potentially capable of removing atrazine is between the number capable of NO3− removal and the number capable of PO43− removal. Consequently, if the drainage water treatment goal is to remove only one of the agricultural contaminants (NO3−, PO43−, or atrazine), there are a large number of possible filter material options for PO43−, fewer for atrazine, and fewer still for NO3−.
If the goal were for drainage water treatment of all three contaminants (NO3−, PO43−, and atrazine), considering a percent removal standard of 50% or greater, Table 1, Table 2, Table 3, Table 4, Table 5 and Table 6 indicate that five filter materials (AC1, SMI3, SMC2, SMZ2, and CCR8) may have this capability. With this same 50% or greater standard, eight of the industrial products/byproducts may have capability for combined NO3− and PO43− removal, 21 of the industrial products/byproducts may have capability for combined PO43− and atrazine removal, and nine of the industrial products/byproducts may have capability for combined NO3− and atrazine removal. Therefore, the number of options for drainage water treatment of either two or all three contaminants might be somewhat limited if only one industrial product/byproduct filter material is being contemplated for use. The number of options for combined treatment of more than one drainage water contaminant will increase substantially if mixing two or more of the industrial product/byproduct filter materials were considered (assuming chemical compatibility) or the filter treatment system were designed using two separate stages, with each stage containing a different industrial product/byproduct filter material.
Due to the large differences in chemical composition/structure of members within each of the six industrial product/byproduct categories tested, it is somewhat difficult to draw meaningful conclusions regarding pH and removal behavior of NO3−, PO43−, or atrazine based just on category alone. However, some trends were noted. Batch test pH was consistent within a narrow range of 7.69 to 8.26 for spent foundry sands, while within, each of the other five categories, pH was much more variable (Table 1, Table 2, Table 3, Table 4, Table 5 and Table 6). Figure 2 depicts, by category, the number of industrial products/byproducts removing 50%, 75%, or 90% of NO3−, PO43−, or atrazine. The majority of filter materials having possible capability for drainage water NO3− treatment were found in the high carbon content media, high iron content media, and surfactant modified clay/zeolite categories. Most members in each of the six industrial product/byproduct categories show some promise with respect to PO43− removal. All of the high carbon content media filter materials, along with most of the surfactant modified clays/zeolites and coal combustion residuals, exhibited at least limited potential (≥50% removal) for atrazine treatment.
Again, the purpose the study was to delineate potential industrial product/byproduct filter materials warranting further investigation for agricultural drainage water treatment. The processes by which filter materials can remove NO3−, PO43−, and/or atrazine were previously described in the Introduction section. Although beyond the scope of this study, isolating the predominant process or processes by which a particular industrial product/byproduct filter material removes a particular contaminant (i.e., NO3−, PO43−, or atrazine) is important information and will require extensive laboratory examination with adsorption isotherm and reaction kinetics batch tests. However, some generalizations for the filter materials tested regarding NO3−, PO43−, or atrazine removal mechanisms can be postulated. Nitrate removal by activated carbon (AC1, AC2, AC3, AC4, and AC5) and surfactant modified clay/zeolite (SMC1, SMC2, SMZ1, and SMZ2) is likely due to adsorption caused by electrostatic attraction between negatively charged NO3− ions and positively charged surfaces on filter material particles [20,21,41]. The sulfur modified iron filter materials (SMI1, SMI2, and SMI3) probably removed NO3− via oxidation/reduction reactions that convert NO3− to ammonia/ammonium, NH3/NH4+, or nitrogen gas, N2 [22,23,24,25,26]. Phosphate removal by high iron content media, high aluminum content media, coal combustion residuals, and spent foundry sands could be the result of either the formation of low solubility chemical precipitates (i.e., aluminum, calcium, iron, and magnesium–phosphate compounds) [28,29,30,31] or direct PO43− adsorption via ligand exchange at oxygen containing functional group sites present along surfaces of filter material particles [29,30,31,32,33]. Phosphate removal by the high carbon content media and surfactant modified clay/zeolite is probably due to ligand exchange adsorption [29,33,57,58] and/or electrostatic attraction between negatively charged PO43− ions and positively charged filter material surfaces [34,35,36,41]. For the high carbon content media, surfactant modified clay/zeolite, coal combustion residuals, and spent foundry sand filter materials exhibiting capability for atrazine removal, the most likely removal mechanism is adsorption at filter material particle surfaces caused by London–van der Waals dispersion forces or hydrophobic interactions [37,41]. Atrazine removal by some of the high iron content media (ZVI1, ZVI2, SMI3, and PIC) is probably due to reductive dechlorination [38,39,40]. Atrazine losses during the control batch tests were minimal, thereby indicating that photodegradation did not play a significant role in atrazine removal.
Furthermore, full assessment regarding the feasibility for using a particular industrial product/byproduct or combination of industrial products/byproducts within a filter treatment system for removing NO3−, PO43−, and/or atrazine from drainage waters will also require hydraulic conductivity measurements, long duration variable flow rate saturated column experiments, regeneration capacity evaluation, determining the leaching potential for any contaminants originally present with the filter material, pilot scale field demonstrations, and economic analysis. In particular, filter treatment system design will necessitate follow-up testing of potential industrial product/byproduct materials that specifically includes hydraulic conductivity measurements, adsorption isotherm batch tests, reaction kinetics batch tests, and long duration variable flow rate saturated column experiments. The hydraulic conductivity measurements will provide insight on the flow rate capability of the filter material. The reaction kinetics batch tests and long duration variable flow rate saturated column experiments will quantify the period of contact (i.e., residence time) needed by the filter material to effectively remove NO3−, PO43−, and/or atrazine. The adsorption isotherm batch tests and long duration variable flow rate saturated column experiments will establish the total NO3−, PO43−, and/or atrazine removal capacity of the filter material. With knowledge of drainage system flow rates, and filter material characteristics (i.e., flow rate capability, residence time for contaminant removal, and total contaminant removal capacity), determinations can be made as to the size of the filter treatment system and the amount industrial product/byproduct material needed to fill it, along with the regularity in which the filter material will need to be replaced or regenerated. A limited amount of additional drainage water treatment research has been conducted on a very select few of the industrial products/byproducts tested in this study [25,26,59,60,61,62]; however, most of the other filter materials that exhibited potential remain in need of further investigation.
4. Summary and Conclusions
Discharge of agricultural drainage waters containing nitrate (NO3−), phosphate (PO43−), and pesticides can cause adverse environmental impacts on local, regional, and national scales. An in-line filter treatment system located on the main collector pipe near the subsurface drainage system outlet could be a viable means for removing NO3−, PO43−, and pesticides from drainage waters before these waters are released into local streams, rivers, and lakes. Therefore, choosing a suitable filter material for this type of water treatment system will be critical for effective removal of NO3−, PO43−, and pesticides.
There are many industrial products/byproducts that could serve as filter materials for drainage water treatment. For this reason, laboratory batch test screening was conducted on 58 industrial product/byproduct filter materials grouped into six categories: (1) high carbon content media; (2) high iron content media; (3) high aluminum content media; (4) surfactant modified clay/zeolite; (5) coal combustion residuals; and (6) spent foundry sands. Results showed that many of the industrial product/byproduct filter materials have capacity to significantly alter drainage water pH, which needs to be taken into account when choosing a filter material, because releasing either extremely low or high pH drainage waters into local waterways could cause ecosystem damage.
With regard to nutrient and pesticide treatment, based on a percent contaminant removal criteria of 50% or greater, 13 industrial products/byproducts met this standard for NO3−, 48 met this standard for PO43−, and 31 met this standard for the organochloride pesticide, atrazine. Based on a more selective percent contaminant removal criteria of 75% or greater, seven industrial products/byproducts met this standard for NO3−, 44 met this standard for PO43−, and 25 met this standard for atrazine. Based on an even more stringent percent contaminant removal criteria of 90% or greater, two industrial products/byproducts met this standard for NO3−, 37 met this standard for PO43−, and 20 met this standard for atrazine. Using a 50% or greater contaminant removal criteria, five of the industrial product/byproduct filter materials exhibited potential for removing NO3−, PO43−, and atrazine together; eight showed capability for combined NO3− and PO43− removal; 21 showed capability for combined PO43− and atrazine removal; and nine showed capability for combined NO3− and atrazine removal. Consequently, there are quite a few possibilities for treating a single drainage water contaminant (e.g., NO3−, PO43−, or atrazine); however, effective treatment of more than one drainage water contaminant simultaneously may require consideration with respect to the mixing of two or more of the industrial product/byproduct filter materials together (assuming chemical compatibility) or installation of a two-stage filter treatment system, with each stage containing a different industrial product/byproduct filter material.
Consequently, a number of industrial product/byproduct filter materials were determined to have potential for use in removing NO3−, PO43−, and/or atrazine from drainage waters. For a complete drainage water treatment feasibility evaluation of the most promising of these industrial product/byproduct filter materials, much more extensive research is needed. This additional investigation should include adsorption isotherm and reaction kinetics batch tests, hydraulic conductivity measurements, long duration variable flow rate saturated column experiments, regeneration capacity evaluation, determining the leaching potential for any contaminants originally present with the filter material, pilot scale field demonstrations, and economic analysis.
Conflicts of Interest
The author declares no conflict of interest.
Appendix
Batch test results with nitrate-nitrogen, phosphate-phosphorous and atrazine removal calculated as milligrams of contaminant removed per gram of filter material.

Table A1.
Batch test screening results for high carbon content media.
| Industrial Product/Byproduct | Dry (Wet) Filter Material Amount (g) | Test Solution Amount (g) | Avg. pH | Nitrate-N Average Removal (mg/g) | Phosphate-P Average Removal (mg/g) | Atrazine Immunoassay Average Removal (mg/g) | Atrazine GC-MS Average Removal (mg/g) |
|---|---|---|---|---|---|---|---|
| COAL1 | 5.0 | 38.0 | 6.36 | 0.025 | 0.00180 | 0.00303 | 0.00304 |
| COAL2 | 5.0 | 38.0 | 2.91 | 0.359 | *** | 0.00272 | 0.00278 |
| COAL3 | 5.0 | 38.0 | 7.98 | ~0 | 0.00190 | 0.00304 | 0.00304 |
| COAL4 | 5.0 | 39.5 | 7.79 | 0.013 | 0.00191 | 0.00316 | 0.00316 |
| COAL5 | 5.0 | 38.0 | 6.51 | ~0 | 0.00186 | 0.00299 | 0.00291 |
| COAL6 | 5.0 | 38.0 | 6.64 | ~0 | 0.00099 | 0.00276 | 0.00287 |
| COKE1 | 5.0 | 40.0 | 7.25 | 0.015 | 0.00180 | 0.00315 | 0.00320 |
| COKE2 | 5.0 | 39.0 | 7.16 | 0.016 | 0.00004 | 0.00226 | 0.00271 |
| CHAR | 5.0 | 38.0 | 8.42 | ~0 | *** | 0.00302 | 0.00304 |
| AC1 | 5.0 | 38.0 | 9.01 | 0.236 | 0.00134 | 0.00303 | 0.00304 |
| AC2 | 5.0 | 40.0 | 10.13 | 0.206 | *** | 0.00320 | 0.00320 |
| AC3 | 5.0 | 38.0 | 1.97 | 0.320 | *** | 0.00304 | 0.00304 |
| AC4 | 5.0 | 40.0 | 7.81 | 0.321 | *** | 0.00320 | 0.00320 |
| AC5 | 2.5 | 39.0 | 11.91 | 0.071 | 0.00371 | 0.00623 | 0.00312 |
*** Signifies that substantially more phosphate-P was present in solution at the completion of the batch test than was present at the beginning of the batch test, thus indicating that the treatment material itself originally had significant quantities of readily released phosphate.
Table A2.
Batch test screening results for high iron content media.
| Industrial Product/Byproduct | Dry (Wet) Filter Material Amount (g) | Test Solution Amount (g) | Avg. pH | Nitrate-N Average Removal (mg/g) | Phosphate-P Average Removal (mg/g) | Atrazine Immunoassay Average Removal (mg/g) | Atrazine GC-MS Average Removal (mg/g) |
|---|---|---|---|---|---|---|---|
| ZVI1 | 4.9 (5.0) | 40.0 | 9.21 | 0.040 | 0.00195 | 0.00286 | 0.00297 |
| ZVI2 | 4.8 (5.0) | 40.0 | 9.58 | 0.025 | 0.00207 | 0.00317 | 0.00319 |
| ZVI3 | 4.3 (5.0) | 40.0 | 9.54 | ~0 | 0.00228 | 0.00020 | 0.00046 |
| ZVI4 | 3.9 (5.0) | 40.0 | 10.32 | 0.021 | 0.00255 | ~0 | 0.00051 |
| SMI1 | 4.3 (5.0) | 40.0 | 9.68 | 0.294 | 0.00230 | 0.00061 | 0.00112 |
| SMI2 | 5.0 | 40.0 | 9.12 | 0.301 | 0.00192 | 0.00086 | 0.00118 |
| SMI3 | 5.0 | 40.0 | 3.09 | 0.394 | 0.00188 | 0.00198 | 0.00264 |
| PIC | 5.0 | 40.0 | 10.70 1 | 0.145 | *** 2 | 0.00320 | - 3 |
| IS1 | 5.0 | 40.0 | 4.43 | 0.023 | 0.00147 | 0.00202 | 0.00288 |
| IS2 | 5.0 | 40.0 | 4.82 | 0.345 | 0.00198 | 0.00081 | 0.00090 |
| IS3 | 5.0 | 40.0 | 5.87 | 0.022 | 0.00179 | 0.00064 | 0.00074 |
| IO1 | 5.0 | 40.0 | 7.14 | 0.004 | 0.00179 | 0.00036 | 0.00015 |
| IO2 | 5.0 | 40.0 | 6.58 | ~0 | 0.00186 | 0.00050 | 0.00043 |
| IO3 | 5.0 | 40.0 | 5.49 | ~0 | 0.00200 | 0.00005 | 0.00094 |
| IO4 | 5.0 | 40.0 | 6.44 | ~0 | 0.00200 | ~0 | 0.00048 |
| IO5 | 0.7 (5.0) | 40.0 | 6.29 | 0.137 | 0.01091 | 0.00306 | ~0 |
| IO6 | 1.0 | 40.0 | 6.23 | 0.068 | 0.00893 | 0.00136 | 0.00218 |
1 For PIC, average pH is based on three replicate batch tests instead of six replicate batch tests; 2 *** Signifies that substantially more phosphate-P was present in solution at the completion of the batch test than was present at the beginning of the batch test, thus indicating that PIC itself originally had significant quantities of readily released phosphate; 3 - Signifies that atrazine was not measured with GC-MS for the PIC batch tests.
Table A3.
Batch test screening results for high aluminum content media.
| Industrial Product/Byproduct | Dry (Wet) Filter Material Amount (g) | Test Solution Amount (g) | Avg. pH | Nitrate-N Average Removal (mg/g) | Phosphate-P Average Removal (mg/g) | Atrazine Immunoassay Average Removal (mg/g) | Atrazine GC-MS Average Removal (mg/g) |
|---|---|---|---|---|---|---|---|
| AO1 | 5.0 | 40.0 | 6.41 | ~0 | 0.00200 | 0.00021 | ~0 |
| AO2 | 5.0 | 40.0 | 6.92 | 0.016 | 0.00189 | 0.00041 | ~0 |
| AO3 | 5.0 | 40.0 | 6.10 | 0.006 | 0.00187 | 0.00060 | ~0 |
| AO4 | 5.0 | 40.0 | 8.25 | 0.007 | 0.00193 | 0.00031 | ~0 |
| AO5 | 5.0 | 40.0 | 8.08 | 0.005 | 0.00189 | 0.00033 | ~0 |
| AO6 | 1.0 | 40.0 | 6.06 | 0.034 | 0.00929 | 0.00184 | ~0 |
Table A4.
Batch test screening results for surfactant modified clay/zeolite.
| Industrial Product/Byproduct | Dry (Wet) Filter Material Amount (g) | Test Solution Amount (g) | Avg. pH | Nitrate-N Average Removal (mg/g) | Phosphate-P Average Removal (mg/g) | Atrazine Immunoassay Average Removal (mg/g) | Atrazine GC-MS Average Removal (mg/g) |
|---|---|---|---|---|---|---|---|
| SMC1 | 3.03 (5.0) | 38.0 | 7.79 | 0.442 | *** | 0.00197 | 0.00375 |
| SMC2 | 2.29 (5.0) | 40.0 | 6.25 | 0.738 | 0.00416 | 0.00507 | 0.00592 |
| SMC3 | 2.14 (5.0) | 40.0 | 8.91 | 0.031 | 0.00456 | 0.00278 | 0.00303 |
| SMZ1 | 4.00 (5.0) | 40.0 | 8.02 | 0.243 | *** | 0.00154 | 0.00276 |
| SMZ2 | 3.80 (5.0) | 40.0 | 9.33 | 0.347 | 0.00242 | 0.00252 | 0.00349 |
| SMZ3 | 4.02 (5.0) | 40.0 | 8.62 | ~0 | 0.0023 | 0.00109 | 0.00145 |
*** Signifies that substantially more phosphate-P was present in solution at the completion of the batch test than was present at the beginning of the batch test, thus indicating that the treatment material itself originally contained significant quantities of readily released phosphate.
Table A5.
Batch test screening results for coal combustion residuals.
| Industrial Product/Byproduct | Dry (Wet) Filter Material Amount (g) | Test Solution Amount (g) | Avg. pH | Nitrate-N Average Removal (mg/g) | Phosphate-P Average Removal (mg/g) | Atrazine Immunoassay Average Removal (mg/g) | Atrazine GC-MS Average Removal (mg/g) |
|---|---|---|---|---|---|---|---|
| CCR1 | 5.0 | 40.0 | 11.85 | ~0 | 0.00088 | 0.00320 | 0.00320 |
| CCR2 | 5.0 | 40.0 | 6.63 | ~0 | 0.00166 | 0.00057 | 0.00095 |
| CCR3 | 5.0 | 40.0 | 12.07 | ~0 | 0.00192 | 0.00066 | 0.00103 |
| CCR4 | 5.0 | 40.0 | 8.80 | ~0 | 0.00192 | 0.00046 | 0.00052 |
| CCR5 | 4.22 (5.0) | 40.0 | 8.99 | ~0 | 0.00209 | 0.00379 | 0.00379 |
| CCR6 | 5.0 | 40.0 | 6.32 | ~0 | 0.00139 | 0.00311 | 0.00318 |
| CCR7 | 5.0 | 40.0 | 7.99 | ~0 | 0.00197 | 0.00320 | 0.00320 |
| CCR8 | 5.0 | 40.0 | 13.05 | 0.298 | 0.00189 | 0.00320 | 0.00320 |
Table A6.
Batch test screening results for spent foundry sands.
| Industrial Product/Byproduct | Dry (Wet) Filter Material Amount (g) | Test Solution Amount (g) | Avg. pH 1 | Nitrate-N Average Removal (mg/g) | Phosphate-P Average Removal (mg/g) | Atrazine Immunoassay Average Removal (mg/g) | Atrazine GC-MS Average Removal (mg/g) |
|---|---|---|---|---|---|---|---|
| FS1 | 5.0 | 40.0 | 8.26 | 0.006 | 0.00190 | 0.00059 | - 2 |
| FS2 | 5.0 | 40.0 | 8.17 | 0.007 | 0.00198 | 0.00144 | - |
| FS3 | 5.0 | 40.0 | 7.82 | ~0 | 0.00189 | 0.00244 | - |
| FS4 | 5.0 | 40.0 | 7.88 | 0.011 | 0.00189 | 0.00189 | - |
| FS5 | 5.0 | 40.0 | 7.79 | 0.012 | 0.00195 | 0.00156 | - |
| FS6 | 5.0 | 40.0 | 7.80 | 0.002 | 0.00192 | 0.00162 | - |
| FS7 | 5.0 | 40.0 | 7.69 | 0.009 | 0.00190 | 0.00114 | - |
1 The pH was measured on only one batch test replicate; 2 - Signifies that atrazine was not measured with GC-MS.
References
- Goolsby, D.A.; Battaglin, W.A. Nitrogen in the Mississippi Basin—Estimating Sources and Predicting Flux to the Gulf of Mexico; U.S. Geological Survey Fact Sheet135-00; USGS: Reston, VA, USA, 2000; pp. 1–6.
- Myers, D.N.; Thomas, M.A.; Frey, J.W.; Rheaume, S.J.; Button, D.T. Water quality in the Lake Erie—Lake Saint Clair drainages: Michigan, Ohio, Indiana, New York, and Pennsylvania, 1996–1998; U.S. Geological Survey Circular 1203; USGS: Denver, Colorado, USA, 2000; pp. 1–35.
- Sylvan, J.B.; Dortch, Q.; Nelson, D.M.; Maier Brown, A.F.; Morrison, W.; Ammerman, J.W. Phosphorous limits phytoplankton growth on the Louisiana Shelf during the period of hypoxia formation. Environ. Sci. Technol. 2006, 40, 7548–7553. [Google Scholar] [CrossRef] [PubMed]
- Scavia, D.; Donnelly, K.A. Reassessing hypoxia forecasts for the Gulf of Mexico. Environ. Sci. Technol. 2007, 41, 8111–8177. [Google Scholar] [CrossRef] [PubMed]
- Alexander, R.B.; Smith, R.A.; Schwarz, G.E.; Boyer, E.W.; Nolan, J.V.; Brakebill, J.W. Differences in phosphorous and nitrogen delivery to the Gulf of Mexico from the Mississippi River Basin. Environ. Sci. Technol. 2008, 42, 822–830. [Google Scholar] [CrossRef] [PubMed]
- Zucker, L.A.; Brown, L.C. Agricultural Drainage: Water Quality Impacts and Subsurface Drainage Studies in the Midwest; OSU Extension Bulletin 871; Ohio State University: Columbus, OH, USA, 1998; pp. 1–40. [Google Scholar]
- Kalita, P.K.; Algoazany, A.S.; Mitchell, J.K.; Cooke, R.A.; Hirschi, M.C. Subsurface water quality from a flat tile-drained watershed in Illinois U.S.A. Agric. Ecosyst. Environ. 2006, 115, 183–193. [Google Scholar] [CrossRef]
- Kalita, P.K.; Cooke, R.A.; Anderson, S.M.; Hirschi, M.C.; Mitchell, J.K. Subsurface drainage and water quality: The Illinois experience. Trans. ASABE 2007, 50, 1651–1656. [Google Scholar] [CrossRef]
- Kladivko, E.J.; Van Scoyoc, G.E.; Monke, E.J.; Oates, K.M.; Pask, W. Pesticide and nutrient movement into subsurface tile drains on a silt loam soil in Indiana. J. Environ. Qual. 1991, 20, 264–270. [Google Scholar] [CrossRef]
- Beauchemin, S.; Simard, R.R.; Cluis, D. Forms and concentration of phosphorus in drainage water of twenty-seven tile-drained soils. J. Environ. Qual. 1998, 27, 721–728. [Google Scholar] [CrossRef]
- Sims, J.T.; Simard, R.R.; Joern, B.C. Phosphorus loss in agricultural drainage: Historical perspective and current research. J. Environ. Qual. 1998, 27, 277–293. [Google Scholar] [CrossRef]
- Laubel, A.; Jacobsen, O.H.; Kronvang, B.; Grant, R.; Andersen, H.E. Subsurface drainage loss of particles and phosphorus from field plot experiments and a tile-drained catchment. J. Environ. Qual. 1999, 28, 576–584. [Google Scholar] [CrossRef]
- Lu, J. Characteristics of phosphorus components in drainage water. Bull. Environ. Contam. Toxicol. 2004, 72, 289–297. [Google Scholar] [CrossRef] [PubMed]
- Kinley, R.D.; Gordon, R.J.; Stratton, G.W.; Patterson, G.T.; Hoyle, J. Phosphorus losses through agricultural tile drainage in Nova Scotia, Canada. J. Environ. Qual. 2007, 36, 469–477. [Google Scholar] [CrossRef] [PubMed]
- Dousset, S.; Babut, M.; Andreux, F.; Schiavon, M. Alachlor and bentazone losses from subsurface drainage of two soils. J. Environ. Qual. 2004, 33, 294–301. [Google Scholar] [CrossRef] [PubMed]
- Gaynor, J.D.; MacTavish, D.C.; Findlay, W.I. Atrazine and metolachor loss in surface and subsurface runoff from three tillage treatments in corn. J. Environ. Qual. 1995, 24, 246–256. [Google Scholar] [CrossRef]
- Kladivko, E.J.; Grochulska, J.; Turco, R.F.; Van Scoyoc, G.E.; Eigel, J.D. Pesticide and nitrate transport into subsurface tile drains of different spacings. J. Environ. Qual. 1999, 28, 997–1004. [Google Scholar] [CrossRef]
- Yuan, Y.; Mitchell, J.K.; Walker, S.E.; Hirschi, M.C.; Cooke, R.A.C. Atrazine losses from corn fields in the Little Vermilion River Watershed in east central Illinois. Appl. Eng. Agric. 2000, 16, 51–56. [Google Scholar] [CrossRef]
- Gaynor, J.D.; Tan, C.S.; Drury, C.F.; Van Wesenbeeck, I.J.; Welacky, T.W. Atrazine in surface and subsurface runoff as affected by cultural practices. Water Qual. J. Can. 1995, 30, 513–531. [Google Scholar]
- Wong, M.T.F.; Huges, R.; Rowell, D.L. Retarded leaching of nitrate in acid soils from the tropics: Measurement of effective anion exchange capacity. J. Soil Sci. 1990, 41, 655–663. [Google Scholar] [CrossRef]
- Allred, B.J.; Bigham, J.M.; Brown, G.O. The impact of clay mineralogy on nitrate mobility under unsaturated flow conditions. Vadose Zone J. 2007, 6, 221–232. [Google Scholar] [CrossRef]
- Choe, S.; Chang, Y.; Hwang, K.; Khim, J. Kinetics of reductive denitrification by nanoscale zero-valent iron. Chemosphere 2000, 41, 1307–1311. [Google Scholar] [CrossRef]
- Westerhoff, P.; James, J. Nitrate removal in zero-valent iron packed columns. Water Res. 2003, 37, 1818–1830. [Google Scholar] [CrossRef]
- Biswas, S.; Bose, P. Zero-valent iron-assissted autotrophic denitrification. J. Environ. Eng. 2005, 131, 1212–1220. [Google Scholar] [CrossRef]
- Allred, B.J. Laboratory evaluation of zero valent iron and sulfur-modified iron for agricultural drainage water treatment. Groundw. Monit. Remedat. 2012, 32, 81–95. [Google Scholar] [CrossRef]
- Allred, B.J. Laboratory evaluation of porous iron composite for agricultural drainage water filter treatment. Trans. ASABE 2012, 55, 1683–1697. [Google Scholar] [CrossRef]
- Lide, D.R. (Ed.) Solubility Chart. In CRC Handbook of Chemistry and Physics, 75th ed.; CRC Press: Boca Raton, FL, USA, 1994; Section 8; pp. 60–62. [Google Scholar]
- Stumm, W.; Morgan, J.J. Aquatic Chemistry: An Introduction Emphasizing Chemical Equilibria in Natural Waters, 2nd ed.; John Wiley & Sons: New York, NY, USA, 1981; pp. 282–285. [Google Scholar]
- Bohn, H.L.; McNeal, B.L.; O’Connor, G.A. Soil Chemistry, 2nd ed.; John Wiley & Sons: New York, NY, USA, 1985; pp. 190–194. [Google Scholar]
- Li, L.; Stanforth, R. Distinguishing adsorption and surface precipitation of phosphate on goethite (α-FeOOH). J. Colloid Int. Sci. 2000, 230, 12–21. [Google Scholar] [CrossRef] [PubMed]
- Robertson, W.D.; Lombardo, P.S. Treatment of wastewater phosphate by reductive dissolution of iron: Use of ferric oxyhydroxide media. J. Environ. Qual. 2011, 40, 1955–1962. [Google Scholar] [CrossRef] [PubMed]
- Goldberg, S. Chemical modeling of anion competition on goethite using the constant capacitance model. Soil Sci. Soc. Am. J. 1985, 49, 851–856. [Google Scholar] [CrossRef]
- McBride, M.B. Environmental Chemistry of Soils; Oxford University Press, Inc.: New York, NY, USA, 1994; pp. 135–139, 372–378. [Google Scholar]
- Barrow, N.J.; Bowden, J.W.; Posner, A.M.; Quirk, J.P. Describing the effects of electrolyte on adsorption of phosphate by a variable charge surface. Aust. J. Soil Res. 1980, 18, 395–404. [Google Scholar] [CrossRef]
- Arai, Y.; Sparks, D.L. Phosphate reaction dynamics in soils and soil components: A multiscale approach. In Advances in Agronomy; Sparks, D.L., Ed.; Academic Press: San Diego, CA, USA, 2007; pp. 135–179. [Google Scholar]
- Wang, Y.; Jiang, J.; Xu, R.; Tiwari, D. Phosphate adsorption at variable charge soil/water interfaces as influenced by ionic strength. Aust. J. Soil Res. 2009, 47, 529–536. [Google Scholar] [CrossRef]
- Rosen, M.J. Surfactants and Interfacial Phenomena, 2nd ed.; John Wiley & Sons: New York, NY, USA, 1989; pp. 39–42. [Google Scholar]
- Dombek, T.; Dolan, E.; Schultz, J.; Klaruo, D. Rapid reductive dechlorination of atrazine by zero-valent iron under acid conditions. Environ. Pollut. 2001, 111, 21–27. [Google Scholar] [CrossRef]
- Kim, G.; Jeong, W.; Choe, S. Impact of pH buffer capacity of sediment on dechlorination of atrazine using zero valent iron. J. Environ. Sci. Health Part B 2007, 42, 287–295. [Google Scholar] [CrossRef] [PubMed]
- Satapanajaru, T.; Anurakpongsatorn, P.; Pengthamkeerati, P.; Boparai, H. Remediation of atrazine-contaminated soil and water by nano zerovalent iron. Water Air Soil Pollut. 2008, 192, 349–359. [Google Scholar] [CrossRef]
- Bowman, R.S.; Haggerty, G.M.; Huddleston, R.G.; Neel, D.; Flynn, M.M. Chapter 5: Sorption of nonpolar organic compounds, inorganic cations, and inorganic oxyanions by surfactant-modified zeolites. In Surfactant-Enhanced Subsurface Remediation: Emerging Technologies; ACS Symposium Series 594; Sabatini, D.A., Knox, R.C., Harwell, J.H., Eds.; American Chemical Society: Washington, DC, USA, 1995; pp. 54–64. [Google Scholar]
- Ahn, C.; Mitsch, W.J.; Wolfe, W.E. Effects of recycled FGD liner materail on water quality and macrophytes of constructed wetlands: A Mesocosm experiment. Water Res. 2001, 35, 633–642. [Google Scholar] [CrossRef]
- Lee, T.; Benson, C.H. Sorption and degradation of alachlor and metochlor in ground water using green sands. J. Environ. Qual. 2004, 33, 1682–1693. [Google Scholar] [CrossRef] [PubMed]
- Jeong, Y.; Fan, M.; Singh, S.; Chuang, C.-L.; Saha, B.; van Leeuwen, J.H. Evaluation of iron oxide and aluminum oxide as potential arsenic(V) adsorbents. Chem. Eng. Process. 2007, 46, 1030–1039. [Google Scholar] [CrossRef]
- Gupta, V.K.; Gupta, B.; Rastogi, A.; Agarwal, S.; Nayak, A. Pesticides removal from waste water by activated carbon prepared from waste rubber tire. Water Res. 2011, 45, 4047–4055. [Google Scholar] [CrossRef] [PubMed]
- Hornbuckle, J.W.; Christen, E.W.; Faulkner, R.D. Evaluating a multi-level subsurface drainage for improved drainage water quality. Agric. Water Manag. 2007, 89, 208–216. [Google Scholar] [CrossRef]
- Wichelns, D.; Cone, D.; Stuhr, G. Evaluating the impact of irrigation and drainage policies on agricultural sustainability. Irrig. Drain. Syst. 2002, 16, 1–14. [Google Scholar] [CrossRef]
- Smedema, L.K.; Vlotman, W.F.; Rycroft, D.W. Modern Land Drainage: Planning, Design and Management of Agricultural Drainage Systems; A.A. Balkema Publishers: Leiden, The Netherlands, 2004; pp. 231–255. [Google Scholar]
- Henschke, C.; Hermann, T. Testing for Soil and Water Salinity; Fact Sheet 66/00; Government of South Australia—Primary Industries and Resources SA: Adelaide, Australia, 2007; pp. 1–4.
- Satapanajaru, T.; Comfort, S.D.; Shea, P.J. Enhancing metolachlor destruction rates with aluminum and iron salts during zerovalent iron treatment. J. Environ. Qual. 2003, 32, 1726–1734. [Google Scholar] [CrossRef] [PubMed]
- Cheng, S.F.; Huang, C.Y.; Liu, J.Y. Study of different methods for enhancing the nitrate removal efficiency of a zero-valent metal process. Water Sci. Technol. 2006, 53, 81–87. [Google Scholar] [CrossRef]
- Lee, S.; Lee, K.; Rhee, S.; Park, J. Development of a new zero-valent iron zeolite material to reduce nitrate without ammonium release. J. Environ. Eng. 2007, 133, 6–12. [Google Scholar] [CrossRef]
- Ahn, S.C.; Oh, S.; Cha, D.K. Enhanced reduction of nitrate by zero-valent iron at elevated temperatures. J. Hazard. Mater. 2008, 156, 17–22. [Google Scholar] [CrossRef] [PubMed]
- Parsons, T.R.; Maita, Y.; Lalli, C.M. A Manual of Chemical and Biological Methods for Seawater Analysis; Pergamon Press: Oxford, UK, 1984; pp. 1–173. [Google Scholar]
- Herzog, D.R. Immunoassays for Environmental Contaminants: (Pesticides) in Food and Water; Technical Bulletin T00037; Strategic Diagnostics Inc.: Newark, NJ, USA, 1997; pp. 1–26.
- Munch, J.W. Method 525.2: Determination of organic compounds in drinking water by liquid-solid extraction and capillary column gas chromatography/mass spectrometry. In Methods for the Determination of Organic Compounds in Drinking Water; Publication—EPA/600/R-95/131; U.S. Environmental Protection Agency: Washington, DC, USA, 1995; pp. 525.2.1–525.2.60. [Google Scholar]
- Rivera-Utrilla, J.; Sanchez-Polo, M. The role of dispersive and electrostaticinteractions in the aqueous phase adsorption of naphthalenesulphonic acids on ozone-treated activated carbons. Carbon 2002, 40, 2685–2691. [Google Scholar] [CrossRef]
- Tsang, D.C.W.; Hu, J.; Liu, M.Y.; Zhang, W.; Lai, K.C.K.; Lo, I.M.C. Activated carbon produced from waste wood pallets: Adsorption of three classes of dyes. Water Air Soil Pollut. 2007, 184, 141–155. [Google Scholar] [CrossRef]
- Allred, B.J. Laboratory batch test evaluation of effectiveness and efficiency for five filter materials potentially used to remove nutrients and pesticides from subsurface drainage waters. Trans. ASABE 2010, 53, 39–54. [Google Scholar] [CrossRef]
- Allred, B.J.; Racharaks, R. Laboratory comparison of four iron-based filter materials for drainage water phosphate treatment. Water Environ. Res. 2014, 86, 852–862. [Google Scholar] [CrossRef] [PubMed]
- Allred, B.J.; Racharaks, R. Preliminary laboratory evaluation of iron-bearing reactive media for pesticide water treatment. Appl. Eng. Agric. 2014, 30, 859–867. [Google Scholar]
- Allred, B.J.; Martinez, L.R.; Gamble, D.L. Phosphate removal from agricultural drainage water using an iron oxyhydroxide filter material. Water Air Soil Pollut. 2017, 228, 240. Available online: https://doi.org/10.1007/s11270-017-3410-9 (accessed on 8 June 2017).
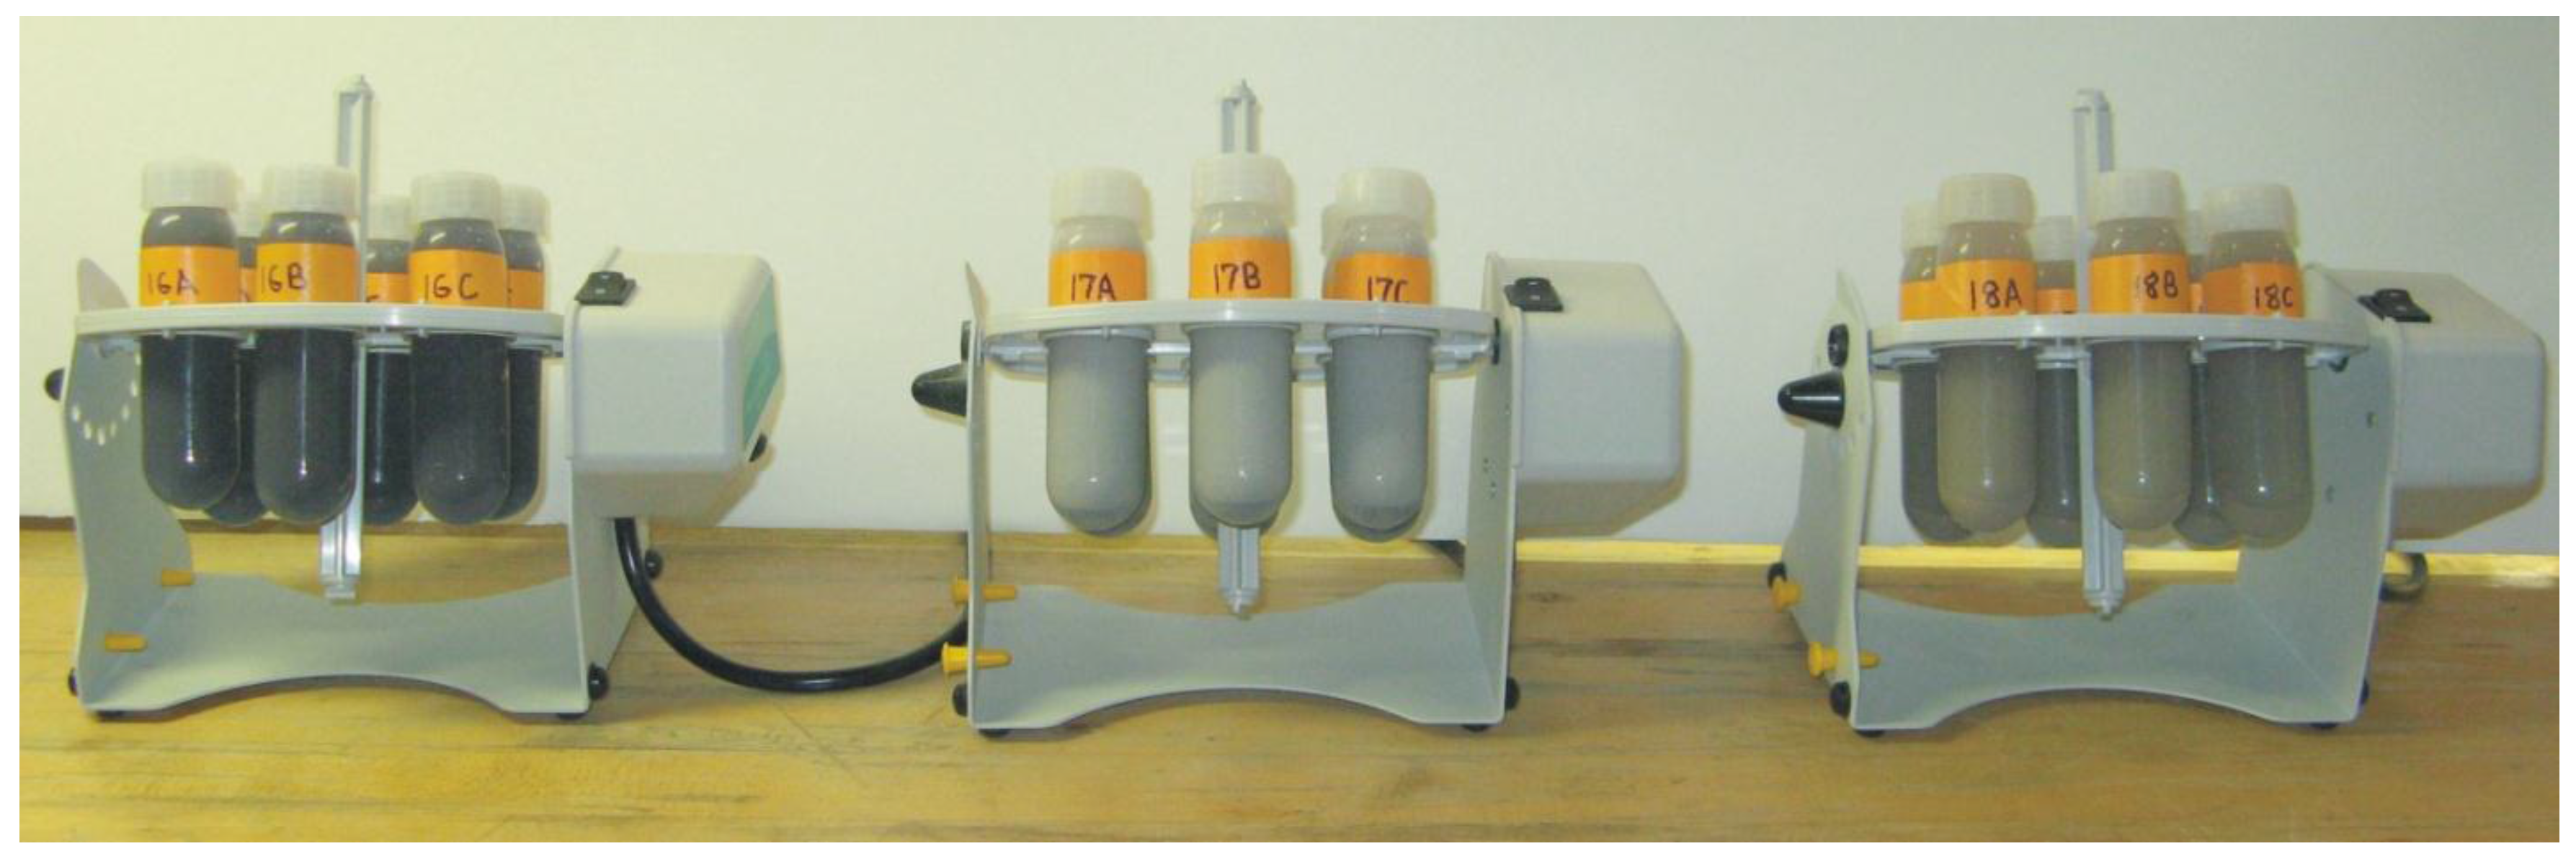
Figure 1.
Filter material and test solution mixed in Teflon centrifuge tubes mounted on laboratory rotators.
Figure 1.
Filter material and test solution mixed in Teflon centrifuge tubes mounted on laboratory rotators.

Figure 2.
Number of filter materials, by industrial product/byproduct category, removing: (a) 50%; (b) 75%; or (c) 90% of NO3−, PO43−, or atrazine. Note: Atrazine numbers are based on averaging immunoassay and GC-MS measurements together, except for the PIC and the spent foundry sand batch tests that had only immunoassay measurements available.

Table 1.
Batch test screening results for high carbon content media.
| Industrial Product/Byproduct | Dry (Wet) Filter Material Amount (g) | Test Solution Amount (g) | Avg. pH | Nitrate-N Average of Percent Removal and (Std. Dev.) | Phosphate-P Average of Percent Removal and (Std. Dev.) | Atrazine Immunoassay Average of Percent Removal and (Std. Dev.) | Atrazine GC-MS Average of Percent Removal and (Std. Dev.) |
|---|---|---|---|---|---|---|---|
| COAL1 | 5.0 | 38.0 | 6.36 | 6.7 (0.3) | 94.9 (1.7) | 99.7 (0.5) | 100.0 (~0.0) |
| COAL2 | 5.0 | 38.0 | 2.91 | 94.6 (0.8) | *** | 89.4 (2.4) | 91.5 (0.9) |
| COAL3 | 5.0 | 38.0 | 7.98 | −1.0 (2.5) | 100.0 (~0.0) | 100.0 (~0.0) | 100.0 (~0.0) |
| COAL4 | 5.0 | 39.5 | 7.79 | 3.3 (0.7) | 96.5 (3.1) | 100.0 (~0.0) | 100.0 (~0.0) |
| COAL5 | 5.0 | 38.0 | 6.51 | −1.8 (0.4) | 98.1 (2.9) | 98.4 (0.9) | 95.7 (0.6) |
| COAL6 | 5.0 | 38.0 | 6.64 | −1.2 (1.6) | 52.6 (6.0) | 90.8 (0.9) | 94.5 (0.6) |
| COKE1 | 5.0 | 40.0 | 7.25 | 3.7 (0.3) | 89.8 (4.7) | 98.3 (0.6) | 100.0 (~0.0) |
| COKE2 | 5.0 | 39.0 | 7.16 | 4.0 (0.1) | 2.3 (1.5) | 72.5 (2.8) | 87.0 (1.8) |
| CHAR | 5.0 | 38.0 | 8.42 | −4.3 (0.8) | *** | 99.3 (0.7) | 100.0 (~0.0) |
| AC1 | 5.0 | 38.0 | 9.01 | 62.1 (1.1) | 70.6 (3.0) | 99.7 (0.3) | 100.0 (~0.0) |
| AC2 | 5.0 | 40.0 | 10.13 | 51.6 (9.2) | *** | 100.0 (~0.0) | 100.0 (~0.0) |
| AC3 | 5.0 | 38.0 | 1.97 | 84.2 (0.5) | *** | 100.0 (~0.0) | 100.0 (~0.0) |
| AC4 | 5.0 | 40.0 | 7.81 | 80.4 (1.9) | *** | 100.0 (~0.0) | 100.0 (~0.0) |
| AC5 | 2.5 | 39.0 | 11.91 | 9.1 (0.3) | 95.2 (1.9) | 99.8 (0.5) | 100.0 (~0.0) |
*** Signifies that substantially more phosphate-P was present in solution at the completion of the batch test than was present at the beginning of the batch test, thus indicating that the treatment material itself originally had significant quantities of readily released phosphate.
Table 2.
Batch test screening results for high iron content media.
| Industrial Product/Byproduct | Dry (Wet) Filter Material Amount (g) | Test Solution Amount (g) | Avg. pH | Nitrate-N Average of Percent Removal and (Std. Dev.) | Phosphate-P Average of Percent Removal and (Std. Dev.) | Atrazine Immunoassay Average of Percent Removal and (Std. Dev.) | Atrazine GC-MS Average of Percent Removal and (Std. Dev.) |
|---|---|---|---|---|---|---|---|
| ZVI1 | 4.9 (5.0) | 40.0 | 9.21 | 9.8 (1.1) | 95.7 (4.3) | 87.6 (2.6) | 91.1 (0.6) |
| ZVI2 | 4.8 (5.0) | 40.0 | 9.58 | 6.0 (0.5) | 99.2 (0.7) | 95.2 (1.7) | 95.8 (0.1) |
| ZVI3 | 4.3 (5.0) | 40.0 | 9.54 | −0.2 (0.3) | 98.0 (3.1) | 5.3 (6.8) | 12.3 (3.8) |
| ZVI4 | 3.9 (5.0) | 40.0 | 10.32 | 4.0 (1.8) | 99.6 (1.9) | −8.0 (5.7) | 12.5 (5.7) |
| SMI1 | 4.3 (5.0) | 40.0 | 9.68 | 63.2 (2.5) | 98.9 (0.4) | 16.4 (3.3) | 30.2 (10.7) |
| SMI2 | 5.0 | 40.0 | 9.12 | 75.3 (3.0) | 96.0 (0.4) | 26.8 (3.9) | 37.0 (5.7) |
| SMI3 | 5.0 | 40.0 | 3.09 | 98.6 (0.3) | 94.0 (0.7) | 61.8 (5.8) | 82.5 (2.1) |
| PIC | 5.0 | 40.0 | 10.70 1 | 36.3 (1.9) | *** 2 | 100.0 (~0.0) | - 3 |
| IS1 | 5.0 | 40.0 | 4.43 | 5.8 (0.5) | 73.4 (22.2) | 63.1 (4.6) | 90.3 (3.4) |
| IS2 | 5.0 | 40.0 | 4.82 | 86.3 (0.1) | 99.0 (0.6) | 25.2 (4.1) | 28.0 (6.0) |
| IS3 | 5.0 | 40.0 | 5.87 | 5.6 (1.9) | 89.4 (0.4) | 19.9 (4.7) | 23.0 (11.1) |
| IO1 | 5.0 | 40.0 | 7.14 | 1.1 (5.6) | 89.7 (8.8) | 11.3 (3.5) | 4.7 (4.8) |
| IO2 | 5.0 | 40.0 | 6.58 | −4.6 (0.8) | 93.2 (1.5) | 15.6 (3.7) | 13.5 (6.5) |
| IO3 | 5.0 | 40.0 | 5.49 | −2.4 (0.2) | 100.0 (~0.0) | 1.7 (12.4) | 29.4 (3.7) |
| IO4 | 5.0 | 40.0 | 6.44 | −3.2 (0.4) | 100.0 (~0.0) | −2.4 (9.2) | 15.0 (5.9) |
| IO5 | 0.7 (5.0) | 40.0 | 6.29 | 4.8 (0.2) | 76.4 (0.6) | 13.4 (12.0) | −5.8 (8.7) |
| IO6 | 1.0 | 40.0 | 6.23 | 3.4 (0.4) | 89.3 (0.8) | 8.5 (3.3) | 13.6 (12.5) |
1 For PIC, average pH is based on three replicate batch tests instead of six replicate batch tests; 2 *** Signifies that substantially more phosphate-P was present in solution at the completion of the batch test than was present at the beginning of the batch test, thus indicating that PIC itself originally had significant quantities of readily released phosphate; 3 - Signifies that atrazine was not measured with GC-MS for the PIC batch tests.
Table 3.
Batch test screening results for high aluminum content media.
| Industrial Product/Byproduct | Dry (Wet) Filter Material Amount (g) | Test Solution Amount (g) | Avg. pH | Nitrate-N Average of Percent Removal and (Std. Dev.) | Phosphate-P Average of Percent Removal and (Std. Dev.) | Atrazine Immunoassay Average of Percent Removal and (Std. Dev.) | Atrazine GC-MS Average of Percent Removal and (Std. Dev.) |
|---|---|---|---|---|---|---|---|
| AO1 | 5.0 | 40.0 | 6.41 | −2.6 (0.3) | 100.0 (~0.0) | 6.7 (8.9) | 22.8 (12.0) |
| AO2 | 5.0 | 40.0 | 6.92 | 4.1 (0.3) | 94.6 (0.5) | 12.7 (3.1) | −47.8 (6.6) |
| AO3 | 5.0 | 40.0 | 6.10 | 1.6 (0.1) | 93.3 (2.1) | 18.9 (3.3) | −9.7 (5.9) |
| AO4 | 5.0 | 40.0 | 8.25 | 1.8 (0.1) | 96.5 (0.1) | 9.7 (4.9) | −32.0 (17.9) |
| AO5 | 5.0 | 40.0 | 8.08 | 1.3 (0.3) | 94.6 (0.4) | 10.4 (5.6) | −22.7 (16.3) |
| AO6 | 1.0 | 40.0 | 6.06 | 1.7 (0.1) | 92.9 (0.5) | 11.5 (7.4) | −24.9 (6.4) |
Table 4.
Batch test screening results for surfactant modified clay/zeolite.
| Industrial Product/Byproduct | Dry (Wet) Filter Material Amount (g) | Test Solution Amount (g) | Avg. pH | Nitrate-N Average of Percent Removal and (Std. Dev.) | Phosphate-P Average of Percent Removal and (Std. Dev.) | Atrazine Immunoassay Average of Percent Removal and (Std. Dev.) | Atrazine GC-MS Average of Percent Removal and (Std. Dev.) |
|---|---|---|---|---|---|---|---|
| SMC1 | 3.03 (5.0) | 38.0 | 7.79 | 66.9 (0.9) | *** | 39.2 (11.4) | 74.7 (3.5) |
| SMC2 | 2.29 (5.0) | 40.0 | 6.25 | 84.5 (0.1) | 95.3 (0.7) | 72.6 (1.4) | 84.8 (1.5) |
| SMC3 | 2.14 (5.0) | 40.0 | 8.91 | 3.3 (0.3) | 97.6 (0.2) | 37.2 (2.3) | 40.5 (14.4) |
| SMZ1 | 4.00 (5.0) | 40.0 | 8.02 | 48.5 (4.8) | *** | 38.4 (8.1) | 68.9 (6.1) |
| SMZ2 | 3.80 (5.0) | 40.0 | 9.33 | 66.0 (0.4) | 92.3 (1.4) | 59.9 (2.6) | 82.8 (1.2) |
| SMZ3 | 4.02 (5.0) | 40.0 | 8.62 | −1.9 (0.1) | 93.2 (0.3) | 27.5 (6.3) | 36.4 (15.8) |
*** Signifies that substantially more phosphate-P was present in solution at the completion of the batch test than was present at the beginning of the batch test, thus indicating that the treatment material itself originally contained significant quantities of readily released phosphate.
Table 5.
Batch test screening results for coal combustion residuals.
| Industrial Product/Byproduct | Dry (Wet) Filter Material Amount (g) | Test Solution Amount (g) | Avg. pH | Nitrate-N Average of Percent Removal and (Std. Dev.) | Phosphate-P Average of Percent Removal and (Std. Dev.) | Atrazine Immunoassay Average of Percent Removal and (Std. Dev.) | Atrazine GC-MS Average of Percent Removal and (Std. Dev.) |
|---|---|---|---|---|---|---|---|
| CCR1 | 5.0 | 40.0 | 11.85 | −3.6 (0.4) | 44.1 (9.1) | 100.0 (~0.0) | 100.0 (~0.0) |
| CCR2 | 5.0 | 40.0 | 6.63 | −5.2 (1.2) | 83.2 (3.6) | 17.8 (6.6) | 29.6 (15.0) |
| CCR3 | 5.0 | 40.0 | 12.07 | 13.8 (3.1) | 96.1 (0.1) | 20.6 (3.9) | 32.3 (6.2) |
| CCR4 | 5.0 | 40.0 | 8.80 | −3.3 (1.5) | 96.0 (0.8) | 14.4 (10.4) | 16.3 (7.6) |
| CCR5 | 4.22 (5.0) | 40.0 | 8.99 | −2.5 (4.4) | 88.4 (2.7) | 100.0 (0.0) | 100.0 (~0.0) |
| CCR6 | 5.0 | 40.0 | 6.32 | −2.5 (0.5) | 69.3 (1.9) | 97.2 (0.9) | 99.3 (8.3) |
| CCR7 | 5.0 | 40.0 | 7.99 | −1.4 (0.6) | 98.5 (0.4) | 100.0 (~0.0) | 100.0 (~0.0) |
| CCR8 | 5.0 | 40.0 | 13.05 | 74.5 (1.6) | 94.6 (2.3) | 100.0 (~0.0) | 100.0 (~0.0) |
Table 6.
Batch test screening results for spent foundry sands.
| Industrial Product/Byproduct | Dry (Wet) Filter Material Amount (g) | Test Solution Amount (g) | pH 1 | Nitrate-N Average of Percent Removal and (Std. Dev.) | Phosphate-P Average of Percent Removal and (Std. Dev.) | Atrazine Immunoassay Average of Percent Removal and (Std. Dev.) | Atrazine GC-MS Average of Percent Removal and (Std. Dev.) |
|---|---|---|---|---|---|---|---|
| FS1 | 5.0 | 40.0 | 8.26 | 1.6 (1.0) | 95.1 (2.4) | 18.5 (8.7) | - 2 |
| FS2 | 5.0 | 40.0 | 8.17 | 1.7 (1.9) | 98.8 (0.3) | 45.2 (4.2) | - |
| FS3 | 5.0 | 40.0 | 7.82 | −1.0 (0.2) | 94.3 (2.5) | 76.5 (0.9) | - |
| FS4 | 5.0 | 40.0 | 7.88 | 2.9 (0.7) | 94.4 (0.5) | 59.1 (6.8) | - |
| FS5 | 5.0 | 40.0 | 7.79 | 2.9 (0.6) | 97.3 (0.8) | 49.0 (9.2) | - |
| FS6 | 5.0 | 40.0 | 7.80 | 0.6 (0.6) | 96.2 (2.8) | 50.5 (3.7) | - |
| FS7 | 5.0 | 40.0 | 7.69 | 2.2 (0.7) | 94.9 (1.9) | 35.7 (5.3) | - |
1 The pH was measured on only one batch test replicate; 2 - Signifies that atrazine was not measured with GC-MS.
© 2017 by the author. Licensee MDPI, Basel, Switzerland. This article is an open access article distributed under the terms and conditions of the Creative Commons Attribution (CC BY) license (http://creativecommons.org/licenses/by/4.0/).
Share and Cite
MDPI and ACS Style
Allred, B.J. Batch Test Screening of Industrial Product/Byproduct Filter Materials for Agricultural Drainage Water Treatment. Water 2017, 9, 791. https://doi.org/10.3390/w9100791
AMA Style
Allred BJ. Batch Test Screening of Industrial Product/Byproduct Filter Materials for Agricultural Drainage Water Treatment. Water. 2017; 9(10):791. https://doi.org/10.3390/w9100791
Chicago/Turabian StyleAllred, Barry J. 2017. "Batch Test Screening of Industrial Product/Byproduct Filter Materials for Agricultural Drainage Water Treatment" Water 9, no. 10: 791. https://doi.org/10.3390/w9100791
Note that from the first issue of 2016, this journal uses article numbers instead of page numbers. See further details here.