Darllenwch y dudalen hon yn Cymraeg
The latest edition of the Welsh Index of Multiple Deprivation (WIMD) was published on 27 November 2019. The index ranks small areas in Wales on several types of deprivation, like income and health, and combines these into an overall measure of multiple deprivation.
We have had a lot of enquiries asking when the next index is coming. This blog provides an update to users of WIMD on when to expect a new index, and what data is available in the interim period.
When will we update WIMD?
We aim to publish the next WIMD in late 2025 or early 2026, and will firm up this timing when possible.
Changes in relative deprivation ranks tend to be small over shorter periods, and even smaller for deciles and quintiles of deprivation which are the more commonly used measures. In the past, WIMD has been updated every 3 to 5 years, but some of the reasons why we are proposing a slightly longer gap this time include:
- there has been disruption to the planned work of the analytical team behind WIMD due to the coronavirus (COVID-19) pandemic, because of diversion of resource to support work relating to the pandemic, and because of the impact on availability of many datasets that underpin WIMD
- we would like to produce the best possible snapshot of multiple deprivation by reviewing all the indicator data we use (there were 47 indicators in WIMD 2019) with topic experts, which takes time
- we know we need to make some changes or improvements to things like the measure of income and employment deprivation (because of the rollout of Universal Credit) or the way that we publish data and tools to explore WIMD
- we want the index to be based on the most up to date small area geography, used in the Census 2021, which means making some changes to our processes
What data to use until then
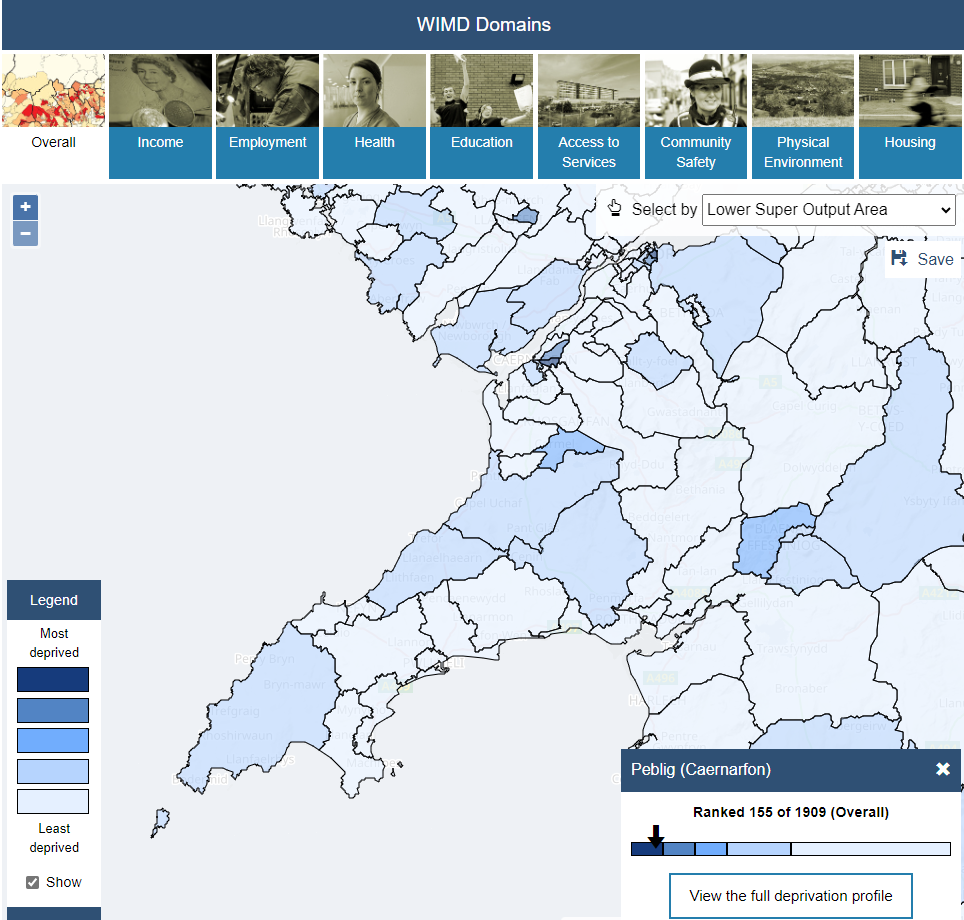
In the meantime, there is still much to explore in the data behind WIMD 2019, which remains the official measure of relative deprivation for small areas in Wales. All the WIMD rank and indicator data are published on StatsWales, as well as in a spreadsheet alongside summary reports on our WIMD 2019 website. Our popular interactive website outputs maps and area deprivation profiles for postcodes and places.
In our guidance material we advise users that the index is most useful when used alongside other information including from the underlying indicators, other published data or local information. This becomes increasingly relevant as we move further from the latest snapshot, when more recent sources such as the ONS’s Census 2021 may provide valuable new insights, for example through the data on households by deprivation dimensions (ONS).
Since the first batch of WIMD 2019 results in November 2019, we have published many follow-on outputs to help users of the index draw out key messages and make full use of the datasets. There’s a list of outputs on our website, but here’s a taster of what’s available:
- statistics on groups with protected characteristics that examine how sub-groups of the population differ in terms of deprivation levels of the areas they live in
- a lookup spreadsheet where you can paste in a list of postcodes to output WIMD ranks and deprivation groups
- analysis of WIMD indicator data to explore patterns of deprivation amongst young children aged 7 and under
- a report on how deprivation can be measured in primary care and how general practice workforce differs by relative deprivation level
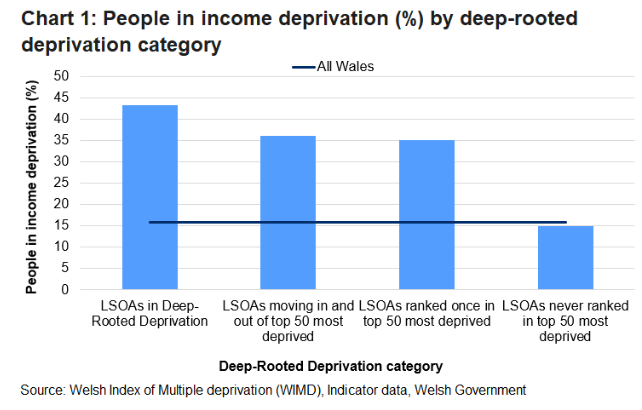
- analysis of areas in deep-rooted deprivation (areas consistently among the most deprived 50 in Wales) using WIMD indicator data
Boundary changes following the 2021 Census
As part of the Census 2021 update, the Office for National Statistics have made some changes to the Output Area geographies, with a knock on effect for the Lower layer Super Output Areas (LSOAs) that form the building blocks for WIMD.
We have looked at these changes, and there are now a total of 1,917 LSOAs in Wales compared with 1,909 LSOAs after Census 2011. 1,837 of the Welsh LSOAs remained unchanged, 45 have been merged into 22 new LSOAs, and 27 have been split into 58 new LSOAs.
We have been asked about plans to rework the latest index – WIMD 2019 – to be based on the new 2021 LSOAs instead of the 2011 LSOAs. We do not plan to do this, and we don’t have all the underlying data needed to do it accurately. We will instead focus on producing the next index in 2025/26 on the new basis.
If there is an immediate need for data on relative deprivation for some of the (relatively few) areas affected by boundary changes, analysts should consider how best to use the WIMD 2019 data to provide estimates suitable for their purpose. For the split areas, one approach might be to allocate the same rank or decile as the original larger area had to the new, smaller areas. For merged areas, it may make sense to look at ranks or deciles allocated to the original, smaller areas, and allocate the most highly deprived of those to the new, merged area. WIMD 2019 guidance explains why it is usually not valid to calculate ranks for larger geographies by taking an average.
Join our distribution list
There will be further updates as we start work towards the new index. If you want to receive notification of new information about WIMD, please email stats.inclusion@gov.wales to subscribe.
Post by, Nia Jones, Social Justice Statistics, Welsh Government
Email: stats.inclusion@gov.wales
