Defining Biologically Meaningful Biomes Through Floristic, Functional, and Phylogenetic Data
 Domingos Cardoso1*†‡
  Peter W. Moonlight2†‡
  Gustavo Ramos2,3†
  Graeme Oatley4† Christopher Dudley2
  Edeline Gagnon2†
  Luciano Paganucci de Queiroz5†
  R. Toby Pennington2,4†
  Tiina E. Särkinen2†
- 1National Institute of Science and Technology in Interdisciplinary and Transdisciplinary Studies in Ecology and Evolution (INCT IN-TREE), Instituto de Biologia, Universidade Federal da Bahia, Salvador, Brazil
- 2Tropical Diversity Section, Royal Botanic Garden Edinburgh, Edinburgh, United Kingdom
- 3Department of Biological Sciences, The University of Edinburgh, Edinburgh, United Kingdom
- 4Department of Geography, University of Exeter, Exeter, United Kingdom
- 5Departamento de Ciências Biológicas, Universidade Estadual de Feira de Santana, Feira de Santana, Brazil
While we have largely improved our understanding on what biomes are and their utility in global change ecology, conservation planning, and evolutionary biology is clear, there is no consensus on how biomes should be delimited or mapped. Existing methods emphasize different aspects of biomes, with different strengths and limitations. We introduce a novel approach to biome delimitation and mapping, based upon combining individual regionalizations derived from floristic, functional, and phylogenetic data linked to environmentally trained species distribution models. We define “core Biomes” as areas where independent regionalizations agree and “transition zones” as those whose biome identity is not corroborated by all analyses. We apply this approach to delimiting the neglected Caatinga seasonally dry tropical forest biome in northeast Brazil. We delimit the “core Caatinga” as a smaller and more climatically limited area than previous definitions, and argue it represents a floristically, functionally, and phylogenetically coherent unit within the driest parts of northeast Brazil. “Caatinga transition zones” represent a large and biologically important area, highlighting that ecological and evolutionary processes work across environmental gradients and that biomes are not categorical variables. We discuss the differences among individual regionalizations in an ecological and evolutionary context and the potential limitations and utility of individual and combined biome delimitations. Our integrated ecological and evolutionary definition of the Caatinga and associated transition zones are argued to best describe and map biologically meaningful biomes.
Introduction
Biomes are a key concept in ecology and biogeography (Higgins et al., 2016; Mucina, 2019) and have been largely used in global change ecology (Prentice et al., 2007; Williams et al., 2007; Lehmann et al., 2014; Moncrieff et al., 2016), conservation planning (Hoekstra et al., 2005), and evolutionary biology (Donoghue and Edwards, 2014; Landis et al., 2021a). Although biome definitions have differed (Mucina, 2019), the scientific community has generally settled on an agreed biome definition: “a biotic community finding its expression at large geographic scales, shaped by climatic factors, and perhaps better characterized by physiognomy and functional aspects, rather than by species or life-form composition” (Mucina, 2019). Despite this accord over the definition of a biome, there remains no universally recognized method of delimiting and mapping biomes. Different approaches focus upon different elements of biomes – their physiognomic, floristic, environmental, or functional characteristics – which in turn produce different biome maps. Although such single-criterion-based biome schemes are helpful for understanding plant communities from an operational point of view, and at the local to the global scale (Conradi et al., 2020), they cannot define the nature of biomes through time and fail to capture the distribution, structure, and functioning of biomes in an evolutionary continuum.
Most recently, a global-scale conceptual view of biomes has been proposed which considers biomes as the confluence of ecology, evolution, and biogeography (Pennington et al., 2009, 2018; Oliveira-Filho et al., 2013a,b; Moncrieff et al., 2016; Pennington and Lavin, 2016; Mucina, 2019, 2020; Nürk et al., 2020; Ringelberg et al., 2020). While there is a consensus in ecology and biogeography that biomes should be defined based on physiognomy and functional aspects (Mucina, 2019; Pennington et al., 2018), an evolutionary dimension emphasizes the processes that have led to current biome distributions. This concept defines biomes as “evolutionary theaters” within which lineages interact and evolve through time, and as meta-communities regulated by community assembly at large spatial scale (Pennington et al., 2009; Oliveira-Filho et al., 2013b; Pennington and Lavin, 2016). The concept has emerged partly in response to increasing evidence for the prevalence of phylogenetic niche conservatism (Crisp et al., 2009; Pennington et al., 2009; Oliveira-Filho et al., 2013a,b; Kerkhoff et al., 2014; Gagnon et al., 2019; Ringelberg et al., 2020; Segovia et al., 2020). This tendency of plant lineages to inherit their overall ancestral environmental niches is based upon evidence that many plant lineages have dispersed across large distances over evolutionary timescales yet occupy similar ecological conditions. The general lack of dispersal limitation and difficulty of accruing novel environmental adaptations had led to the popularity of the phrase that for plants, it is “easier to move than evolve” (Donoghue, 2008).
That plant phylogenies are often more structured ecologically than geographically suggests that ecological gradients are evolutionarily important (Crisp et al., 2009; Oliveira-Filho et al., 2013a). The concept of phylogenetic niche conservatism is strongly linked to environmental filtering, i.e., the process whereby environmental gradients act as strong filters for species distributions (Cavender-Bares et al., 2009; Hardy et al., 2012; Blonder et al., 2015). For example, a previous study across plant lineages has shown that environmental filtering has played an important role in shaping the flora of the Galapagos Islands (Carvajal-Endara et al., 2017). In the presence of environmental filtering, lineages cannot successfully establish unless they have traits that leave them pre-adapted to pass environmental filters, leading to distinct biome assemblies (see also Donoghue and Edwards, 2014).
Biome conservatism and environmental filtering are of course not universal. For example, depending on the “evolutionary accessibility” of a new ecological setting or a lineage’s biome affinity and location relative to the spatial distribution of other biomes at any given time, there is a varying spectrum of possible biogeographical scenarios, including those at which lineages can transcend ecological barriers more easily than geographical barriers (Edwards and Donoghue, 2013; Landis et al., 2021a). Evidence from global tropical grasslands shows that many lineages were able to colonize the biome over the past 10 million years from other biomes (Simon et al., 2009; Maurin et al., 2014), indicating that perhaps some biomes are more open to outsiders (i.e., non-native or pre-adapted lineages; Edwards and Donoghue, 2013; Donoghue and Edwards, 2014). Such evolutionary biome switching reflects that some environmental gradients (i.e., biome borders) are more easily crossed than others, perhaps due to the ease at which adaptations to these gradients can be acquired (Pennington et al., 2006; Simon and Pennington, 2012). The intermediate disturbance hypothesis (Connell, 1978) posits that if a disturbance is not too extreme, many plant lineages may already have or can evolve traits required to survive it, but the more extreme the disturbance (e.g., extreme drought and extreme cold or extreme heat), an increasingly small number of species will have these traits because they are hard to evolve. Quantitative evidence across floras is now needed to understand the relative roles of niche conservatism and the species-environment interactions (environmental filtering) across ecological gradients, particularly in the Neotropics where much biome complexity is found (Pennington et al., 2009; Hughes et al., 2013; Dexter et al., 2018; Silva-de-Miranda et al., 2018).
If phylogenetic niche conservatism and environmental filtering have shaped the macroevolutionary patterns of floristic and functional diversity that make up the evolutionary theaters or biomes, then exploring variation in taxonomic, functional trait, and community phylogenetic data may help delimiting more biologically meaningful biomes that are globally comparable. While biomes defined exclusively by individual, distinct operational criteria will result in different biome maps fit for different purposes such as comparative ecology and global change research (Conradi et al., 2020), comparisons of biomes delimited under different or combinations of criteria remain rare, particularly across geologically and ecologically complex biogeographic regions like the Caatinga domain of northeast Brazil (NE Brazil, Figure 1) (Queiroz et al., 2017; Fernandes et al., 2020).
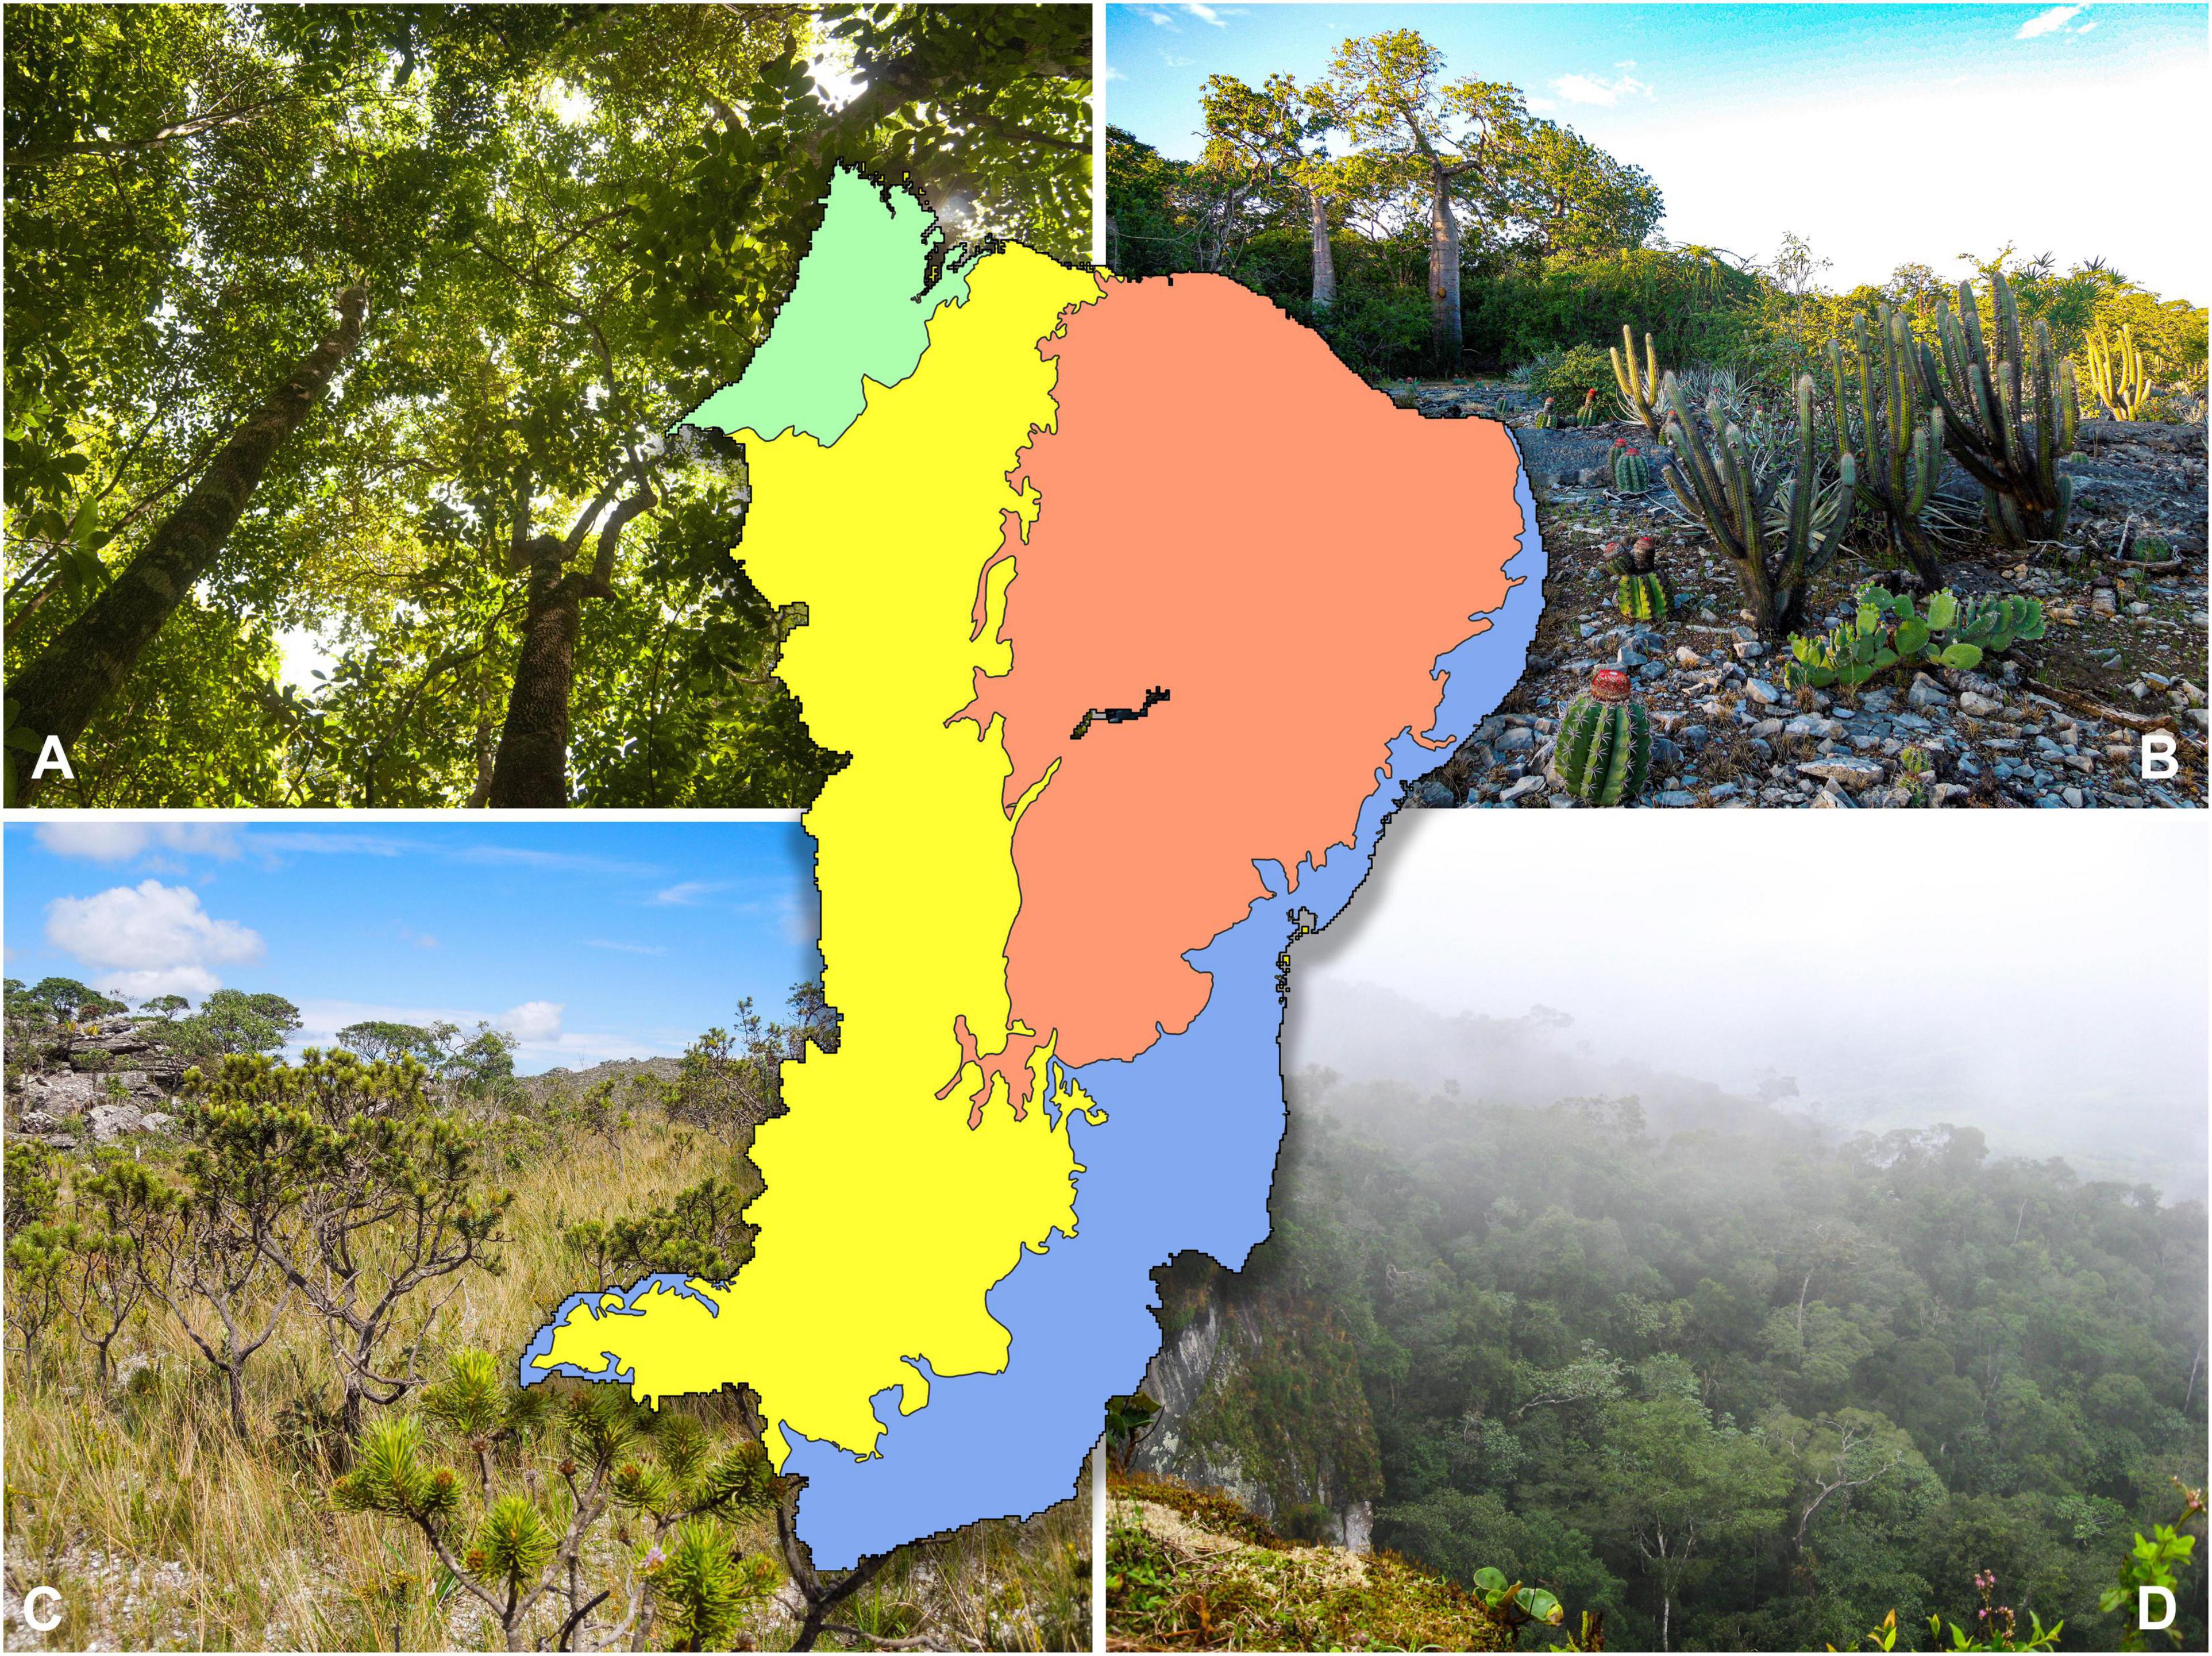
Figure 1. The main biogeographical regions of northeast Brazil (including the state of Minas Gerais) where three biomes predominate: the geographically disjunct Amazonian and Atlantic rainforests [(A), green; (D), blue], the succulent-rich Caatinga seasonally dry tropical forests [(B), red], and the grass-rich, fire-prone savannas of the Cerrado [(C), yellow]. For geographic reference, the whole north and northeastern borders of the inset are the Atlantic Ocean. Photos by PWM (A) and DC (B–D).
The Caatinga region is often treated in biodiversity, evolutionary, conservation, and biogeographical studies of plants and animals as a single, homogeneous unit, generally termed a “biome” (Instituto Brasileiro de Geografia e Estatística [IBGE], 2012; The Brazil Flora Group [BFG], 2015; Garda et al., 2017; Mesquita et al., 2017; Araujo and Silva, 2017; Antonelli et al., 2018; Manhães et al., 2018; Nascimento et al., 2018; Silva and Souza, 2018; Medeiros et al., 2019; Prieto-Torres et al., 2019; Souza-e-Silva et al., 2019; Correia et al., 2020; Dória and Dobrovolski, 2021). However, this definition of the Caatinga as a “biome” is in conflict with the more generally accepted definition of a biome at a global scale; it is in fact a biogeographic region. Whilst the Caatinga region may have a broadly similar, seasonally dry climate, it includes interdigitating, distinct biomes (as defined and recognized at global scale) such as rainforest and fire-prone savannas within a predominant matrix of Caatinga seasonally dry tropical forests (SDTF biome). The use of maps with a geographic delimitation of the Caatinga as a “biome” may impact upon downstream analyses aimed at disentangling the ecological and historical drivers that have shaped the evolutionary trajectories of all Caatinga species diversity (Queiroz, 2006; Cardoso and Queiroz, 2010; Queiroz et al., 2017; Guedes et al., 2014). It may also impact assessing priority areas for conservation in the severely impacted SDTF biome across Brazil, which it is not just confined to the Caatinga, but is found across the Cerrado and Pantanal regions (DRYFLOR, 2016; the Cerrado and Pantanal are also termed “biomes” by IBGE).
Here we explore how taxonomic, functional, and community phylogenetic data can be used to delimit biomes in NE Brazil and explore how biomes defined in these different ways are shaped by climatic variables. We aim to demonstrate that a Caatinga SDTF biome, lying at the extremely dry end of the tropical seasonality and rainfall gradient of NE Brazil, greatly differs from nearby and interdigitating ecologically and evolutionarily distinct rainforest and savanna biomes and occupies a unique environmental space. We use the three distinct data sources to measure the degree to which the Caatinga SDTF biome differs floristically, phylogenetically, and in functional trait composition, as first step to understand the ease at which these differences can and have been traversed adaptively by plant lineages through time (Wiens et al., 2010; Crisp and Cook, 2012; Donoghue and Edwards, 2014).
We use standard clustering algorithms, which in a geographic context have been termed regionalization approaches (Kreft and Jetz, 2010; Linder et al., 2012; Vilhena and Antonelli, 2015; Daru et al., 2017), to delimit clusters. Several authors have used biogeographic regionalization methods on a relatively similar (Linder et al., 2012; Fayolle et al., 2018; Aleman et al., 2020) or even larger scales (e.g., Kreft and Jetz, 2010; Holt et al., 2013; Vilhena and Antonelli, 2015; Ficetola et al., 2017) and argued that the results are comparable to biomes (Vilhena and Antonelli, 2015; Aleman et al., 2020). However, while extremely useful, previous regionalizations have been based on only a single type of data (e.g., floristic data; Linder et al., 2012) so cannot encompass all aspects of biomes. Our approach differs because we use three independent regionalizations, each based upon a different type of data (floristic, functional, and phylogenetic). By both combining and comparing the results of these regionalizations, we argue that our results approach for the first time a data-driven and repeatable biome map that considers all facets of agreed biome definitions.
Materials and Methods
Our approach differs from classical and modern approaches that fall under the umbrella of “biogeographical regionalization” or “bioregionalization” (e.g., Kreft and Jetz, 2010; Linder et al., 2012; Holt et al., 2013; Vilhena and Antonelli, 2015; Daru et al., 2016, 2017; Edler et al., 2017; Ficetola et al., 2017). Most such analyses are essentially focused on understanding the signature of historical (i.e., geographic barriers) processes in explaining the spatial distribution of specific “groups” of organisms across geographically confined areas, rather than delimiting biomes that are applicable across the tree of life. Those that do include broader ranges of taxa still rely only on floristic (e.g., Linder et al., 2012) or phylogenetic (e.g., Daru et al., 2017) data to classify the “bioregions,” rather than attempting to integrate floristic, functional, and phylogenetic data. The resulting areas are more akin to “biogeographic regions” (sensu Wallace, 1876; Holt et al., 2013) than “biomes.” In our study, biomes were delimited by comparing and combining independent regionalization analyses based upon floristic, functional, and phylogenetic data. We therefore consider the impact of geography and the evolutionary and functional distinctiveness of areas, as well as how the environment [here incorporated indirectly by the use of Species Distribution Models (SDMs)] defines where lineages are confined. We consider the results of our analyses biologically meaningful biomes.
Floristic data were based on thresholded, statistically significant SDMs for 3,457 flowering plant species, which were also included in a molecular phylogeny. SDMs were used to estimate species lists for all grid cells across the study area. Functional and phylogenetic data for each grid cell were based on seven functional traits and a community phylogeny generated for all the species present for the study area, respectively. Regionalization analyses were carried out using hierarchical clustering based upon floristic, functional, and phylogenetic distance among all cells. All three distance matrices (floristic, functional, and phylogenetic) were summed and used to delimit “total evidence” biomes.
Study Area
We applied our biome delimitation approaches to NE Brazil because of our long-term experience working on the taxonomy, distribution, ecology, and evolution of flowering plants in the region (e.g., Rocha et al., 2004; Queiroz, 2006; Queiroz et al., 2010, 2017; Särkinen et al., 2011; Santos et al., 2012; Cardoso et al., 2014; Fernandes et al., 2020; Moonlight et al., 2020). We defined our study area as NE Brazil (including the state of Minas Gerais) in order to include all areas defined as the Caatinga by Instituto Brasileiro de Geografia e Estatística [IBGE] (2012) and alternative biome classifications (e.g., Queiroz et al., 2017; Silva-de-Miranda et al., 2018; Moonlight et al., 2020). We have a particular interest in identifying “core” areas that are relatively homogenous in floristic, functional, and phylogenetic space, so it was important to include areas of all biomes that surround the Caatinga (i.e., areas known to differ in these respects). According to the Instituto Brasileiro de Geografia e Estatística [IBGE] (2012) classification, this includes the Cerrado (Brazilian savanna), Mata Atlantica (Brazilian Atlantic rainforest), and Amazonia (Amazon rainforest). Our study area has an area of 2.144 million km2 and includes a buffer of at least 200 km around the IBGE definition of the Caatinga in all directions (Figure 1).
Species Distribution Data
The ongoing Flora do Brasil 2020 project (2021)1 provides a robust taxonomic framework to work in the region with currently 16,351 species of flowering plants recorded for NE Brazil (Flora do Brasil 2020, 2021). A relatively large amount of species occurrence data is available for the region (Supplementary Figure 1) thanks to two dynamic network of local herbaria across Brazil available through CRIA speciesLink2 and the Reflora specimen database3.
In this study, we attempted to produce an SDM for every angiosperm species with recorded distributions in NE Brazil (Reflora, 2021) using data from CRIA speciesLink and the Reflora specimen database. While many NE Brazilian species have distributions outside Brazil, we only included Brazilian specimen records due to difficulties matching taxonomic backbones across countries. We used the latest version of Reflora (2021) to harmonize the taxonomy of the two specimen databases and update synonymy. Data were cleaned in six stages as described in Appendix S2 of Moonlight et al. (2020), which were designed to remove misidentified specimens and those with coordinate errors. We addressed environmental bias in occurrence data using spatial filtering by retaining a single specimen record within each 10 km radius for every species following Kramer-Schadt et al. (2013). We retained and attempted to model all species with ≥5 records collected in different grid cells at a 0.05° resolution, resulting in 296,439 unique occurrence records for 9,134 species.
Species Distribution Modeling
Climatic predictors were derived from remotely sensed temperature (MODIS; Wan and Dozier, 1996; Wan, 2014), rainfall (CHIRPS; Funk et al., 2014), and cloud cover data (MODCF; Wilson and Jetz, 2016). These data are calibrated with data from ground weather stations and outperform those derived from ground data alone (e.g., WorldClim) for SDMs (Deblauwe et al., 2016). All data were downloaded at a 0.05° resolution (c. 5.5 km2 at the equator). Edaphic data were derived from the SoilGrids 250 m database (accessed February 2017)4 interpolated to a 0.05° resolution. Edaphic factors are believed to be important in determining species distributions in NE Brazil (Queiroz et al., 2017) and have been shown to increase SDM performance in the tropical Americas (Figueiredo et al., 2017; Moulatlet et al., 2017; Rapini et al., 2021). Climatic and edaphic predictors (35 and 55, respectively) were converted into two independent principal component analysis (PCA) axes. Four and five axes were selected, which each explained >80% of variation (see Appendix S4 of Moonlight et al., 2020). This process reduces the number of explanatory variables, thus minimizing collinearity (Dormann et al., 2013) and model overfitting (Peterson et al., 2007) while maximizing the explanatory data available for modeling.
SDMs for 9,134 were run using MaxEnt v.3.3.3 in the R package “dismo” (Hijmans et al., 2017). MaxEnt was chosen because it has been shown to outperform other SDM methodologies, particularly when species have few distribution points. MaxEnt was used with the default settings, with 5-fold cross-validation, and all feature classes allowed. Background data (also known as pseudo-absence data) were sampled from a unique area for each species, consisting of NE Brazil plus circles of 250 km around each species’ known occurrence points. This was a compromise between predicting species into areas not covered by background points, providing a large number of climatically unsuitable points (Anderson and Raza, 2010), and including a biologically realistic extent for each species’ model. We controlled for bias in sampling effort (Stolar and Nielsen, 2015) by selecting 10,000 background points for each species using an Epanechnikov kernel (Wiegand and Moloney, 2013) calculated from all angiosperm presence data for Brazil.
We evaluated model performance using the Continuous Boyce Index (CBI; Hirzel et al., 2006). This evaluation index that relies upon presence and pseudo-absence data is based upon the Boyce Index (Boyce et al., 2002), calculated with code available at https://rdrr.io/github/adamlilith/enmSdm/man/contBoyce.html. CBI has been shown to be less stochastic to variation at low numbers of presence points than alternative indices (Hirzel et al., 2006). A CBI of ≥0 indicates that a model is better than chance and from the SDMs of 9,134 species we retained all models with a mean CBI of ≥0.25 over the five replicates (6,823 species, 75%, see Supplementary Table 3). Retained replicates were summed and converted into binary presence-absence maps using the 10th percentile logistic threshold. This was chosen because it was the strictest of the commonly used threshold values, so it limits the well-documented over-estimated of summed SDMs. To maximize the compatibility of analyses, we retained models only for species included in the community phylogeny (see section “Phylogenetic Delimitation” below) for downstream analyses (3,457 species). Predicted species lists were estimated for every 0.05° grid cell in NE Brazil, which were aggregated to a 0.25° resolution due to computation constraints. Presence in a species list was assigned based upon predicted presence in any constituent cell at the original 0.05° resolution.
Cluster Delimitation
Floristic Delimitation
To delimit clusters based upon floristic data (floristic regionalization), a distance matrix was computed based on β-diversity (Simpson’s dissimilarity: β-sim) in the R package “betapart” (Baselga et al., 2018). This approach was chosen because it measures floristic turnover (i.e., dissimilarity) between grid cells and not nestedness (Baselga, 2010). The floristic distance matrix was used in unbiased cluster analysis, where the row order of the distance matrix was randomized 100 times using the “recluster” package in R (Dapporto et al., 2013, 2015). RogueNaRok (Aberer et al., 2012; Available at: https://rnr.h-its.org/) was used to identify rogue grid cells responsible for reducing resolution in the resulting 50% majority rule consensus dendrogram. A total of 138 rogue grid cells were identified and removed. Clusters were mapped based upon a process of reciprocal illumination following Moonlight et al. (2020) and analogous to the approaches taken by similar analyses (Silva-de-Miranda et al., 2018; Moonlight et al., 2020). Clusters were labeled based on comparing the mapped distribution of sub-clusters to our biological knowledge of the vegetation patterns in NE Brazil. Our priorities were to delimit clusters that could be matched with confidence to four biomes recognized by the Instituto Brasileiro de Geografia e Estatística [IBGE] (2012) classification, and to maximize similarity with the mapped clusters from the phylogenetic and functional biome classifications (see below). We acknowledge that this approach is not fully repeatable, but argue that it is the best currently available considering that alternative approaches (e.g., k-means clustering, Amaral et al., 2017) also rely upon prior knowledge to define an expected number of biomes. We term this approach “floristic regionalization.”
Phylogenetic Delimitation
To delimit clusters based upon phylogenetic distances between plant communities (phylogenetic regionalization), we produced a novel community phylogeny for the flora of NE Brazil based on DNA sequences mostly downloaded from GenBank (Benson et al., 2017). We attempted to download sequence data for all 16,351 species recorded in NE Brazil by Flora do Brasil 2020 (2021) for the following regions: matK, atpB, ndhF, rbcL, and trnL. Regions were chosen based upon: (i) wide use across angiosperms; (ii) ease of alignment across angiosperms; (iii) adequate level of sequence variation across orders, families, and genera.
To augment our species sampling in the community phylogeny, we have newly generated 445 matK and 444 rbcL sequences from herbarium and field-collected leaf tissues preserved through silica gel desiccation of 546 species. DNA extraction, PCR amplification, and robotic sequencing largely followed standard protocols of DNA barcoding for community phylogenetics (e.g., Kress et al., 2009). The newly generated DNA sequences are publicly available in GenBank (see Supplementary Table 1 for voucher and accession number details)5.
The R package “rentrex” (Winters, 2017) was used to query GenBank, specifying a sequence length of 500–5,000 base pairs. For species in NE Brazil for which no sequence data were available in GenBank, we repeated the steps above to locate sequences for congeners from outside of Brazil (for genera with one or two species within NE Brazil) because any one or two species for these genera would provide the same phylogenetic distance in our analyses as those present in NE Brazil. Alignments were done in Mafft v.7.450 for each DNA region with default settings with a maximum of six iterations performed per region. Data cleaning was done by identifying poorly aligned sequences based on visual assessment, using Vsearch v2.14.2 to identify highly variable sequences with <40% sequence similarity, and by identifying misplaced species based on neighbor-joining trees run for each DNA region with FastTree v2.1.10 (Price et al., 2010). Replacements for any species removed during the cleaning were searched in GenBank if alternative sequences were available. The final cleaned community phylogeny contained 10,279 sequences from GenBank and 662 newly generated sequences for a total of 6,296 species (Supplementary Table 2). All DNA regions were combined and analyzed using RaxML-HPC2 on XSEDE on the CIPRES Science Gateway v.3.3 on-line portal (Miller et al., 2010)6. The phylogeny was rooted with Nymphaeales. The community phylogeny included 6,296 species from 209 families and 1,775 genera (Supplementary Figure 2). The relationships among them were consistent with the phylogeny of flowering plants (The Angiosperm Phylogeny Group et al., 2016). A total of 3,457 species from 184 families and 1,325 genera in the phylogeny were also included in the SDMs so were retained for downstream analyses.
Phylogenetic distances between all grid cells in NE Brazil were calculated by estimating the phylogenetic β-diversity among estimated species lists. The phylogenetic Simpson’s index was used following Chave et al. (2007) because it is comparable with β-sim (see above). Phylogenetic regionalization was carried out following the hierarchical clustering method described above under section “Floristic Delimitation.” No rogue grid cells were identified and removed.
Functional Delimitation
To delimit clusters based upon functional distances between plant communities (functional regionalization), we scored seven independent plant traits for all 3,457 species for which SDMs were generated and which were included in the community phylogeny (100% coverage for 3,457 species for all seven traits). These included 931 species scored by Moonlight et al. (2020). Traits were chosen on the basis of: (i) that they were simple and unambiguous to score from herbarium specimens or literature; and (ii) had hypothesized links with environmental and functional differences among biomes in NE Brazil. The seven traits chosen were: (i) latex; (ii) corky bark; (iii) spines; (iv) compound leaves; (v) nitrogen nodulation; (vi) Crassulacean acid metabolism (CAM) photosynthesis; and (vii) C4 photosynthesis (Supplementary Table 2). The literature used to score traits is detailed in Appendix S7 of Moonlight et al. (2020).
Functional distance matrices between all grid cells in NE Brazil were created based upon estimated species lists. Euclidean distances of grid cells in 6-dimensional trait space based on the proportion of species with each trait in each grid cell was used for measuring functional distance. Published functional diversity metrics (e.g., Ricotta et al., 2016) were found inappropriate for measuring functional distance between plant communities because they are based on the presence rather than the proportion of a trait, which leads to overestimation of functional similarity at broad spatial scales where almost all grid cells had at least one predicted species with every trait. Functional regionalization was carried out following the hierarchical clustering method described above under section “Floristic Delimitation.” No rogue grid cells were identified and removed.
Combined Cluster Delimitation
Combined analyses of floristic, phylogenetic, and functional distance matrices were run to delimit “total evidence” clusters based on all three approaches. All possible combinations of the three approaches were also run to see subsets of results (i.e., floristic + phylogenetic, floristic + functional, and phylogenetic + functional). Distance matrices were scaled from 0 to 1 to give equal weight to each matrix before being summed, so the distance matrix values could range from 0 to 2 in analyses with two approaches, or 0 to 3 in analyses with three approaches. Clusters were estimated, mapped, and named following the hierarchical clustering method described under section “Floristic Delimitation.” The results of the “total evidence” clusters are named herein as biomes because they are the result of three, independent lines of evidence. No rogue grid cells were removed.
Comparison of Regionalizations: Clusters as Biomes
Comparisons of regionalizations based on individual approaches (functional, phylogenetic, and floristic) were carried out in both geographic and environmental space to highlight areas of “core” biomes (areas where all regionalizations analyses agreed on biome identity) and transition zones (areas where regionalizations differed between analyses). “Core” biome areas were visualized by highlighting areas of agreement between the three individual regionalizations (e.g., “core Caatinga”). Transitional biome areas were visualized by highlighting areas of disagreement where one or two approaches showed disagreement regarding biome distribution (e.g., “transitional Caatinga”). A raster file depicting the core Caatinga and associated transition zones is available as Supplementary Figure 5.
To investigate whether core biomes overlapped in environmental space, environmental comparison of biome delimitations was achieved by plotting clusters from different analyses in environmental space based on mean annual temperature (bio1) and rainfall data (bio12) extracted for each grid cell. The bio1 and bio12 values for each biome grid cell from each analysis were summed. The mean annual temperature (bio1) from MODIS temperature data (Wan and Dozier, 1996; Wan, 2014) and mean annual rainfall (bio12) from CHIRPS rainfall data (Funk et al., 2014) were used.
Results
Major Biomes Across NE Brazil
All three individual regionalizations identified two clusters of Caatinga SDTF, two clusters as Mata Atlantica, and three clusters as Cerrado (Figures 2A–C). The functional analysis resulted in the identification of an additional cluster within both the Mata Atlantica and Cerrado, and an extra cluster that we were unable to assign to any recognized biome (Figure 2A). The combined “total evidence” analyses of all three approaches suggested seven major clusters based on functional, phylogenetic, and floristic data (Figure 2G).
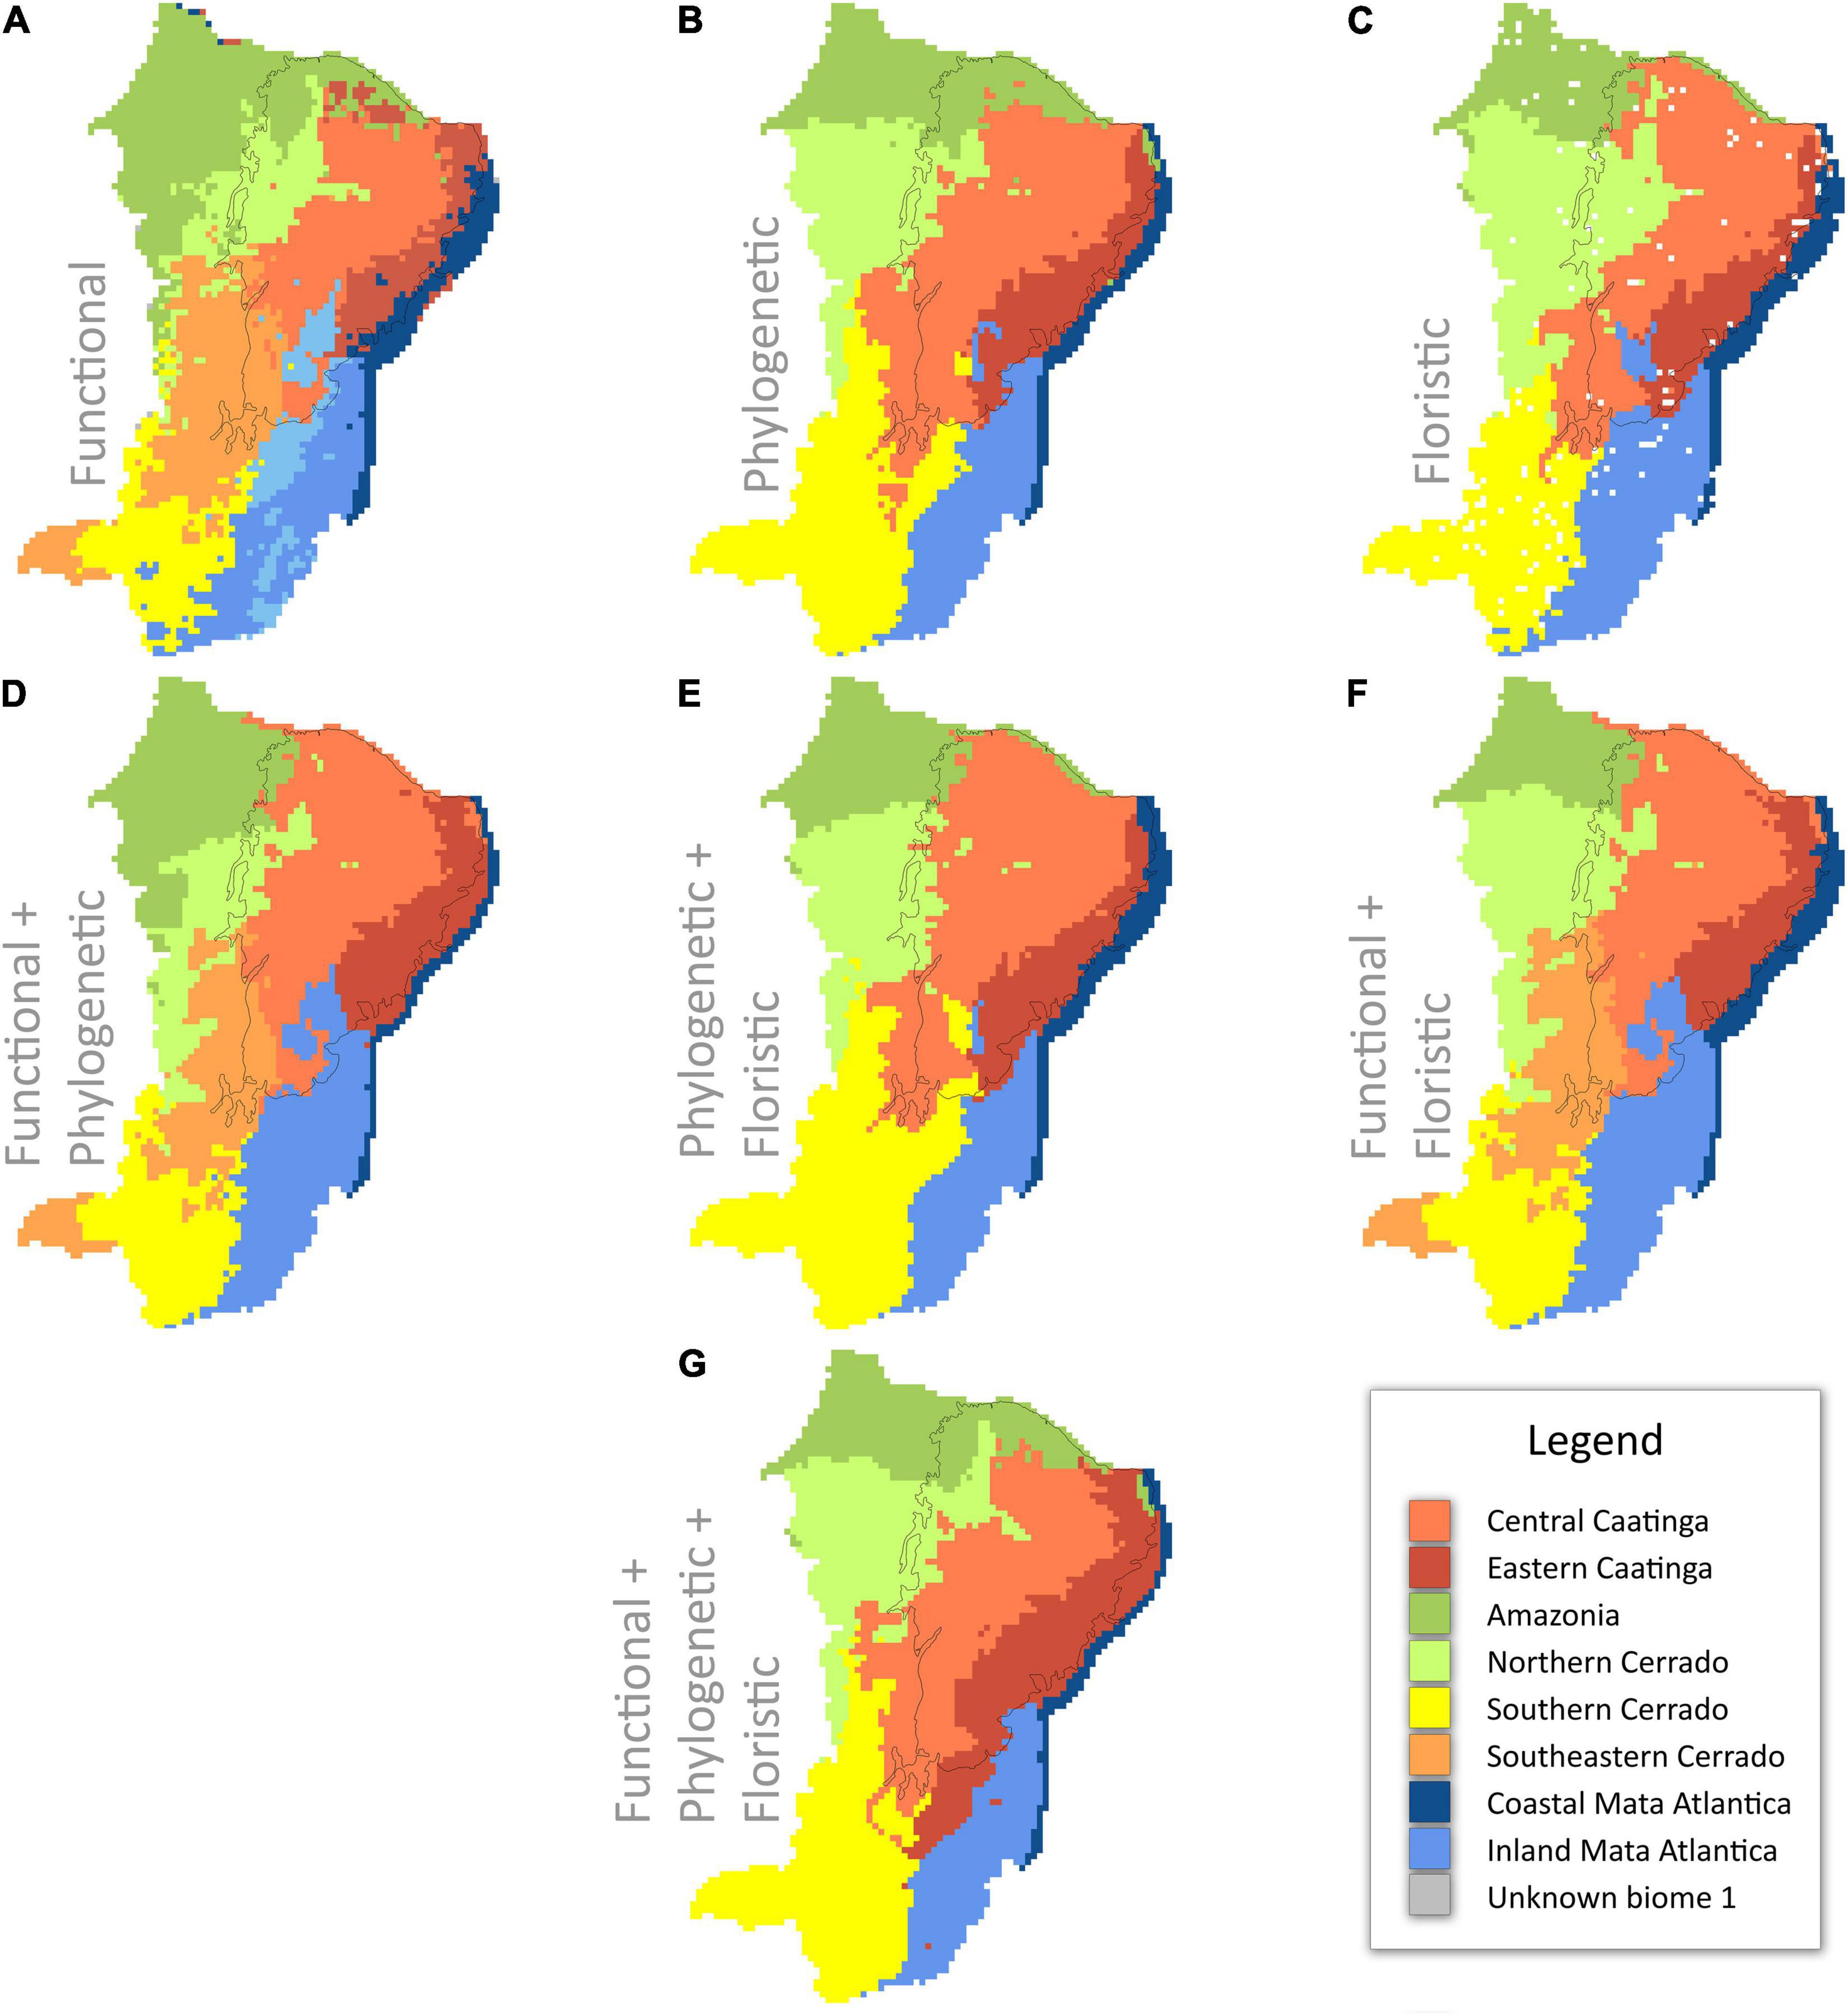
Figure 2. Cluster classifications across northeast Brazil based upon hierarchical clustering analyses of functional, phylogenetic, and floristic data alone (A–C) and in combination (D–F): (A) functional data; (B) phylogenetic data; (C) floristic data; (D) functional and phylogenetic data; (E) phylogenetic and floristic data; (F) functional and floristic data; and (G) functional, phylogenetic, and floristic data. The black line indicates the limits of the Caatinga domain sensu Instituto Brasileiro de Geografia e Estatística (IBGE) (2012).
Differences Between Approaches
The areas where differences between the three regionalizations are seen can be considered as transitional areas (Figure 3 and Supplementary Figure 4). Most disagreement between the three individual regionalizations is seen in the southern part of the Caatinga biogeographic domain in the Chapada Diamantina area (Figures 2, 3). Functional and floristic regionalizations identify most of this area as Mata Atlantica but the phylogenetic regionalization identifies most of these areas as Cerrado (Figures 2, 3).
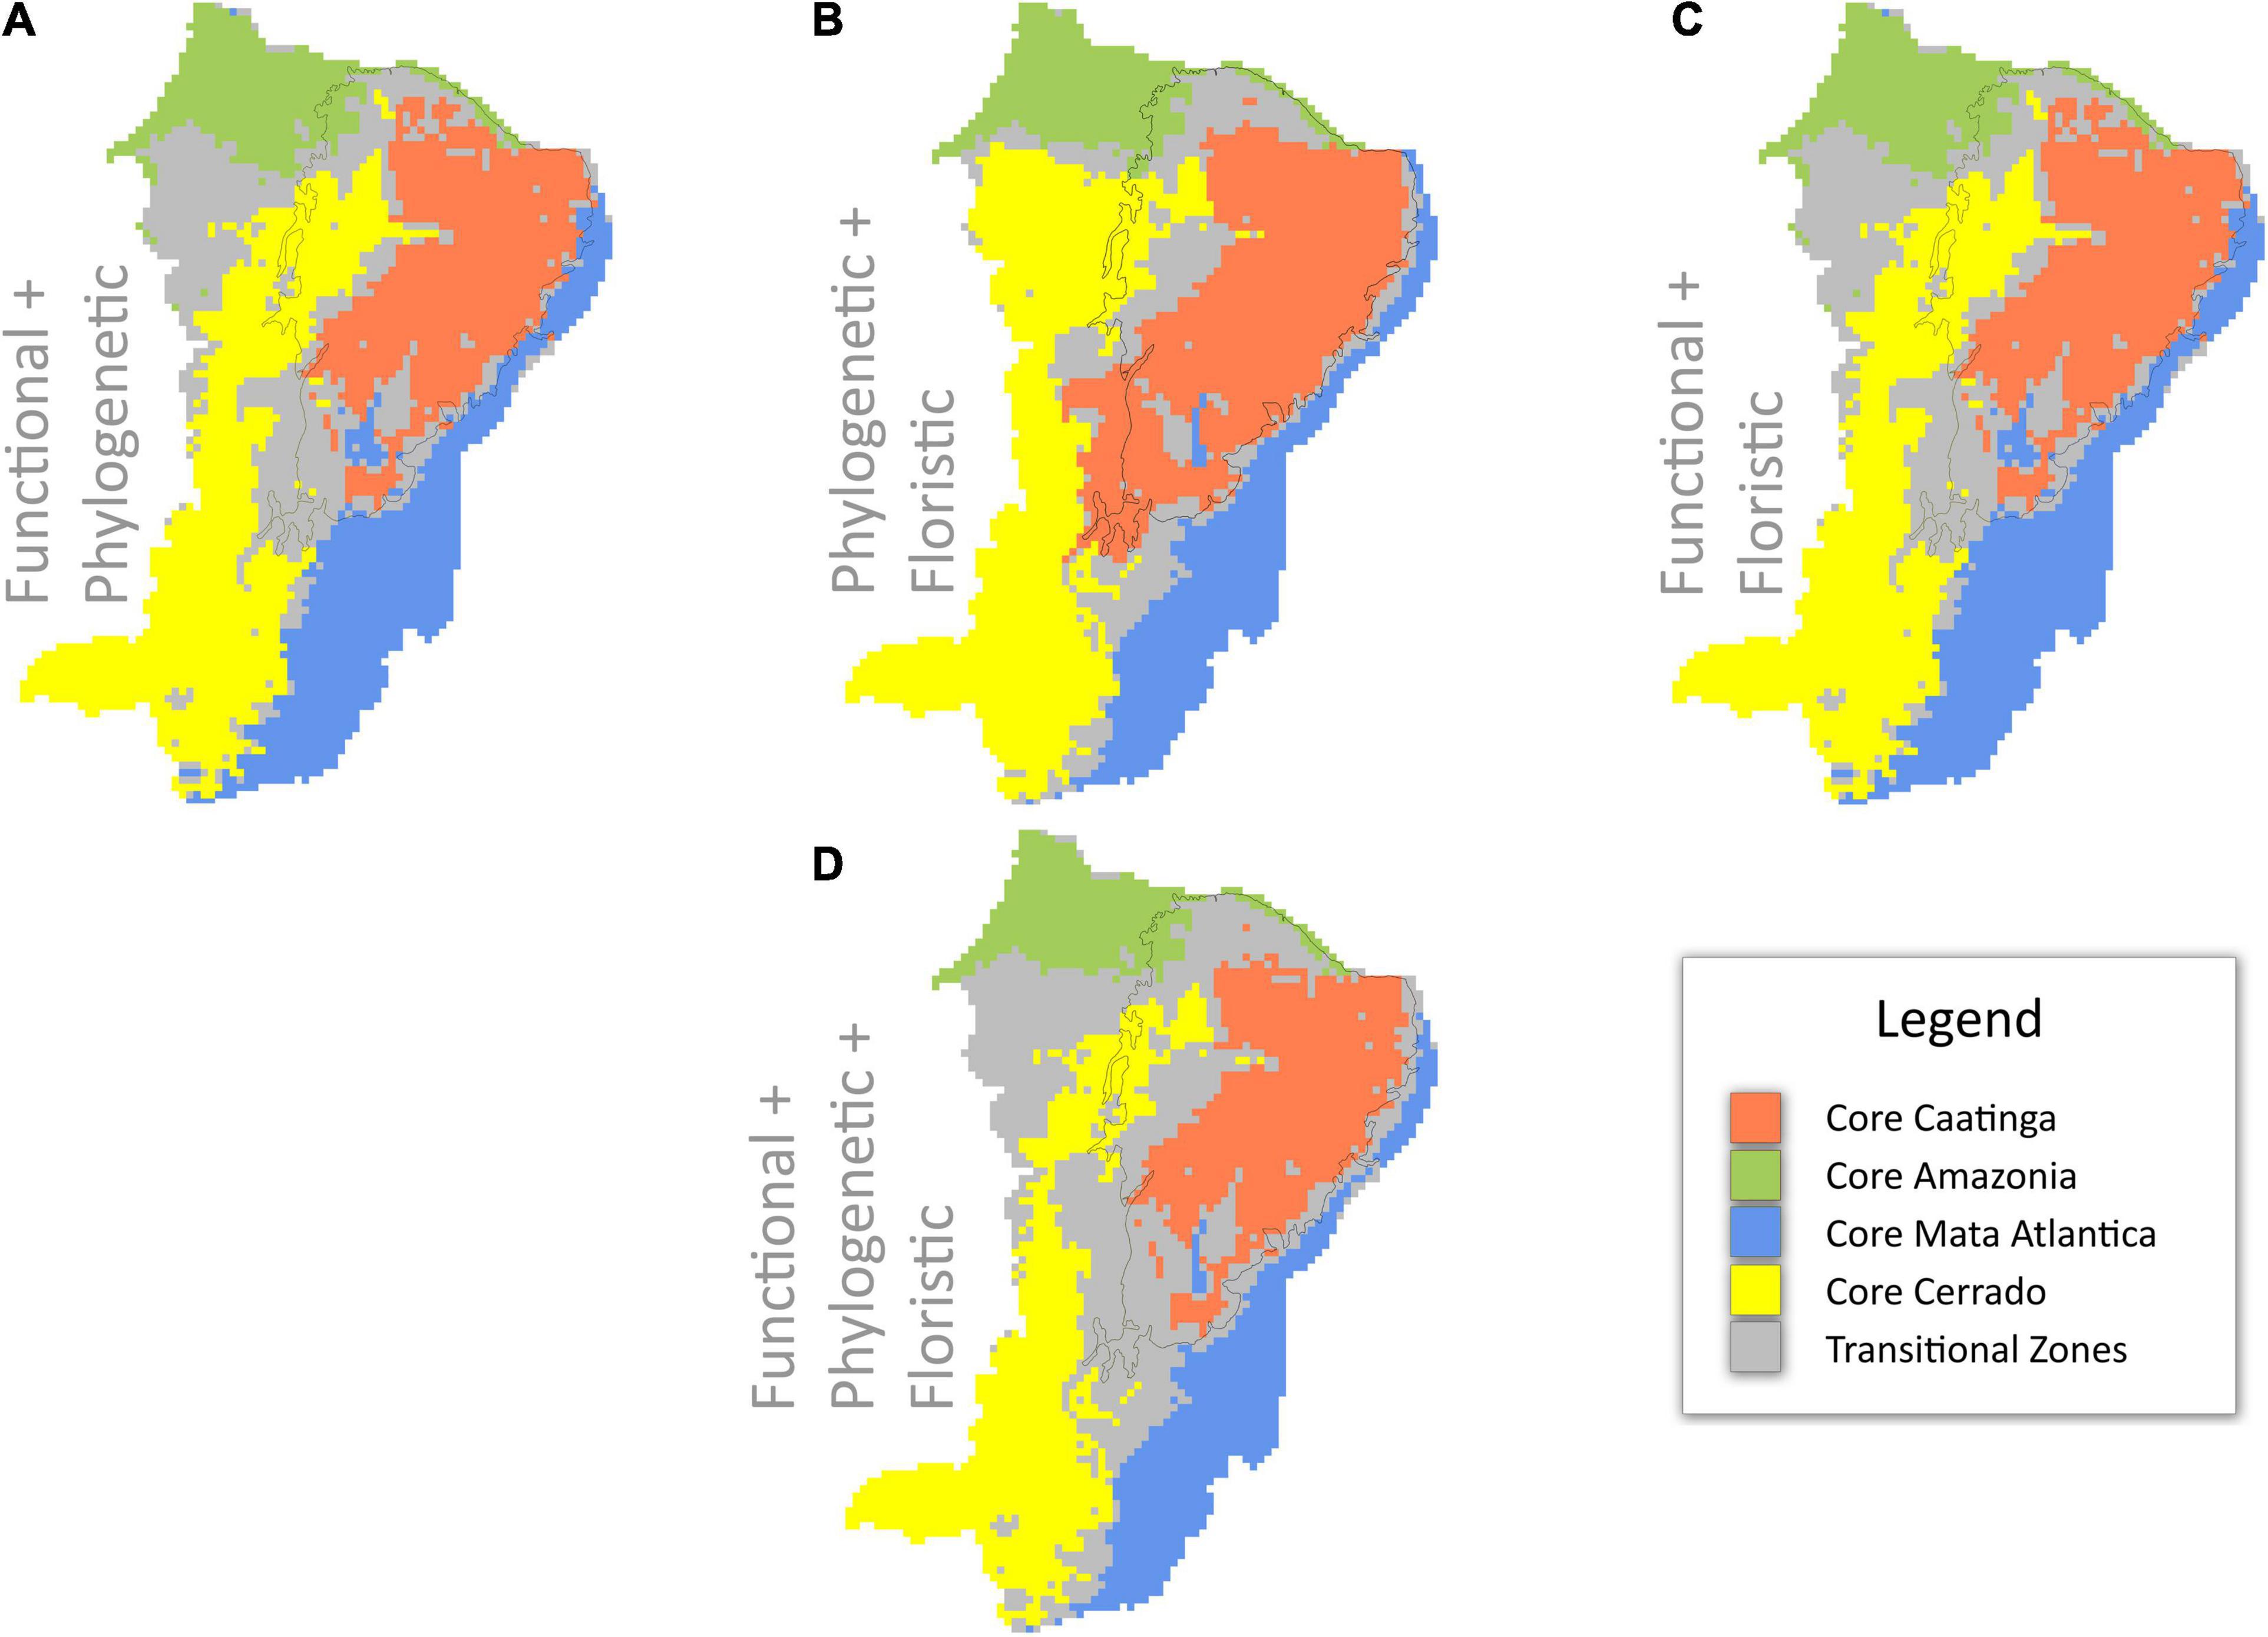
Figure 3. Areas of agreement and disagreement among biome delimitations across northeast Brazil based upon hierarchical clustering analyses of functional, phylogenetic, and floristic data alone (see Figures 2A–C). Areas of agreement are shown as “core” clusters (A–C) or biomes (D) and areas of disagreement are shown as “transitional zones.” (A) functional and phylogenetic data; (B) phylogenetic and floristic data; (C) functional and floristic data; and (D) functional, phylogenetic, and floristic data. The black line indicates the limits of the Caatinga domain sensu Instituto Brasileiro de Geografia e Estatística (IBGE) (2012). Alternative plots showing the identity of transitional zones are given in Supplementary Figure 4.
Comparison of clusters delimited by single approaches shows that clusters delimited by floristic and phylogenetic approaches are highly similar both in spatial extent and number of major clusters where both analyses resolve seven major clusters in largely similar areas across NE Brazil (Figures 2, 3). Functional clusters show largest differences compared to phylogenetic and floristic clusters, and resolve ten major clusters indicating higher resolution of functional data for biome delimitation within NE Brazil, enabling further splitting of vegetation types as functionally distinct clusters (Figures 2, 3 and Supplementary Figure 3). This is despite our functional classification being based on only seven categorical traits.
The “Core” Caatinga
In terms of the SDTF biome, all three analyses identified two groups as Caatinga SDTF (Figures 2A–C). A large area within NE Brazil is identified here as the “core Caatinga” biome supported by all three regionalizations (functional, phylogenetic, and floristic) (Figure 4). Areas surrounding the “core” Caatinga are identified as “transitional Caatinga” (Figure 4): these include areas supported as Caatinga by one or two regionalizations but not all three. Transitional Caatinga is found across the western and southern borders of the “core” Caatinga, much less so along the eastern side along the boundary with the coastal Mata Atlantica domain (Figures 3, 4). Floristic and phylogenetic data support transitional Caatinga in the South and West of the “core” Caatinga, but functional data identify these areas as savanna-like Cerrado (e.g., Chapada do Araripe; Figures 2, 3). In common with the individual analyses, all mapped Caatinga groups were largely congruent with the Caatinga domain along its eastern border but included several differences along the eastern border, which are discussed in detail below.
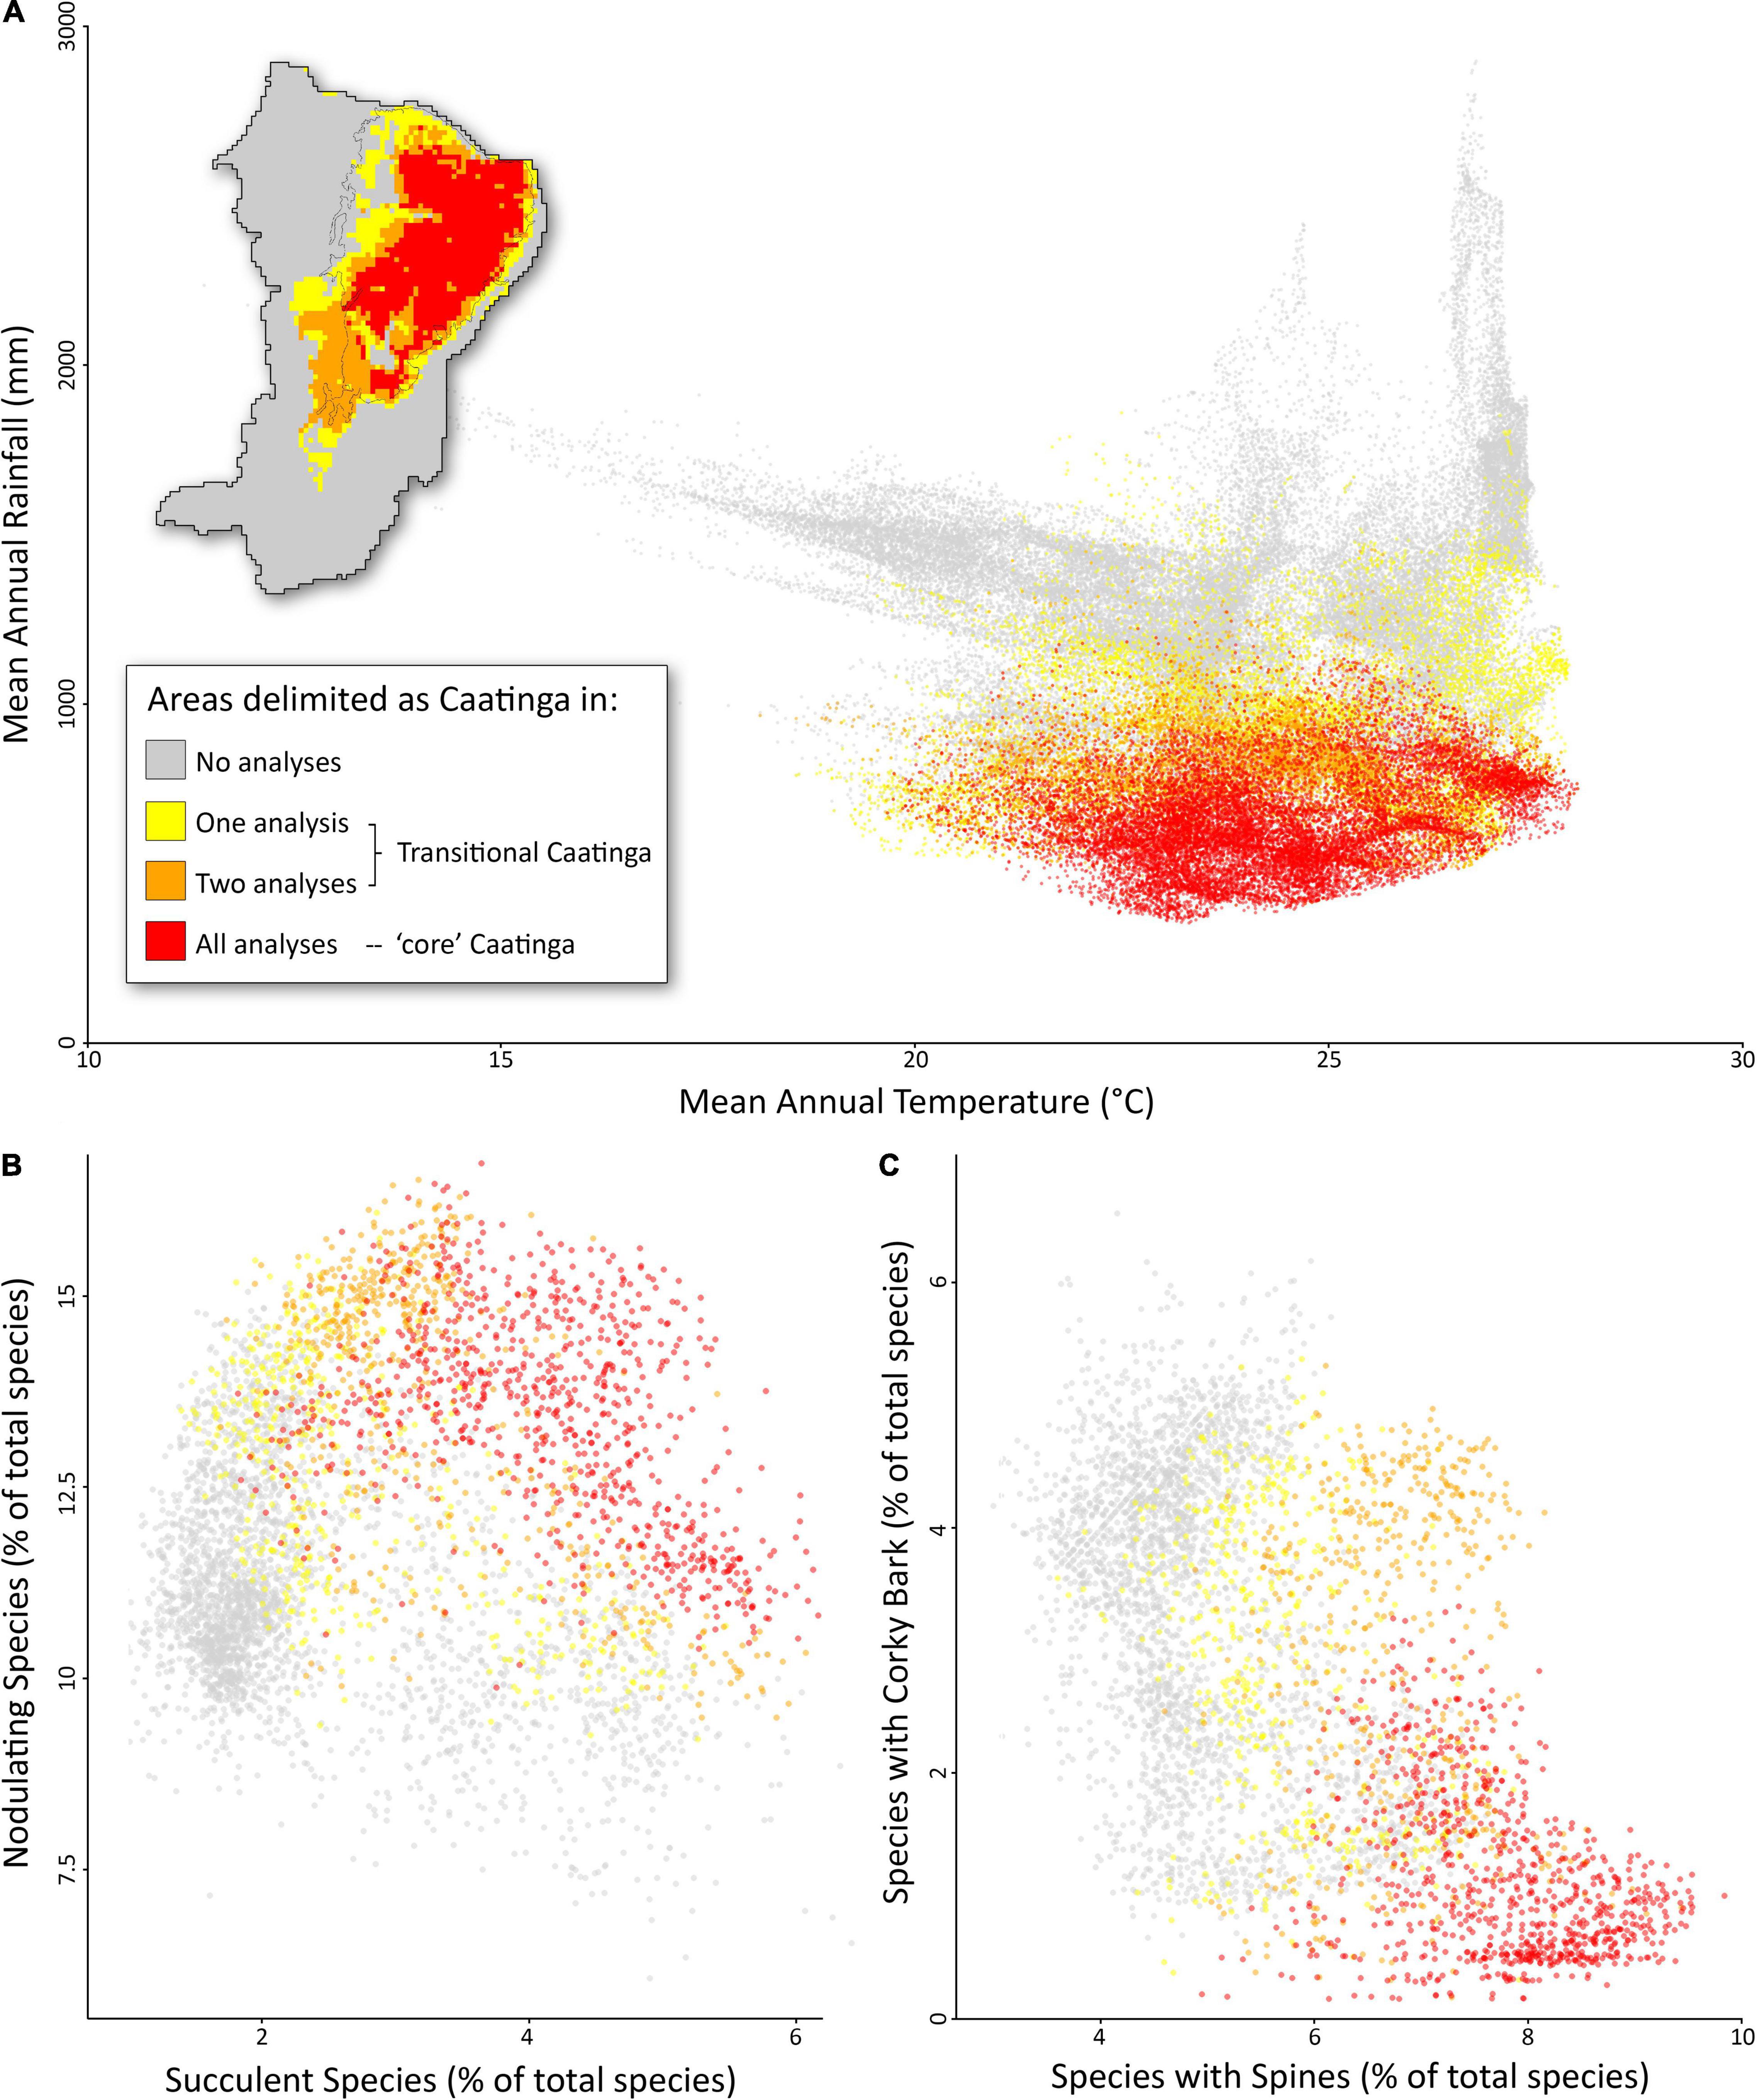
Figure 4. Distribution of the Caatinga seasonally dry forest biome within NE Brazil in geographic, environmental (A) and trait (B,C) space. Colors indicate areas delimited as Caatinga in no analyses (gray), one or two analyses (“transitional Caatinga,” yellow and orange), and three analyses (“core” Caatinga, red). The black line in the map indicates the limits of the Caatinga domain sensu Instituto Brasileiro de Geografia e Estatística (IBGE) (2012).
Our integrated biome delimitation using a combination of floristic, functional, and phylogenetic data identifies the “core” Caatinga within the driest and hottest areas of NE Brazil (Figure 4A). These areas are dominated by a floristically, functionally, and phylogenetically distinct flora adapted to dry conditions with seasonal rainfall. This “core” Caatinga area is found in areas with 353–1,271 mm annual rainfall and with a mean annual temperature from 19.6 to 28.0°, and does not overlap with other core biomes in environmental space (Figure 4A). The flora of the “core” Caatinga is characterized by a high proportion of species that are succulent, nodulating (Figure 4B), and with spines but without corky bark (Figure 4C). The low rainfall in the “core” Caatinga is notable. Dry forests in the Americas are found in areas with up to 1800 mm rainfall (DRYFLOR, 2016; Dexter et al., 2018) but none of the “core” Caatinga dry forests approach this threshold, despite the prevalence of areas with higher rainfall in the wider study area of NE Brazil.
Discussion
Core Biomes and Transition Zones
Biomes have been delimited in various ways, including based on the spatial distribution of physiognomic, floristic or functional discontinuities amongst plant communities (Mucina, 2019) or even dynamic global vegetation biome modeling involving the combination of physical environment, plant functional types, physiology, and biochemical fluxes (Prentice et al., 1992; Kaplan et al., 2003). Physiognomic delimitations have followed plant growth form and canopy structure (Woodward et al., 2004); floristic maps have focused on dominant plant families, genera, and species and the associated ecological correlates (e.g., in Africa, White, 1983; Power et al., 2017; Aleman et al., 2020; South America, Silva-de-Miranda et al., 2018); and functional systems on the presence of functional groups, such as evergreen trees found in the tropical rainforest biome, succulents in the seasonally dry tropical forest or succulent biome, and a continuous grass layer in savannas (Whittaker, 1970; Scholes and Archer, 1997; Schrire et al., 2005). Additionally, strictly environmental-based delimitations of biomes based on climate, edaphic composition or degree of fire disturbance have provided important insights into our understanding of the ecological limits driving the assembly of plant communities (Archibald et al., 2013; Langan et al., 2017). These different approaches based upon different types of data produce different biome maps, but no map produced using a single type of data can possibly satisfy all aspects of the multifaceted definition of a biome expected to have shaped their biodiversity over evolutionary time, i.e., delimited biomes may not be floristically, functionally, or ecologically distinct.
Our approach differs in two ways from previous methods depicting global or regional distribution of biomes, including the Caatinga (e.g., Whittaker, 1970; White, 1983; Schrire et al., 2005; Instituto Brasileiro de Geografia e Estatística [IBGE], 2012; Conradi et al., 2020; Ringelberg et al., 2020): firstly, we identify “core” biome areas supported by three distinct lines of evidence (floristic, functional, and phylogenetic), and secondly, we identify transition zones that are supported by distinct data sources that point to biologically important areas of transition previously neglected by most biome maps. Our integrated biome analyses are able to highlight “core” areas where all three data sources (floristic, functional, and phylogenetic) agree on the distribution of the same biome (Figure 4). We suggest that such areas of congruence based on multiple lines of evidence may be of particular interest to biology and earth system science.
Ultimately, the identification of biologically relevant areas should depend upon its intended purpose. If you are interested in the response of the Caatinga to climate change, for example, you should focus on the areas that independent data sources agree are “core” Caatinga (Figure 4), not areas where data sources disagree (i.e., transition zones), where the species, ecological function, or phylogenetic diversity may overlap that of other biomes. Likewise, if you wish to measure the functional traits of a species, you measure the traits of an individual at the “core” of the species concept, not a hybrid of dubious identification. Also, because the transition zones may be particularly dynamic or vulnerable to climate change (i.e., “zones of tension,” Clements, 1905), if your interest is in conserving the maximum species diversity and ecosystem function of Caatinga dry forests in the face of climate change, it may be best to model a set of species/geographic area/set of traits that all data agree are Caatinga.
The “Core” Caatinga
The Caatinga and other seasonally dry tropical forests have often been considered equivalent to the trans-continentally distributed “succulent biome,” typically characterized by nutrient-rich substrates with little water holding capacity, and by a highly seasonal, drought-prone climate in which succulent plant lineages (e.g., columnar and arborescent members of Agavaceae, Bromeliaceae, Cactaceae, and Euphorbiaceae) evolved and diversified under a regime of regular and prolonged drought and without the influences of fire and other physical disturbances (Schrire et al., 2005; Pennington et al., 2009; Ringelberg et al., 2020). The climate space of the global succulent biome as recently modeled by the distribution of stem succulents involves a mean annual rainfall that closely matches that of South American SDTFs (Ringelberg et al., 2020), which also have a high proportion of stem succulents (DRYFLOR, 2016; Queiroz et al., 2017). Also at intercontinental scales, Segovia et al. (2020) underlines the structuring of evolutionary diversity of trees in the Neotropics along precipitation gradients. Precipitation-related bioclimatic variables were singled out as the most important precipitation measures predicting the succulent biome with a MaxEnt approach to large-scale biome distribution modeling of South American SDTFs (Särkinen et al., 2011). These same precipitation variables were found by Oliveira-Filho et al. (2013a) to be most important in distinguishing the succulent (including the Caatinga) and savanna (including the Cerrado) biomes. The analysis of community phylogenetic distances and the biome assignments of 466 floristic sites across eastern Brazil were best explained, of all the bioclimatic variables, by only annual precipitation at a threshold of <1,200 mm (Oliveira-Filho et al., 2013a). This ecological structure reflects the link between annual precipitation and phylogenetic niche conservatism (Oliveira-Filho et al., 2013a; Segovia et al., 2020). Substrate conditions were shown to be ecologically significant (with or without water-holding capacity), but this ecological variable may not mask the more important influence of annual precipitation as explanatory of the community phylogenetic structure (Oliveira-Filho et al., 2013a).
While comparative analyses have employed multiple taxa to interrogate biomes, other approaches seek to identify key taxa or functional groups that can be used to delimit biomes. One such technique was employed by Ringelberg et al. (2020), who used modeled distributions of a single functional group (i.e., stem succulents) to map the “succulent biome” (Schrire et al., 2005; Ringelberg et al., 2020). The results do not adequately capture the biome complexity in Brazil. For example, Ringelberg et al. (2020) delimit not just the Caatinga as succulent biome, but also parts of the Chaco and the campos rupestres of the Chapada Diamantina, which are ecologically, historically, and functionally distinct biomes (Pennington et al., 2000; DRYFLOR, 2016; Silva-de-Miranda et al., 2018; Rapini et al., 2021). Indeed, we demonstrate that not just the “core” Caatinga but also transitional and non-Caatinga areas have high proportions of stem succulents (Figure 4B). Such single-criterion approaches to biome delimitation do not differ much from an operational view of biomes (Conradi et al., 2020). If biomes are to be defined as evolutionary theaters, the distributions of as general group of taxa as possible should be examined in conjunction with their phylogenetic relationships and functional characteristics. Our integrated ecological and evolutionary approach involving multiple taxa across all growth forms and associated measurements of functional and phylogenetic diversity seem to better describe “core” evolutionary arenas.
Our results show that the “core” Caatinga area is in fact narrower than the widely used definition of Caatinga by Instituto Brasileiro de Geografia e Estatística [IBGE], 2012. It excludes the wetter end of dry forests and transitional areas between savanna and dry forests (Figure 4). Not only that, but other major biomes exist within the Caatinga region (Queiroz et al., 2017). Disagreement between the three regionalizations in the Chapada Diamantina region, for example, highlights the biological reality of complex variation across environmentally highly heterogeneous areas, and should not be ignored. Thus, areas delimited by an essentially geographic approach such as that used by Instituto Brasileiro de Geografia e Estatística [IBGE] (2012) should not be termed “biomes.” These approaches not only oversimplify the complexity of the interdigitating nature of biomes, but also disregard the global nature dimension of biomes, which is fundamental to a more biologically realistic use of biomes in ecology, conservation, and evolutionary biogeography.
Transitional Biome Areas
One of the perhaps most important messages of our study relates to areas where the three regionalizations disagree in their cluster delimitation (Figure 3). These areas of disagreement between floristic, functional, and phylogenetic data indicate the presence of transition zones between two or more biomes, presumably along environmental gradients. An alternative method of visualizing transition zones is presented in Supplementary Figure 3. Most previous biome delimitation analyses have not included transition zones, treating biomes as categorical variables with no intermediates (e.g., Instituto Brasileiro de Geografia e Estatística [IBGE] (2012); see Figure 1). Here we highlight transition zones as biologically interesting areas in their own right that cover a large percentage of our study area. For example, the area we delimit as “core” Caatinga covers 420k km2 and the areas we delimit as transition zones cover 480k km2 (254k km2 delimited as Caatinga by two analyses; 227k km2 delimited as Caatinga by one analysis), or 14% larger than the “core” Caatinga itself.
The existence and extent of transition zones raises an important question: what may underlie the differences among the results from our individual regionalizations and what may these differences tell us about biomes in NE Brazil? Transition zones may reveal areas along environmental gradients between “core” biomes where sets of traits from more than one biome may permit survival, as suggested by the “environmental crossroads hypothesis” (Neves et al., 2020). Additionally, we predict that differences in the adaptations required to successfully persist under different rainfall regimes lead to distinct floristic and functional compositions across biomes. The level of phylogenetic distinctiveness, on the other hand, will depend on the relative ease at which plants have acquired adaptations required for crossing environmental gradients, i.e., the level of phylogenetic niche and trait conservatism (Donoghue, 2008; Crisp et al., 2009).
Our results show that similar clusters are delimited using phylogenetic and floristic data across NE Brazil, some of which we suggest correspond to biomes that can be recognized at global scale, including SDTF, rainforest, and savanna. This indicates that phylogenetic niche conservatism is operating and preventing plant lineages from crossing environmental gradients across evolutionary time (e.g., extreme drought constrained species adaptations to successfully thrive in dry forests identified here as Caatinga). Functional clusters, however, show clear differences to floristic and phylogenetic clusters, both in the number of clusters and the geographic distribution of those clusters (Figure 3). The differences between the functional (Figure 3A) and phylogenetic (Figure 3B) regionalizations indicate that the functional traits included in our analyses are not conserved across the phylogeny of the angiosperms, or that phylogenetic trait conservatism acts differently for different traits. This may relate to the specific traits used here (e.g., we do not expect spines or corky bark to be conserved) but our analyses do include several well conserved traits (e.g., nodulation, latex, and C4 photosynthesis). The differences between the floristic (Figure 3A) and functional (Figure 3C) regionalizations may indicate that the possession of certain trait combinations may allow limited sets of species to span borders created by ecological and evolutionary processes.
The identity of clusters identified in the functional analysis that could not be linked to any previously indicated biomes is unclear. They might reflect that the functional data is capturing the complexity with respect to the high within-biomes habitat heterogeneity across NE Brazil. For example, each of the most predominant savanna, rainforest, and the “core” Caatinga seasonally dry forest biomes are not physiognomically, floristically, and edaphically homogeneous, rather they also exhibit highly specialized habitats. Just in the “core” Caatinga, plant communities seem to have been evolutionarily structured by major soil types like karst, sand, and crystalline (Santos et al., 2012; Moro et al., 2015; Queiroz et al., 2017); the savanna here encompasses all the campos rupestres vegetation on mountaintops of the Chapada Diamantina, which mostly involve fire-sensitive plant lineages, including succulents (Rapini et al., 2021); and the Mata Atlantica involves habitats as distinct as the more open coastal restingas (Scarano, 2002; Oliveira et al., 2014; Fernandes and Queiroz, 2015). These habitats may not be unique in their phylogenetic or floristic composition as potentially distinct biomes but are in their functional composition.
Agreement in clusters delimited by all three regionalizations in areas such as along the eastern border of the “core” Caatinga suggests ecological filtering is acting in conjunction with phylogenetic niche conservatism along the same environmental gradient (Caatinga-Mata Atlantica border; Figure 4). Transitional Caatinga areas in the southern parts of the Caatinga biogeographic domain indicate that ecological filtering is acting along different environmental gradients to phylogenetic niche conservatism, at least for some of the traits included in our analyses.
Biologically Meaningful Biomes in Evolutionary Biogeography
Comparative phylogenetic approaches of multiple taxa to understand the evolutionary history of the biodiversity in species-rich, yet geologically and climatically complex regions like the Neotropics have revealed important insights into how lineages and species interact with ecology and geography over evolutionary time. Such analyses often employ the reconstruction of ancestral areas across phylogenies to estimate the rates of biotic interchange between biogeographic regions. For example, Antonelli et al. (2018) showed an impressively large number of dispersal events out of Amazonia to other major neotropical regions, where at least 85 species among angiosperms, birds, ferns, frogs, mammals, and squamates inhabiting the Caatinga region were inferred to have derived from an Amazonian ancestor. Biogeographic regions are often treated as homogeneous units (i.e., synonymous with biomes) in estimates of ancestral distributions. This approach cannot take into account the complexity of climatic, evolutionary, and functional spaces that confine species ecologically as we demonstrate for NE Brazil here. As such, it risks conflating the primary roles of geography and ecology, such that biome switching is likely to be overestimated in ecologically confined groups with broad distributions but underestimated in biogeographically confined groups with broad ecological distributions. Thus, such comparative approaches cannot allow us to deepen our understanding of whether the “core” Caatinga or the other putatively distinct biomes of NE Brazil (Figure 3) are more evolutionarily accessible to lineages from Amazonian tropical rainforests. In other words, some Amazon to Caatinga “switches” may be to “rainforests” within the Caatinga biogeographic region and thus represent geographic movements, not evolutionary switches. Likewise, most studies neglect that the grass-rich, fire-prone savanna biome that predominates in the Cerrado domain is criss-crossed by a network of gallery forests (i.e., rainforests; Silva-de-Miranda et al., 2018), as well as fire-sensitive seasonally dry, evergreen or semideciduous forests, depending on water availability, in patches of high fertility soils (Oliveira-Filho et al., 2013b; Bueno et al., 2018).
That lineages can transcend geographic barriers is also a product of the evolutionary accessibility of distinct biomes that create geographical opportunity (Edwards and Donoghue, 2013). So, by inferring biotic interchange across biogeographic regions (e.g., Antonelli et al., 2018), without considering the biotic complexity within them, it is impossible to uncover the true balance of phylogenetic biome conservatism versus evolutionary biome shifts. Fortunately, recent progress has been made toward developing more biogeographically realistic approaches that model how lineages shift between biomes depending on the temporal availability and geographical connectivity of biomes (Landis et al., 2021a,b). A definition that captures the most biologically meaningful nature of a biome in space and time is clearly critical for comparative analyses involving Landis et al.’s (2021a) phylogenetic biome shift model. Thus, we believe that our approach of combining the multiple dimensions describing the spatial distribution of biomes will help to more reliably map and understand the evolution and functioning of biodiversity.
Data Availability Statement
The datasets presented in this study can be found in online repositories. The names of the repository/repositories and accession number(s) can be found in the article/Supplementary Material.
Author Contributions
DC, PWM, and TS designed the study and led the writing with significant contributions from all co-authors. DC, GR, and PWM entered functional trait data. GO generated sequence data for community phylogeny. CD designed the pipeline for producing community phylogenies. PWM led all analyses. All authors commented and agreed on the last version of the manuscript.
Funding
This research was funded by the Natural Environment Research Council-Newton grant NE/N012526/1 and Fundação de Amparo à Pesquisa do Estado de São Paulo grant 2015/50488-5 “Nordeste: New Science for a Neglected Biome,” and Royal Society Advanced Fellowship grant NAF/R1/180331. DC’s research in plant biodiversity is also funded by Fundação de Amparo à Pesquisa do Estado da Bahia (Universal no. APP0037/2016) and Conselho Nacional de Desenvolvimento Científico e Tecnológico Research Productivity PQ-2 grant 308244/2018-4.
Conflict of Interest
The authors declare that the research was conducted in the absence of any commercial or financial relationships that could be construed as a potential conflict of interest.
Publisher’s Note
All claims expressed in this article are solely those of the authors and do not necessarily represent those of their affiliated organizations, or those of the publisher, the editors and the reviewers. Any product that may be evaluated in this article, or claim that may be made by its manufacturer, is not guaranteed or endorsed by the publisher.
Acknowledgments
We thank Centro de Referência em Informação Ambiental (CRIA) and Reflora for sharing their complete distribution datasets; Alexandre Brunello, Luiza Cosme, Moabe Fernandes, Raquel Miatto, Marcelo Mizushima, Tony Oliveira, Oliver Phillips, Desirée Ramos, Raphael Rocha, Rubens Santos, Valdemir Silva, and Elmar Veenendaal for helping collecting silica-gel dried leaf samples during fieldwork; Glaucia Drummond (Fundação Biodiversitas, Canudos) and Eudes Velozo (Fazenda Esperança, Boa Vista do Tupim) for their support during fieldwork; Matt Lavin and two reviewers for their valuable suggestions to improve the manuscript; and Associate Editor Danilo Neves for inviting us to contribute with the special issue “Temporal and large-scale spatial patterns of plant diversity and diversification.” DC acknowledges Jon Lloyd for inviting him to be speaker of the 44th New Phytologist Symposium “Determinants of tropical vegetation structure and function” in Accra, Ghana, when most ideas of this article were originally presented.
Supplementary Material
The Supplementary Material for this article can be found online at: https://www.frontiersin.org/articles/10.3389/fevo.2021.723558/full#supplementary-material
Supplementary Figure 1 | Species richness across northeast Brazil showing (A) “raw” species richness from cleaned occurrence data for 9,134 species with ≥5 records; (B) “raw” species richness from cleaned occurrence data for 3,547 species included in all analyses; (C) modeled species richness for 3,547 species included in all analyses.
Supplementary Figure 2 | Community phylogeny for northeast Brazil.
Supplementary Figure 3 | Dendrograms showing the major clusters from the cluster analyses based upon: (A) phylogenetic data; (B) floristic data; (C) functional data; (D) taxonomic and functional data combined; (E) taxonomic and phylogenetic data combined; (F) functional and phylogenetic data combined; (G) taxonomic, functional, and phylogenetic data combined. Clusters are colored by their biome classification and are mapped in geographic space in Figures 2A–G.
Supplementary Figure 4 | Areas of agreement and disagreement among biome classifications across northeast Brazil based upon hierarchical clustering analyses of functional, phylogenetic, and floristic data alone (see Figures 2A–C). Areas of agreement (“core” biomes) are highlighted as per the legend and areas of disagreement (“transitional zones”) are shown with intermediate colors between core biomes. (A) functional and phylogenetic data; (B) phylogenetic and floristic data; (C) functional and floristic data; and (D) functional, phylogenetic, and floristic data. The black line indicates the limits of the Caatinga domain sensu Instituto Brasileiro de Geografia e Estatística [IBGE] (2012).
Supplementary Figure 5 | Raster file used to produce Figure 4A that highlights the “core” Caatinga and associated transition zones.
Supplementary Table 1 | Voucher details for DNA sequences newly generated in this study.
Supplementary Table 2 | Species included in the analyses, including taxonomic family, functional traits, and model performance statistics.
Supplementary Table 3 | The relationship between Continuous Boyce Index (CBI) and the number of independent records by species.
Footnotes
- ^ http://floradobrasil.jbrj.gov.br/
- ^ http://www.splink.org.br/
- ^ http://floradobrasil.jbrj.gov.br/reflora/herbarioVirtual/
- ^ https://soilgrids.org/
- ^ https://www.ncbi.nlm.nih.gov/genbank/
- ^ www.phylo.org
References
Aberer, A. J., Krompass, D., and Stamatakis, A. (2012). Pruning rogue taxa improves phylogenetic accuracy. Syst. Biol. 62, 162–166. doi: 10.1093/sysbio/sys078
Aleman, J. C., Fayolle, A., Favier, C., Staver, A. C., Dexter, K. G., Ryan, C. M., et al. (2020). Floristic evidence for alternative biome states in tropical Africa. Proc. Natl. Acad. Sci. U.S.A. 117, 28183–28190. doi: 10.1073/pnas.2011515117
Amaral, A. G., Munhoz, C. B. R., Walter, B. M. T., Aguirre-Gutiérrez, J., and Raes, N. (2017). Richness pattern and phytogeography of the Cerrado herb–shrub flora and implications for conservation. J. Veg. Sci. 28, 848–858. doi: 10.1111/jvs.12541
Anderson, R. P., and Raza, A. (2010). The effect of the extent of the study region on GIS models of species geographic distributions and estimates of niche evolution: preliminary tests with montane rodents (genus Nephelomys) in Venezuela. J. Biogeogr. 37, 1378–1393. doi: 10.1111/j.1365-2699.2010.02290.x
Antonelli, A., Zizka, A., Carvalho, F. A., Scharn, R., Bacon, C. D., Silvestro, D., et al. (2018). Amazonia is the primary source of Neotropical biodiversity. Proc. Natl. Acad. Sci. U.S.A. 115, 6034–6039. doi: 10.1073/pnas.1713819115
Araujo, H. F. P., and Silva, J. M. C. (2017). “The avifauna of the Caatinga: biogeography, ecology, and conservation,” in Caatinga: The Largest Tropical Dry Forest Region in South America, eds J. M. C. Silva <suffix>I</suffix>, R. Leal and M. Tabarelli (Cham: Springer), 181–210.
Archibald, S., Lehmann, C. E. R., Gómez-Dans, J. L., and Bradstock, R. A. (2013). Defining pyromes and global syndromes of fire regimes. Proc. Natl. Acad. Sci. U.S.A. 110, 6442–6447. doi: 10.1073/pnas.1211466110
Baselga, A. (2010). Partitioning the turnover and nestedness components of beta diversity. Glob. Ecol. Biogeogr. 19, 134–143. doi: 10.1111/j.1466-8238.2009.00490.x
Baselga, A., Orme, D., Villéger, S., de Bortolli, J., and Leprieur, F. (2018). Package ‘betapart’: Partitioning Beta Diversity into Turnover and Nestedness. R Package Version 1.5.0. Available online at: https://CRAN.R-project.org/package=betapart (accessed April 11, 2021).
Benson, D. A., Cavanaugh, M., Clark, K., Karsch-Mizrachi, I., Lipman, D. J., Ostell, J., et al. (2017). GenBank. Nucleic Acid Res. 45, D37–D42. doi: 10.1093/nar/gkw1070
Blonder, B., Nogués-Bravo, D., Borregaard, M. K., Donoghue, J. C., Jørgensen, P. M., Kraft, N. J. B., et al. (2015). Linking environmental filtering and disequilibrium to biogeography with a community climate framework. Ecology 96, 972–985. doi: 10.1890/14-0589.1
Boyce, M. S., Vernier, P. R., Nielsen, S. E., and Schmiegelow, F. K. A. (2002). Evaluating resource selection functions. Ecol. Modell. 157, 281–300. doi: 10.1016/s0304-3800(02)00200-4
Bueno, M. L., Dexter, K. G., Pennington, R. T., Pontara, V., Neves, D. M., Ratter, J. A., et al. (2018). The environmental triangle of the Cerrado domain: ecological factors driving shifts in tree species composition between forests and savannas. J. Ecol. 106, 2109–2120. doi: 10.1111/1365-2745.12969
Cardoso, D. B. O. S., and Queiroz, L. P. (2010). “Caatinga no contexto de uma metacomunidade: evidências da biogeografia, padrões filogenéticos e abundância de espécies em leguminosas,” in Biogeografia da América do Sul: Padrões e Processos, eds C. J. B. Carvalho and E. A. B. Almeida (São Paulo: Roca), 241–260.
Cardoso, D. B. O. S., Queiroz, L. P., and Lima, H. C. (2014). A taxonomic revision of the South American papilionoid genus Luetzelburgia (Fabaceae). Bot. J. Linn. Soc. 175, 328–375. doi: 10.1111/boj.12153
Carvajal-Endara, S., Hendry, A. P., Emery, N. C., and Davies, J. (2017). Habitat filtering not dispersal limitation shapes oceanic island floras: species assembly of the Galápagos archipelago. Ecol. Lett. 20, 495–504. doi: 10.1111/ele.12753
Cavender-Bares, J., Kozak, K., Fine, P., and Kembel, S. (2009). The merging of community ecology and phylogenetic biology. Ecol. Lett. 12, 693–715. doi: 10.1111/j.1461-0248.2009.01314.x
Chave, J., Chust, G., and Thébaud, C. (2007). “The importance of phylogenetic structure in biodiversity studies,” in Scaling Biodiversity, eds D. Storch, P. Marquet, and J. H. Brown (Santa Fe: Institute Editions), 151–167.
Clements, F. E. (1905). Research Methods in Ecology. Lincoln, NB: University of Nebraska Publishing Company.
Connell, J. H. (1978). Diversity in tropical rain forests and coral reefs. Science 199, 1302–1310. doi: 10.1126/science.199.4335.1302
Conradi, T., Slingsby, J. A., Midgley, G. F., Nottebrock, H., Schweiger, A. H., and Higgins, S. I. (2020). An operational definition of the biome for global change research. New Phytol. 227, 1294–1306. doi: 10.1111/nph.16580
Correia, I., Nascimento, E. R., and Gouveia, S. F. (2020). Effects of climate and land-use gradients on avian phylogenetic and functional diversity in a tropical dry forest. J. Arid Environ. 173:104024. doi: 10.1016/j.jaridenv.2019.104024
Crisp, M. D., and Cook, L. G. (2012). Phylogenetic niche conservatism: what are the underlying evolutionary and ecological causes? New Phytol. 196, 681–694. doi: 10.1111/j.1469-8137.2012.04298.x
Crisp, M. D., Arroyo, M. T. K., Cook, L. G., Gandolfo, M. A., Jordan, G. J., McGlone, M. S., et al. (2009). Phylogenetic biome conservatism on a global scale. Nature 458, 754–756. doi: 10.1038/nature07764
Dapporto, L., Ramazzotti, M., Fattorini, S., Talavera, G., Vila, R., and Dennis, R. L. H. (2013). Package recluster: an unbiased clustering procedure for beta-diversity turnover. Ecography 36, 1070–1075. doi: 10.1111/j.1600-0587.2013.00444.x
Dapporto, L., Ramazzotti, M., Fattorini, S., Talavera, G., Vila, R., and Dennis, R. L. H. (2015). Package Recluster: Ordination Methods for The analysis of Beta-Diversity Indices. R. Package Version 2.8. Available online at: https://CRAN.R-project.org/package=recluster (accessed July 26, 2020).
Daru, B. H., Elliott, T. L., Park, D. S., and Davies, T. J. (2017). Understanding the processes underpinning patterns of phylogenetic regionalization. Trends Ecol. Evol. 32, 845–860. doi: 10.1016/j.tree.2017.08.013
Daru, B. H., Van der Bank, M., Maurin, O., Yessoufou, K., Schaefer, H., Slingsby, J. A., et al. (2016). A novel phylogenetic regionalization of the phytogeographic zones of southern Africa reveals their hidden evolutionary affinities. J. Biogeogr. 43, 155–166. doi: 10.1111/jbi.12619
Deblauwe, V., Droissart, V., Bose, R., Sonké, B., Blach-Overgaard, A., Svenning, J.-C., et al. (2016). Remotely sensed temperature and precipitation data improve species distribution modelling in the tropics. Global Ecol. Biogeogr. 25, 443–454. doi: 10.1111/geb.12426
Dexter, K. G., Pennington, R. T., Oliveira-Filho, A. T., Bueno, M. L., Silva de Miranda, P. L., and Neves, D. M. (2018). Inserting tropical dry forests into the discussion on biome transitions in the tropics. Front. Ecol. Evol. 6:104. doi: 10.3389/fevo.2018.00104
Donoghue, M. J. (2008). A phylogenetic perspective on the distribution of plant diversity. Proc. Natl. Acad. Sci. U.S.A. 105, 11549–11555. doi: 10.1073/pnas.0801962105
Donoghue, M. J., and Edwards, E. J. (2014). Biome shifts and niche evolution in plants. Annu. Rev. Ecol. Evol. Syst. 45, 547–572. doi: 10.1146/annurev-ecolsys-120213-091905
Dória, T. A. F., and Dobrovolski, R. (2021). Improving post-2020 conservation of terrestrial vertebrates in Caatinga. Biol. Conserv. 253:108894. doi: 10.1016/j.biocon.2020.108894
Dormann, C. F., Elith, J., Bacher, S., Buchmann, C., Carl, G., Carré, G., et al. (2013). Collinearity: a review of methods to deal with it and a simulation study evaluating their performance. Ecography 36, 27–46. doi: 10.1111/j.1600-0587.2012.07348.x
DRYFLOR. (2016). Plant diversity patterns in neotropical dry forests and their conservation implications. Science 353, 1383–1387. doi: 10.1126/science.aaf5080
Edler, D., Guedes, T., Zizka, A., Rosvall, M., and Antonelli, A. (2017). Infomap bioregions: interactive mapping of biogeographical regions from species distributions. Syst. Biol. 66, 197–204. doi: 10.1093/sysbio/syw087
Edwards, E. J., and Donoghue, M. J. (2013). Is it easy to move and easy to evolve? Evolutionary accessibility and adaptation. J. Exp. Bot. 64, 4047–4052. doi: 10.1093/jxb/ert220
Fayolle, A., Swaine, M. D., Aleman, J., Azihou, A. F., Bauman, D., te Beest, M., et al. (2018). A sharp floristic discontinuity revealed by the biogeographic regionalization of African savannas. J. Biogeogr. 46, 454–465. doi: 10.1111/jbi.13475
Fernandes, M. F., and Queiroz, L. P. (2015). Floristic surveys of Restinga forests in southern Bahia, Brazil, reveal the effects of geography on community composition. Rodriguésia 66, 51–73. doi: 10.1590/2175-7860201566104
Fernandes, M. F., Cardoso, D., and Queiroz, L. P. (2020). An updated plant checklist of the Brazilian Caatinga seasonally dry forests and woodlands reveals high species richness and endemism. J. Arid Environ. 174:104079. doi: 10.1016/j.jaridenv.2019.104079
Ficetola, G. F., Mazel, F., and Thuiller, W. (2017). Global determinants of zoogeographical boundaries. Nat. Ecol. Evol. 1:0089. doi: 10.1038/s41559-017-0089
Figueiredo, O. G., Zuquim, G., Tuomisto, H., Moulatlet, G. M., Balslev, H., and Costa, F. R. C. (2017). Beyond climate control on species range: the importance of soil data to predict distribution of Amazonian plant species. J. Biogeogr. 45, 190–200. doi: 10.1111/jbi.13104
Flora do Brasil 2020 (2021). Jardim Botânico do Rio de Janeiro. Available online at: http://floradobrasil.jbrj.gov.br/ (accessed Jun 04, 2021).
Funk, C. C., Peterson, P. J., Landsfeld, M. F., Pedreros, D. H., Verdin, J. P., Rowland, J. D., et al. (2014). A quasi-global precipitation time series for drought monitoring. U.S. Geological Survey Data Series 832, 1–4. doi: 10.3133/ds832
Gagnon, E., Ringelberg, J. J., Bruneau, A., Lewis, G. P., and Hughes, C. E. (2019). Global succulent biome phylogenetic conservatism across the pantropical Caesalpinia group (Leguminosae). New Phytol. 222, 1994–2008. doi: 10.1111/nph.15633
Garda, A. A., Stein, M. G., Machado, R. B., Lion, M. B., Juncá, F. A., and Napoli, M. F. (2017). “Ecology, biogeography, and conservation of amphibians of the Caatinga,” in Caatinga: The Largest Tropical Dry Forest Region in South America, eds J. M. C. Silva <suffix>I</suffix>, R. Leal and M. Tabarelli (Cham: Springer), 133–150. doi: 10.1007/978-3-319-68339-3_5
Guedes, T. B., Sawaya, R. J., and Nogueira, C. C. (2014). Biogeography, vicariance and conservation of snakes of the neglected and endangered Caatinga region, north-eastern Brazil. J. Biogeogr. 41, 919–931. doi: 10.1111/jbi.12272
Hardy, O. J., Couteron, P., Munoz, F., Ramesh, B. R., and Pélissier, R. (2012). Phylogenetic turnover in tropical tree communities: impact of environmental filtering, biogeography and mesoclimatic niche conservatism. Global Ecol. Biogeogr. 21, 1007–1016. doi: 10.1111/j.1466-8238.2011.00742.x
Higgins, S. I., Buitenwerf, R., and Moncrieff, G. R. (2016). Defining functional biomes and monitoring their change globally. Glob. Change Biol. 22, 3583–3593. doi: 10.1111/gcb.13367
Hijmans, R. J., Phillips, S., Leathwick, J., and Elith, J. (2017). Package Dismo: Species Distribution Modelling. R Package Version 1.1-4. Available online at: https://CRAN.R-project.org/package=dismo (accessed October 11, 2021).
Hirzel, A. H., Le Lay, G., Helfer, V., Randin, C., and Guizan, A. (2006). Evaluating the ability of habitat suitability models to predict species presences. Ecol. Modell. 199, 142–152. doi: 10.1016/j.ecolmodel.2006.05.017
Hoekstra, J. M., Boucher, T. M., Ricketts, T. H., and Roberts, C. (2005). Confronting a biome crisis: global disparities of habitat loss and protection. Ecol. Lett. 8, 23–29. doi: 10.1111/j.1461-0248.2004.00686.x
Holt, B. G., Lessard, J. P., Borregaard, M. K., Fritz, S. A., Araújo, M. B., Dimitrov, D., et al. (2013). An update of Wallace’s zoogeographic regions of the world. Science 339, 74–78. doi: 10.1126/science.1228282
Hughes, C. E., Pennington, R. T., and Antonelli, A. (2013). Neotropical plant evolution: assembling the big picture. Bot. J. Linn. Soc. 171, 1–18. doi: 10.1111/boj.12006
Instituto Brasileiro de Geografia e Estatística [IBGE] (2012). Manual Técnico da Vegetação Brasileira (2a Edição Revista e Ampliada). Rio de Janeiro: IBGE.
Kaplan, J. O., Bigelow, N. H., Prentice, I. C., Harrison, S. P., Bartlein, P. J., Christensen, T. R., et al. (2003). Climate change and arctic ecosystems: 2. Modeling, paleodata-model comparisons, and future projections. J. Geophys. Res. 108:8171. doi: 10.1029/2002JD002559
Kerkhoff, A. J., Moriarty, P. E., and Weiser, M. D. (2014). The latitudinal species richness gradient in New World woody angiosperms is consistent with the tropical conservatism hypothesis. Proc. Natl. Acad. Sci. U.S.A. 111, 8125–8130. doi: 10.1073/pnas.1308932111
Kramer-Schadt, S., Niedballa, J., Pilgrim, J. D., Schröder, B., Lindenborn, J., Reinfelder, V., et al. (2013). The importance of correcting for sampling bias in MaxEnt species distribution models. Divers. Distrib. 19, 1366–1379. doi: 10.1111/ddi.12096
Kreft, H., and Jetz, W. (2010). A framework for delineating biogeographical regions based on species distributions. J. Biogeogr. 37, 2029–2053. doi: 10.1016/j.ympev.2017.01.018
Kress, W. J., Erickson, D. L., Jones, F. A., Swenson, N. G., Perez, R., Sanjur, O., et al. (2009). Plant DNA barcodes and a community phylogeny of a tropical forest dynamics plot in Panama. Proc. Natl. Acad. Sci. U.S.A. 106, 18621–18626. doi: 10.1073/pnas.0909820106
Landis, M., Edwards, E. J., and Donoghue, M. J. (2021a). Modeling phylogenetic biome shifts on a planet with a past. Syst. Biol. 70, 86–107. doi: 10.1093/sysbio/syaa045
Landis, M., Eaton, D. A. R., Clement, W. L., Park, B., Spriggs, E. L., Sweeney, P., et al. (2021b). Joint phylogenetic estimation of geographic movements and biome shifts during the global diversification of Viburnum. Syst. Biol. 70, 67–85. doi: 10.1093/sysbio/syaa027
Langan, L., Higgins, S. I., and Scheiter, S. (2017). Climate-biomes, pedo-biomes or pyro-biomes: which world view explains the tropical forest–savanna boundary in South America? J. Biogeogr. 44, 2319–2330. doi: 10.1111/jbi.13018
Lehmann, C. E. R., Anderson, T. M., Sankaran, M., Higgins, S. I., Archibald, S., and Hoffmann, W. A. (2014). Savanna vegetation-fire-climate relationships differ among continents. Science 343, 548–552. doi: 10.1126/science.1247355
Linder, H. P., De Klerk, H. M., Born, J., Burgess, N. D., Fjeldsa, J., and Rahbek, C. (2012). The partitioning of Africa: statistically defined biogeographical regions in sub-Saharan Africa. J. Biogeogr. 39, 1189–1205. doi: 10.1111/j.1365-2699.2012.02728.x
Manhães, A. P., Loyola, R., Mazzochini, G. M., Ganade, G., Oliveira-Filho, A. T., and Carvalho, A. R. (2018). Low-cost strategies for protecting ecosystem services and biodiversity. Biol. Conserv. 217, 187–194. doi: 10.1016/j.biocon.2017.11.009
Maurin, O., Davies, T. J., Burrows, J. E., Daru, B. H., Muasya, K. Y. A. M., van der Bank, M., et al. (2014). Savanna fire and the origins of the ‘underground forests’ of Africa. New Phytol. 204, 201–214. doi: 10.1111/nph.12936
Medeiros, E. S. S., Machado, C. C. C., Galvíncio, J. D., Moura, M. S. B., and Araujo, H. F. P. (2019). Predicting plant species richness with satellite images in the largest dry forest nucleus in South America. J. Arid Environ. 166, 43–50. doi: 10.1016/j.dib.2019.104335
Mesquita, D. O., Costa, G. C., Garda, A. A., and Delfim, F. R. (2017). “Species composition, biogeography, and conservation of the Caatinga lizards,” in Caatinga: The Largest Tropical Dry Forest Region in South America, eds J. M. C. Silva, I. R. Leal, and M. Tabarelli (Cham: Springer), 151–180. doi: 10.1007/978-3-319-68339-3_6
Miller, M. A., Pfeiffer, W., and Schwartz, T. (2010). “Creating the CIPRES science gateway for inference of large phylogenetic trees,” in Proceedings of the Gateway Computing Environments Workshop (GCE), (New Orleans).
Moncrieff, G. R., Bond, W. J., and Higgins, S. I. (2016). Revising the biome concept for understanding and predicting global change impacts. J. Biogeogr. 43, 863–873. doi: 10.1111/jbi.12701
Moonlight, P. W., Silva-de-Miranda, P. L., Cardoso, D., Dexter, K. G., Oliveira-Filho, A. T., Pennington, R. T., et al. (2020). The strengths and weaknesses of species distribution models in biome delimitation. Global Ecol. Biogeogr. 29, 1770–1784.
Moro, M. F., Silva, I. A., Araújo, F. S., Lughadha, E. N., Meagher, T. R., and Martins, F. R. (2015). The role of edaphic environment and climate in structuring phylogenetic pattern in seasonally dry tropical plant communities. PLoS One 10:e0119166. doi: 10.1371/journal.pone.0119166
Moulatlet, G. M., Zuquim, G., Figueiredo, F. O. G., Lehtonen, S., Emilio, T., Ruokolainen, K., et al. (2017). Using digital soil maps to infer edaphic affinities of plant species in Amazonia: problems and prospects. Ecol. Evol. 7, 8463–8477. doi: 10.1002/ece3.3242
Mucina, L. (2019). Biome: evolution of a crucial ecological and biogeographical concept. New Phytol. 222, 97–114. doi: 10.1111/nph.15609
Mucina, L. (2020). Biomes are everybody’s kingdom: a platform where ecology and biogeography meet. New Phytol. 228, 1463–1466. doi: 10.1111/nph.16933
Nascimento, E. R., Correia, I., Ruiz-Esparza, J. M., and Gouveia, S. F. (2018). Disentangling phylogenetic from non-phylogenetic functional structure of bird assemblages in a tropical dry forest. Oikos 127, 1177–1185. doi: 10.1111/oik.04910
Neves, D. M., Dexter, K. G., Baker, T. R., Souza, F. C., Oliveira-Filho, A. T., Queiroz, L. P., et al. (2020). Evolutionary diversity in tropical tree communities peaks at intermediate precipitation. Sci. Rep. 10:1188. doi: 10.1038/s41598-019-55621-w
Nürk, N. M., Linder, H. P., Onstein, R. E., Larcombe, M. J., Hughes, C. E., Fernández, L. P., et al. (2020). Diversification in evolutionary arenas—Assessment and synthesis. Ecol. Evol. 10, 6163–6182. doi: 10.1002/ece3.6313
Oliveira, A. A., Vicentini, A., Chave, J., Castanho, C. T., Davies, S. J., Martini, A. M. Z., et al. (2014). Habitat specialization and phylogenetic structure of tree species in a coastal Brazilian white-sand forest. J. Plant Ecol. 7, 134–144. doi: 10.1093/jpe/rtt073
Oliveira-Filho, A. T., Cardoso, D., Schrire, B. D., Lewis, G. P., Pennington, R. T., Brummer, T. J., et al. (2013a). Stability structures tropical woody plant diversity more than seasonality: insights into the ecology of high legume-succulent-plant biodiversity. S. Afr. J. Bot. 89, 42–57. doi: 10.1016/j.sajb.2013.06.010
Oliveira-Filho, A. T., Pennington, R. T., Rotella, J., and Lavin, M. (2013b). “Exploring evolutionarily meaningful vegetation definitions in the tropics: a community phylogenetic approach,” in Forests and Global Change, eds D. A. Coomes, D. F. R. P. Burslem, and W. D. Simonsen (Cambridge: Cambridge University Press), 239–260. doi: 10.1017/cbo9781107323506.012
Pennington, R. T., and Lavin, M. (2016). The contrasting nature of woody plant species in different neotropical forest biomes reflects differences in ecological stability. New Phytol. 210, 25–37. doi: 10.1111/nph.13724
Pennington, R. T., Lavin, M., and Oliveira-Filho, A. (2009). Woody plant diversity, evolution, and ecology in the tropics: perspectives from seasonally dry tropical forests. Annu. Rev. Ecol. Evol. Syst. 40, 437–457. doi: 10.1146/annurev.ecolsys.110308.120327
Pennington, R. T., Lehmann, C. E. R., and Rowland, L. M. (2018). Tropical savannas and dry forests. Curr. Biol. 28, R541–R545.
Pennington, R. T., Prado, D. E., and Pendry, C. A. (2000). Neotropical seasonally dry forests and Quaternary vegetation changes. J. Biogeogr. 27, 261–273. doi: 10.1046/j.1365-2699.2000.00397.x
Pennington, R. T., Richardson, J. E., and Lavin, M. (2006). Insights into the historical construction of species-rich biomes from dated plant phylogenies, neutral ecological theory and phylogenetic community structure. New Phytol. 172, 605–616. doi: 10.1111/j.1469-8137.2006.01902.x
Peterson, A. T., Pape?, M., and Eaton, M. (2007). Transferability and model evaluation in ecological niche modeling: a comparison of GARP and MaxEnt. Ecography 30, 550–560. doi: 10.1111/j.0906-7590.2007.05102.x
Power, S. C., Verboom, G. A., Bond, W. J., and Cramer, M. D. (2017). Environmental correlates of biome-level floristic turnover in South Africa. J. Biogeogr. 44, 1745–1757. doi: 10.1111/jbi.12971
Prentice, I. C., Bondeau, A., Cramer, W., Harrison, S. P., Hickler, T., Lucht, W., et al. (2007). “Dynamic global vegetation modeling: quantifying terrestrial ecosystem responses to large-scale environmental change,” in Terrestrial Ecosystems in a Changing World, eds J. G. Canadell, D. E. Pataki, and L. F. Pitelka (Berlin: Springer), 175–192. doi: 10.1002/eap.2313
Prentice, I. C., Cramer, W., Harrison, S. P., Leemans, R., Monserud, R. A., and Solomon, A. M. (1992). A global biome model based on plant physiology and dominance, soil properties and climate. J. Biogeogr. 19, 117–134.
Price, M. N., Dehal, P. S., and Arkin, A. P. (2010). FastTree 2 – Approximately maximum-likelihood trees for large alignments. PLoS One 5:e9490. doi: 10.1371/journal.pone.0009490
Prieto-Torres, D. A., Rojas-Soto, O. R., Bonaccorso, E., Santiago-Alarcon, D., and Navarro-Sigüenza, A. G. (2019). Distributional patterns of Neotropical seasonally dry forest birds: a biogeographical regionalization. Cladistics 35, 446–460. doi: 10.1111/cla.12366
Queiroz, L. P. (2006). “The Brazilian Caatinga: phytogeographical patterns inferred from distribution data of the Leguminosae,” in Neotropical Savannas and Seasonally Dry Forests: Plant Diversity, Biogeography, and Conservation, eds R. T. Pennington, G. P. Lewis, and J. A. Ratter (London: CRC Press), 121–158. doi: 10.1201/9781420004496-6
Queiroz, L. P., Cardoso, D., Fernandes, M. F., and Moro, M. F. (2017). “Diversity and evolution of flowering plants of the Caatinga domain,” in Caatinga: The Largest Tropical Dry Forest Region in South America, eds J. M. C. Silva, I. R. Leal, and M. Tabarelli (Cham: Springer), 23–63. doi: 10.1099/ijsem.0.004193
Queiroz, L. P., Lewis, G. P., and Wojciechowski, M. F. (2010). Tabaroa, a new genus of Leguminosae tribe Brongniartieae from Brazil. Kew Bull. 65, 189–203. doi: 10.1007/s12225-010-9202-7
Rapini, A., Bitencourt, C., Luebert, F., and Cardoso, D. (2021). An escape-to-radiate model for explaining the high plant diversity and endemism in campos rupestres. Biol. J. Linn. Soc. 133, 481–498. doi: 10.1093/biolinnean/blaa179
Ricotta, C., Podani, J., and Pavoine, S. (2016). A family of functional dissimilarity measures for presence and absence data. Ecol. Evol. 6, 5383–5389. doi: 10.1002/ece3.2214
Ringelberg, J. J., Zimmermann, N. E., Weeks, A., Lavin, M., and Hughes, C. E. (2020). Biomes as evolutionary arenas: convergence and conservatism in the trans-continental succulent biome. Global Ecol. Biogeogr. 29, 1100–1113. doi: 10.1111/geb.13089
Rocha, P. L. B., Queiroz, L. P., and Pirani, J. R. (2004). Plant species and habitat structure in a sand dune field in the Brazilian Caatinga: a homogeneous habitat harbouring an endemic biota. Rev. Bras. Bot. 27, 739–755. doi: 10.1590/s0100-84042004000400013
Reflora. (2021). Virtual Herbarium. Available online at: http://floradobrasil.jbrj.gov.br/reflora/herbarioVirtual/ (accessed June 04, 2021).
Santos, R. M., Oliveira-Filho, A. T., Eisenlohr, P. V., Queiroz, L. P., Cardoso, D. B. O. S., and Rodal, M. J. N. (2012). Identity and relationships of the Arboreal Caatinga among other floristic units of seasonally dry tropical forests (SDTFs) of north-eastern and Central Brazil. Ecol. Evol. 2, 409–428. doi: 10.1002/ece3.91
Särkinen, T. E., Iganci, J. R. V., Linares-Palomino, R., Simon, M. F., and Prado, D. E. (2011). Forgotten forests – issues and prospects in biome mapping using seasonally dry tropical forests as a case study. BMC Ecol. 11:27. doi: 10.1186/1472-6785-11-27
Scarano, F. R. (2002). Structure, function and floristic relationships of plant communities in stressful habitats marginal to the Brazilian Atlantic Rainforest. Ann. Bot. 90, 517–524. doi: 10.1093/aob/mcf189
Scholes, R. J., and Archer, S. R. (1997). Tree-grass interactions in savannas. Annu. Rev. Ecol. Evol. Syst. 28, 517–544. doi: 10.1146/annurev.ecolsys.28.1.517
Schrire, B. D., Lavin, M., and Lewis, G. P. (2005). Global distribution patterns of the Leguminosae: insights from recent phylogenies. Biol. Skr. 55, 375–422.
Segovia, R. A., Pennington, T., Baker, T. R., Souza, F. C., Neves, D. M., Davis, C. C., et al. (2020). Freezing and water availability structure the evolutionary diversity of trees across the Americas. Sci. Adv. 6:aaz5373. doi: 10.1126/sciadv.aaz5373
Silva, A. C., and Souza, A. F. (2018). Aridity drives plant biogeographical sub regions in the Caatinga, the largest tropical dry forest and woodland block in South America. PLoS One 13:e0196130. doi: 10.1371/journal.pone.0196130
Silva-de-Miranda, P., Oliveira-Filho, A. T., Pennington, R. T., Neves, D. M., Baker, R. T., and Dexter, K. G. (2018). Using tree species inventories to map biomes and assess their climatic overlaps in lowland tropical South America. Global Ecol. Biogeogr. 27, 899–912. doi: 10.1111/geb.12749
Simon, M. F., and Pennington, R. T. (2012). Evidence for adaptation to fire regimes in the tropical savannas of the Brazilian Cerrado. Int. J. Plant Sci. 173, 711–723. doi: 10.1086/665973
Simon, M. F., Grether, R., Queiroz, L. P., Skema, C., Pennington, R. T., and Hughes, C. E. (2009). Recent assembly of the Cerrado, a neotropical plant diversity hotspot, by in situ evolution of adaptations to fire. Proc. Natl. Acad. Sci. U.S.A. 106, 20359–20364. doi: 10.1073/pnas.0903410106
Souza-e-Silva, J. L., Cruz-Neto, O., Peres, C. A., Tabarelli, M., and Lope, A. V. (2019). Climate change will reduce suitable Caatinga dry forest habitat for endemic plants with disproportionate impacts on specialized reproductive strategies. PLoS One 14:e0217028. doi: 10.1371/journal.pone.0217028
Stolar, J., and Nielsen, S. E. (2015). Accounting for spatially biased sampling effort in presence-only species distribution modelling. Divers. Distrib. 21, 595–608. doi: 10.1111/brv.12359
The Angiosperm Phylogeny Group, Chase, M. W., Christenhusz, M. J. M., Fay, M. F., Byng, J. W., Judd, W. S., et al. (2016). An update of the Angiosperm Phylogeny Group classification for the orders and families of flowering plants: APG IV. Bot. J. Linn. Soc. 181, 1–20. doi: 10.1111/boj.12385
The Brazil Flora Group [BFG] (2015). Growing knowledge: an overview of seed plant diversity in Brazil. Rodriguesia 66, 1085–1113. doi: 10.1590/2175-7860201566411
Vilhena, D. A., and Antonelli, A. (2015). A network approach for identifying and delimiting biogeographical regions. Nat. Commun. 6:6848. doi: 10.1038/ncomms7848
Wallace, A. R. (1876). The Geographical Distribution of Animals: with a Study of the Relations of Living and Extinct Faunas as Elucidating the Past Changes of the Earth’s Surface. Cambridge: Cambridge University Press.
Wan, Z. (2014). New refinements and validation of the collection-6 MODIS land-surface temperature/emissivity product. Remote Sens. Environ. 140, 36–45. doi: 10.1016/j.rse.2013.08.027
Wan, Z., and Dozier, J. (1996). A generalized split-window algorithm for retrieving land-surface temperature from space. IEEE Trans. Geosci. Remote Sens. 34, 892–905. doi: 10.1109/36.508406
White, F. (1983). The Vegetation of Africa: A Descriptive Memoir to Accompany the UNESCO/ETFAT/UNSO Vegetation Map of Africa. Paris: UNESCO.
Wiegand, T., and Moloney, K. A. (2013). Handbook of Spatial Point-Analysis in Ecology. Boca Raton, FL: CRC Press.
Wiens, J. J., Ackerly, D. D., Allen, A. P., Buckley, L. B., Cornell, H. V., Damschen, E. I., et al. (2010). Niche conservatism as an emerging principle in ecology and conservation biology. Ecol. Lett. 13, 1310–1324. doi: 10.1111/j.1461-0248.2010.01515.x
Williams, J. W., Jackson, S. T., and Kutzbach, J. E. (2007). Projected distributions of novel and disappearing climates by 2100 AD. Proc. Natl. Acad. Sci. U.S.A. 104, 5738–5742. doi: 10.1073/pnas.0606292104
Wilson, A. M., and Jetz, W. (2016). Remotely sensed high-resolution global cloud dynamics for predicting ecosystem and biodiversity distributions. PLoS Biol. 14:e1002415. doi: 10.1371/journal.pbio.1002415
Winters, D. J. (2017). rentrez: an R package for the NCBI eUtils API. R J. 9, 520–526. doi: 10.32614/rj-2017-058
Keywords: biome delimitation, functional diversity, macroecology, phylogenetic diversity, SDTF, species distribution modeling, transition zones, bioregionalization
Citation: Cardoso D, Moonlight PW, Ramos G, Oatley G, Dudley C, Gagnon E, Queiroz LP, Pennington RT and Särkinen TE (2021) Defining Biologically Meaningful Biomes Through Floristic, Functional, and Phylogenetic Data. Front. Ecol. Evol. 9:723558. doi: 10.3389/fevo.2021.723558
Received: 10 June 2021; Accepted: 22 November 2021;
Published: 24 December 2021.
Edited by:
Danilo M. Neves, Federal University of Minas Gerais, BrazilReviewed by:
Thaís Guedes, State University of Maranhão, BrazilAdeline Fayolle, University of Liège, Belgium
Copyright © 2021 Cardoso, Moonlight, Ramos, Oatley, Dudley, Gagnon, Queiroz, Pennington and Särkinen. This is an open-access article distributed under the terms of the Creative Commons Attribution License (CC BY). The use, distribution or reproduction in other forums is permitted, provided the original author(s) and the copyright owner(s) are credited and that the original publication in this journal is cited, in accordance with accepted academic practice. No use, distribution or reproduction is permitted which does not comply with these terms.
*Correspondence: Domingos Cardoso, cardosobot@gmail.com
†ORCID: Domingos Cardoso, orcid.org/0000-0001-7072-2656; Peter W. Moonlight, orcid.org/0000-0003-4342-2089; Gustavo Ramos, orcid.org/0000-0002-4539-394X; Graeme Oatley, orcid.org/0000-0003-0896-9994; Edeline Gagnon, orcid.org/0000-0003-3212-9688; Luciano Paganucci de Queiroz, orcid.org/0000-0001-7436-0939; R. Toby Pennington, orcid.org/0000-0002-8196-288X; Tiina E. Särkinen, orcid.org/0000-0002-6956-3093
‡These authors have contributed equally to this work and share first authorship