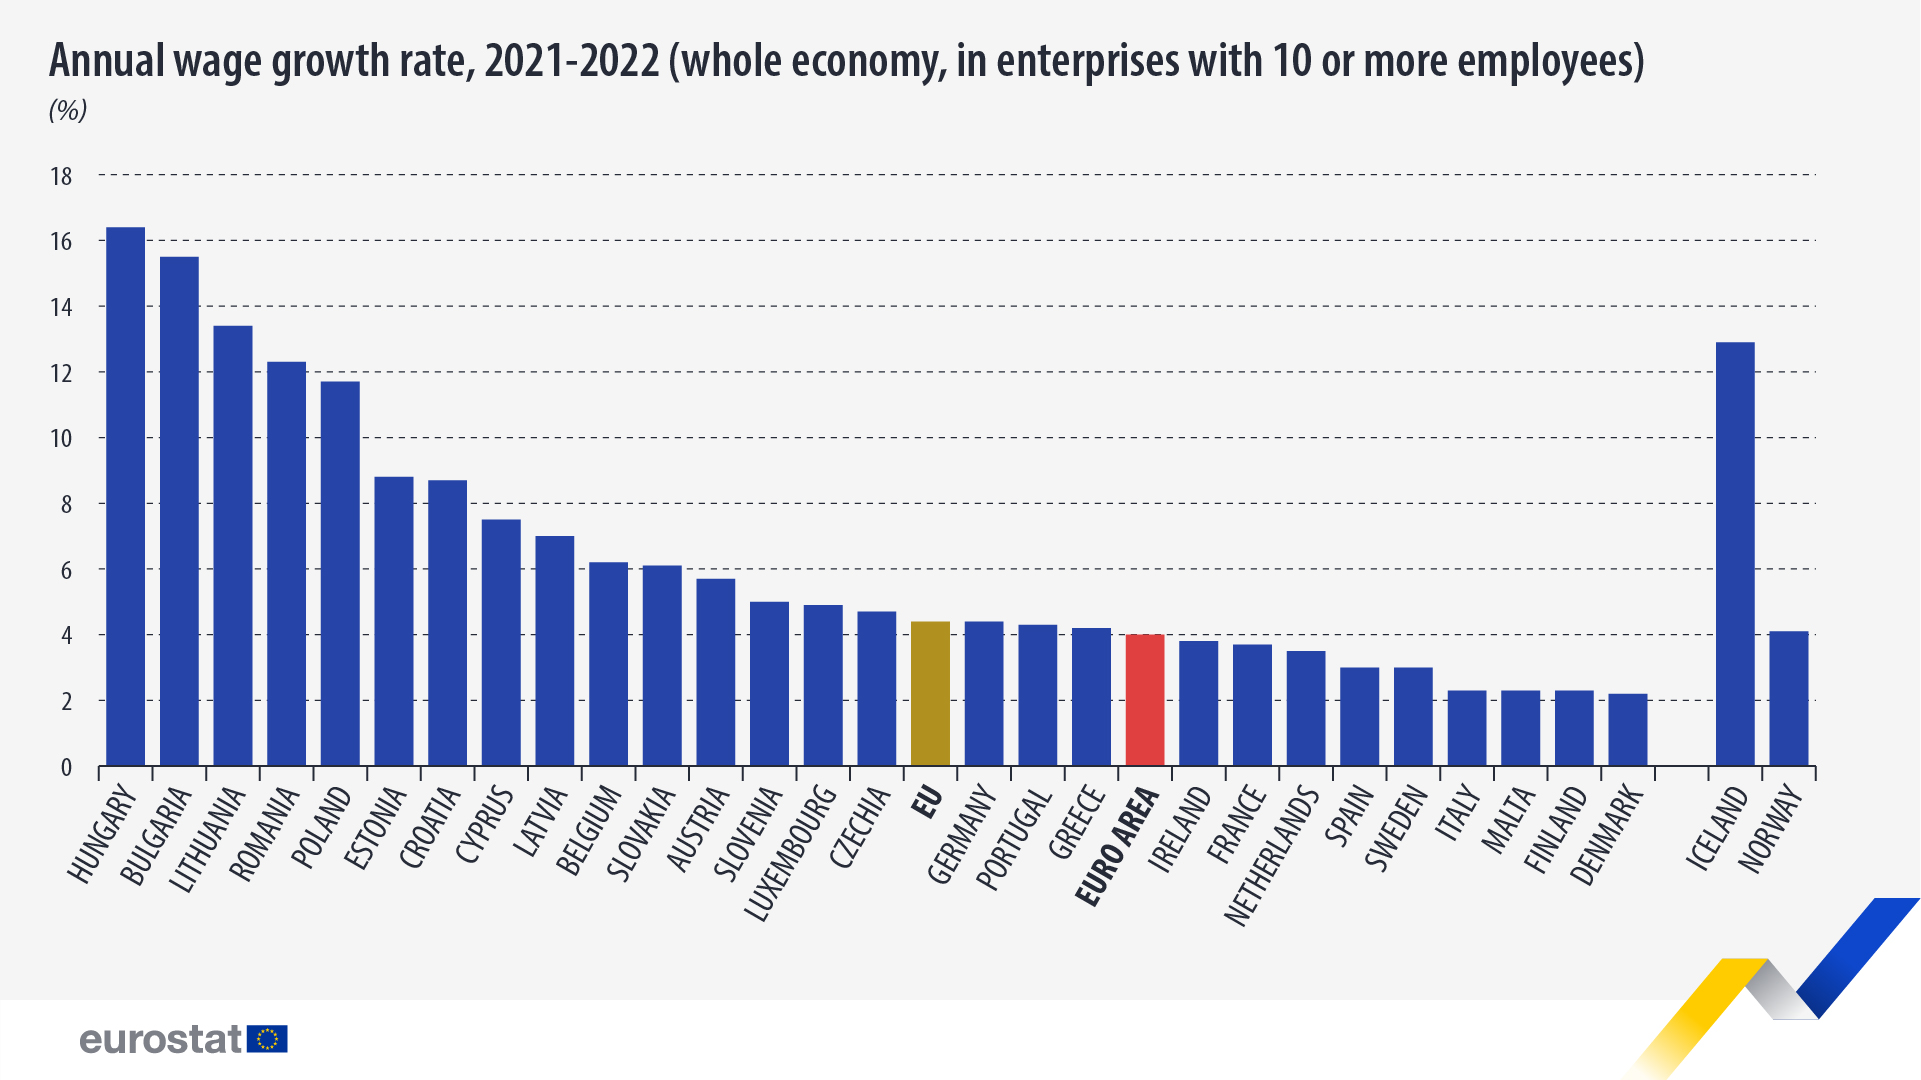
EU hourly wages & salaries increased by 4.4% in 2022

In 2022, the average hourly wages and salaries in the whole economy were estimated to be €22.9 in the EU and €25.5 in the euro area. Compared with 2021, they increased by 4.4% in the EU and by 4.0% in the euro area.
Within the euro area, hourly wages and salaries grew among all members. They increased the least in Italy, Malta and Finland (+2.3% each) and the most in Lithuania (+13.4%), Estonia (+8.8%) and Croatia (+8.7%).
For EU countries outside the euro area, the hourly wages and salaries expressed in national currency also increased in all countries. They increased the least in Denmark (+2.2%) and Sweden (+3.0%) and the most in Hungary (+16.4%), Bulgaria (+15.5%), Romania (+12.3%) and Poland (+11.7%).
Breakdown by economic activity
In 2022, compared with 2021, hourly wages and salaries in the euro area rose by 2.9% in the (mainly) non-business economy and by 4.4% in the business economy: +3.9% in industry, +4.9% in construction and +4.5% in services. In the EU, hourly wages and salaries grew by 3.2% in the (mainly) non-business economy and by 4.9% in the business economy: +4.6% in industry, +5.2% in construction and +5.0% in services.
In the EU, the economic activities that recorded the highest annual increases in hourly wages and salaries in 2022 were: NACE Rev. 2 section B – ‘Mining and quarrying’ (+9.6%), followed by NACE Rev. 2 sections M – ‘Professional, scientific and technical activities’ (+6.4%), D – ‘Electricity, gas, steam and air conditioning supply’ and K – ‘Financial and insurance activities’ (both +5.6%).
Source dataset: lc_lci_lev
For more information
- Statistics Explained article on hourly labour costs
- Thematic section on labour costs
- Database on hourly wage
- Statistics 4 beginners on the labour market
Methodological notes:
- Wages and salaries include direct remunerations, bonuses, and allowances paid by an employer in cash or in kind to an employee in return for work done, payments to employees’ saving schemes, payments for days not worked and remunerations in kind such as food, drink, fuel, company cars, etc.
- In this news article, the whole economy includes all NACE Rev.2 economic activities except sections: ‘A - Agriculture, forestry and fishing’, ‘O - Public administration and defence; compulsory social security’, ‘ T - Activities of households as employers; undifferentiated goods - and services - producing activities of households for own use’ and ‘U - Activities of extraterritorial organisations and bodies’. The data on wages and salaries presented cover enterprises with 10 or more employees (including apprentices).
- Estimates of the wages and salaries levels are obtained by extrapolating the 2020 Labour Cost Survey (LCS) hourly wages expressed in national currencies using the quarterly Labour Cost Index (LCI) transmitted by the Member States. For countries outside the euro area, average annual exchange rates have been used to calculate monetary estimates in euro and derive European aggregates, LCI data were not adjusted for calendar effects, except for Denmark, Sweden, Iceland and Norway, where only calendar-adjusted data are available.
- The discrepancies between the evolutions quoted and the wage growth rates derived from the wage levels published in the dataset lc_lci_lev are due to rounding.
- Austria, Spain, Finland and Iceland: data on hourly wages are taken from national sources.
- Croatia: estimates are based on the 2016 Labour Cost Survey.
If you have any queries, please visit our contact us page.

