HMRC issue briefing: calculating the 2016 to 2017 tax gap
Published 14 June 2018

© Crown copyright 2018
This publication is licensed under the terms of the Open Government Licence v3.0 except where otherwise stated. To view this licence, visit nationalarchives.gov.uk/doc/open-government-licence/version/3 or write to the Information Policy Team, The National Archives, Kew, London TW9 4DU, or email: psi@nationalarchives.gov.uk.
Where we have identified any third party copyright information you will need to obtain permission from the copyright holders concerned.
This publication is available at https://www.gov.uk/government/publications/issue-briefing-calculating-the-2016-to-2017-tax-gap/hmrc-issue-briefing-calculating-the-2016-to-2017-tax-gap
1. What is the tax gap?
The tax gap measures the difference between tax due and tax paid to HMRC.
HMRC looks across both direct and indirect taxes to calculate the tax gap. These include Income Tax, VAT, Corporation Tax, Inheritance Tax and Capital Gains Tax, as well as excise taxes such as tobacco and environmental taxes such as Landfill Tax.
We also look at the tax gap by customer group and types of behaviour, such as error or evasion, to understand more about the causes of the tax gap.
1.1 Tax gap and percentage of liabilities: tax year 2005 to 2006, to tax year 2016 to 2017
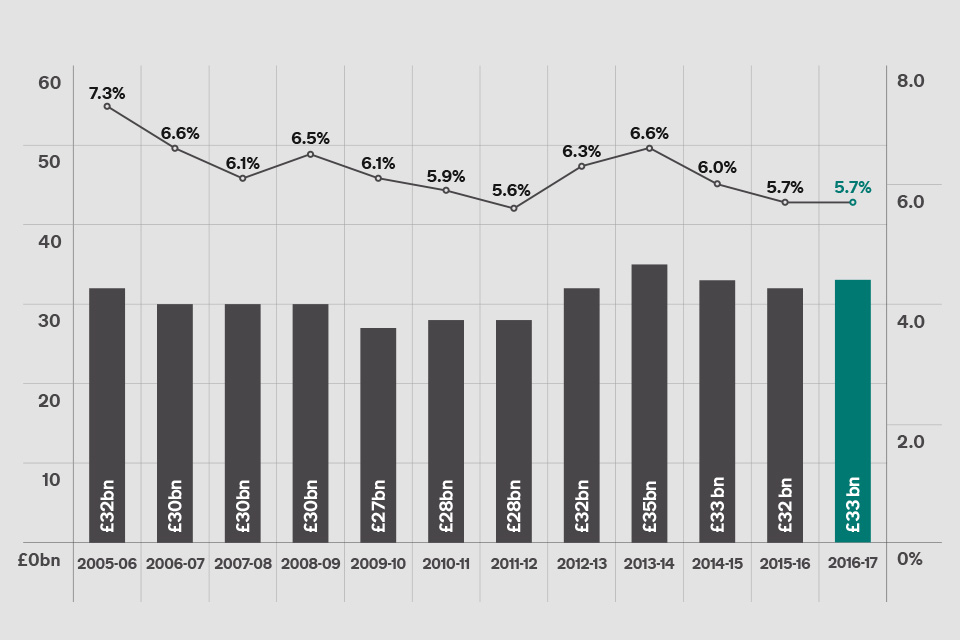
This graph shows the tax gap and percentage of liabilities: tax year 2005 to 2006, to tax year 2016 to 2017.
When comparing over time, it’s more meaningful to measure the tax gap as a percentage of total tax and duties due to HMRC because this is not affected by rate changes or changes in the size of the economy. The cash figure is affected by economic growth and changes to tax rates, whereas the percentage gap takes the impact of these changes into account.
2. Why we measure it
We estimate the tax gap because it provides a useful tool for understanding the relative size and nature of non-compliance. It is impossible to collect every penny of tax owed – for example, we cannot collect taxes from companies that owe tax and are insolvent. We use the data from the tax gap to help determine where we need to do more to help the honest majority to get their tax right and make it hard for the dishonest minority to cheat the system.
We’ve published tax gap figures for every tax year since 2005 to 2006, to show broad trends in compliance and because we believe it’s important to be transparent in our work. We are the only country that does this across both direct and indirect taxes.
The tax gap remains at its lowest level for 5 years. Keeping the tax gap low is a result of our work in helping customers get things right from the start, and our sustained efforts to tackle non-compliance.
3. Latest calculations
We estimate the 2016 to 2017 tax gap is 5.7% of total tax and duties due to HMRC (£33 billion). The percentage tax gap is the same as last year (revised down to 5.7% from 6%) although the cash figure was lower in 2015 to 2016 (£32 billion). The tax gap has reduced from 7.3% in 2005 to 2006 when we first started measuring it.
Reflecting best practice for statistical calculations, we review tax gap estimates each year to reflect updated data and methodology. As in previous years, we are transparent about the reasons for the revisions which are set out in the Measuring tax gaps publication and Methodological annex.
The tax gap figures are calculated after deducting the money we receive that has been voluntarily disclosed to us and money we’ve brought in or recovered as a result of our work.
We have access to data that covers most tax sources, and use illustrative statistics in a consistent way where limited evidence is available. The estimates are produced in accordance with the Code of Practice for Official Statistics, which assures objectivity and integrity.
This year, revisions have been made to the VAT gap estimates as a result of incorporating new and revised data from the Office for National Statistics (ONS) and improvements to HMRC’s methodology. This has resulted in a substantial decrease in the VAT gap across all years from 2005 to 2006, but the overall trend remains the same.
3.1 Customer groups
This is the first year that we are publishing the tax gap broken down by HMRC’s customer groups: large businesses, mid-sized businesses, small businesses and individuals. Criminals are also classified as one of our customer groups.
HMRC adopted the new customer grouping in 2014, segmenting our customers according to type and size, and tailoring our customer services according to their characteristics, capabilities and level of risk they present. The tax gap is now aligned to these groups, but we have also published the estimates for the previous groups (which included small and medium-sized enterprises or SMEs in place of mid-sized and small businesses) for comparison (see our Methodological annex).
Small business customers are responsible for the largest component of the tax gap, making up 41% of the total tax gap (£13.7 billion) in 2016 to 2017, compared to 44% (£14.1 billion) in 2015 to 2016. Large businesses are the next largest component at 21% (£7 billion), compared to 20% (£6.5 billion) the previous year. Mid-sized businesses represent 12% (£3.9 billion) of the tax gap, which was 11% (£3.7 billion) the year before. Finally, individuals make up 10% (£3.4 billion), which was an increase of 1% (£2.9 billion) on the previous year.
Criminals make up 16% (£5.4 billion) of the tax gap in 2016 to 2017, compared to 15% (£5 billion) in 2015 to 2016, and are the third largest component of the tax gap by customer group.
The proportions of the tax gap attributable to each group has stayed relatively stable over time, with the exception of the criminals group which saw a drop in the proportion of the gap. This is due to a reduction over time of tax revenue lost to Missing Trader Intra Community fraud (MTIC). MTIC fraud is an organised criminal attack on the European Union’s VAT system involving traders charging VAT on the onward sale of goods or services which had been acquired VAT-free from EU member states.
3.2 Behaviours
The tax gap can be described as the tax that is lost through a range of behaviours — non-payment, use of avoidance schemes, legal interpretation of the tax effects of complex transactions, error, failure to take reasonable care, evasion, the hidden economy and criminal attacks on the tax system.
Failure to take reasonable care is responsible for 18% of the total tax gap in 2016 to 2017 (£5.9 billion) and is the largest behavioural component of the overall tax gap. This means that failure to take reasonable care, together with error 10% (£3.2 billion), make up £9.2 billion in the total attributable to mistakes. This percentage for both error and failure to take reasonable care remains the same as the previous year, however, the cash value has increased by £1 million in both cases. Failure to take reasonable care has remained relatively stable since 2005 to 2006.
The hidden economy tax gap is estimated at 10% of the total tax gap (£3.2 billion) in 2016 to 2017 compared to 9% (£3.1 billion) in 2015 to 2016. This is an increase from 6% (£2 billion) of the total tax gap in 2005 to 2006.
The term hidden economy refers to taxable economic activity that is entirely hidden from HMRC. This includes undeclared economic activity involving what we call ‘ghosts’ – whose entire income is unknown to HMRC – and ‘moonlighters’ – who are known to us in relation to part of their income, but have other sources of income that HMRC does not know about.
3.3 Support and help for businesses
More than 15 million individual customers are now using Personal Tax Accounts and more than 3 million small businesses manage their tax affairs via a Business Tax Account. These digital accounts allow customers to view and manage their tax affairs online in one place, in as close to real time as possible. They can register for new services, update their personal information and see how much tax they need to pay. This increasingly personalised service provides prompts, advice and support through webchat and secure messaging.
We are also introducing Making Tax Digital which will help to reduce the tax gap by helping to prevent error and failure to take reasonable care. Digital record keeping combined with a modern, more automated tax system will help businesses get their affairs right the first time.
HMRC aims to ensure that the tax system is not a barrier to setting up, running and growing a business. We are working hard to ensure that businesses, small or large, can access the information and support they need, at every stage of their lifecycle and whatever their ambition.
We provide helplines and a wealth of information and guidance via GOV.UK, and webinars to help companies and the self-employed to start up, sustain and grow their business. Our YouTube videos were viewed more than a million times in the last financial year. We’ve also launched an online business forum for small to mid-size businesses as a quick and easy way for them to get answers to their tax questions.
We provide targeted support and guidance for new and start-up businesses and also educate young adults about their tax obligations through our ‘Tax Facts’ learning packages for schools.
3.4 VAT
The VAT tax gap was 8.9% in 2016 to 2017 (£11.7 billion) as a percentage of VAT liabilities. This is a slight increase on the previous year where the gap was 8.4% (£10.6 billion). The VAT tax gap shows a declining trend, falling from 12.5% in 2005 to 2006 (£10.4 billion).
3.5 Corporation Tax
The tax gap for Corporation Tax was 7.4% (£3.5 billion) as a percentage of Corporation Tax liabilities in 2016 to 2017. This compares to 7.3% in 2015 to 2016 (£3.4 billion). There has been a long term reduction in the Corporation Tax gap from 12.4% (£6.1 billion) in 2005 to 2006.
3.6 Self Assessment (Income Tax, National Insurance contributions and Capital Gains Tax)
The overall Self Assessment tax gap was 16.4% (£7.9 billion) as a percentage of Self Assessment liabilities for 2016 to 2017. This compares to 18.4% in 2015 to 2016 (£8.2 billion) and has increased from 15.1% (£4.6 billion) in 2005 to 2006. Business customers (those with self-employment income) are responsible for the majority of the Self Assessment tax gap worth £5.1 billion in liabilities for 2016 to 2017.
3.7 PAYE
The Pay As You Earn (PAYE) tax gap was 1.1% (£2.9 billion) as a percentage of PAYE liabilities in 2016 to 2017. This compares to 1.2% (£3 billion) in 2015 to 2016 and is a reduction from 1.6% (£3.2 billion) in 2005 to 2006. The PAYE tax gap has been falling since 2013 to 2014 coinciding with the introduction of Real Time Information for PAYE in 2013, which led to information on payroll taxes being recorded more accurately and more frequently.
3.8 Alcohol
The total alcohol tax gap was £1.3 billion in 2016 to 2017, of which £900 million was alcohol duty and £400 million was VAT. The alcohol duties tax gap was 7% in 2016 to 2017 compared to 8% the previous year. The alcohol duties tax gap is at the lowest it has been since 2011 to 2012, and has reduced from 11% in 2007 to 2008.
3.9 Tobacco
The tobacco tax gap is made up of the illicit market in cigarettes and hand-rolling tobacco. It is estimated to be £2.5 billion in 2016 to 2017, of which £1.9 billion is tobacco duty and £500 million is VAT. The tobacco duties tax gap was 18% in 2016 to 2017 which compares to 17% in 2015 to 2016, and 22% in 2005 to 2006[footnote 1].
4. Our approach to tackling non-compliance
The best way to tackle non-compliance is to prevent it happening in the first place, while cracking down on the minority who do bend or break the rules. HMRC’s approach involves:
- promoting compliance by designing it into our systems and processes, helping customers get things right from the very start
- preventing non-compliance by using the data we have to spot mistakes, personalise services and support, block fraudulent claims, and automate calculations
- responding by identifying and targeting the areas where there may be tax at risk – and using tough measures to tackle those who deliberately try to cheat the system
Since 2010, the government has invested more than £2 billion in HMRC to tackle evasion, avoidance and non-compliance and announced more than 100 measures to tackle non-compliance in the tax system and aggressive tax planning.
Between 2010 and 2015, the government made more than 40 changes in tax law, closing down loopholes and introducing major reforms to the UK tax system. Since 2015 the government has announced more than 45 further legislative changes to tackle avoidance, evasion and aggressive tax planning. Key changes include:
- ensuring that employers cannot continue to use disguised remuneration schemes to avoid paying Income Tax and National Insurance contributions when paying their staff
- levelling the playing field between property developers based in the UK and those overseas by ensuring that profits from the development of UK land will always be fully subject to UK tax
- coming down hard on enablers of offshore and onshore tax evasion by introducing new criminal offences which make it easier to prosecute corporate organisations and partnerships that fail to prevent their representatives from facilitating evasion
- tackling the hidden economy by extending HMRC’s data-gathering powers to online intermediaries, electronic payment providers, and money service businesses
- introducing a new penalty for those who enable the use of tax avoidance schemes that are later defeated by HMRC
In addition, HMRC has also been working hard to reduce the VAT tax gap by:
- bearing down on organised VAT fraud – the (MTIC) element of the VAT gap held for several years at £500 million to £1 billon and has now reduced to less than £500 million)
- introducing anti-fraud measures - ’joint and several liability’ for online marketplaces holding them liable for any unpaid VAT of overseas businesses who are non-compliant with UK VAT rules, and a ‘domestic reverse charge’ for wholesale telecoms, meaning that VAT is based on where customers are based rather than where the supplier is based
- becoming digital by default – introducing online VAT filing, online VAT registration and Notification of Vehicle Arrivals for vehicles imported into the United Kingdom
These measures are examples of how HMRC is making it harder for people to avoid or evade their taxes.
HMRC’s single departmental plan contains more details on how we are bearing down on tax avoidance and evasion.
HMRC’s full report Measuring tax gaps contains detailed information about the tax gap and how we measure it.
-
HMRC no longer publishes a separate tobacco tax gap report and now incorporates the figures into the main Measuring tax gaps publication. This is to help make the tax gap clearer and easier to understand. ↩