
Virus Watch preliminary findings on 25th January 2021
You can find our most recent results at findings so far.
Virus Watch is a research study run by University College London and the NHS. Virus Watch aims to identify how SARS-CoV-2 spreads, and how to stop it. The findings from the Virus Watch study presented on this page are early, preliminary results and should be interpreted with caution. We are presenting these early findings for participants, the general public and policy makers. No antibody or antigen swab testing results from Virus Watch are included as these parts of the study are not yet fully operational and we are still actively recruiting participants. These early data represent an example of how we will use the results of Virus Watch to identify how SARS-CoV-2 spreads, and how to stop it. A detailed description of the Virus Watch study and our research questions can be found in our study protocol.
Table of contents
- Summary of findings so far
- Interpretation of findings
- Public activities and non-household contacts by Local Area Deprivation during second English national lockdown and December holiday period
- Prevalence of cough, fever and loss or change to sense of smell and/or taste by week
- Symptoms by COVID-19 swab result and UK variant hotspot status
- Characteristics of people in Virus Watch
- Glossary / definitions
1. Summary of preliminary findings so far:
- Virus Watch began recruiting people in June 2020 and as of 25th January 2021, 22,488 households and 45,861 people across England and Wales have joined the study. A total of 572,296 weekly surveys have been completed during the study so far with 30,603 participants completing over 75% of our surveys.
- During the final week of November and the December holiday period (23-27 Dec 2020), participants living in more deprived areas were more likely to: leave their house to go to work or school; use public transport; share a car with a non-household member; visit an essential shop; and have close contact with a non-household/support bubble member than participants living in the least deprived areas. Participants living in more deprived areas were not more likely to undertake social and entertainment activities or visit non-essential shops and services.
- Adults with confirmed COVID-19 were more likely to report cough, fever, and loss or change to smell or taste, as well as several other symptom groups, including nose or throat, gastrointestinal, and eye symptoms when compared to people with illnesses that tested negative for COVID-19. Across all age groups, the most discriminating symptom appeared to be loss or change to smell or taste.
- Children with COVID-19 were less likely than adults to meet the Covid-19 case definition used by Test and Trace. It was also harder to distinguish COVID-19 from other illnesses in children than in adults.
- There was no difference observed in the profile of symptoms of COVID-19 cases more likely to be caused by the new UK variant, compared with cases less likely to be caused by the new UK variant.
2. Interpretation of findings
Our findings suggest that differences in essential daily activities are likely to be contributing to higher infection rates in more deprived regions. People living in the most deprived areas of England and Wales were more likely to leave their house for work or school, use public transport and visit an essential shop (e.g. a grocers) compared to people living in the least deprived areas. These differences are likely to reflect circumstances that constrain individual choice, e.g. car ownership, ability to work from home and disposable income. There was no observed difference in activities that are more likely to reflect individual decision making, such as attending non-essential shops or social and entertainment activities.
Our examination of symptoms suggest that differences between confirmed COVID-19 illnesses and non-COVID-19 illnesses are more marked in adults and less so in children. Amongst adults, the symptoms included in the ‘case definition’, the criteria used by NHS Test and Trace to access a COVID-19 test, are much more commonly seen in COVID-19 than non-COVID-19 illnesses, supporting their use. However, this ‘case definition’ was less discriminatory for COVID-19 amongst children. Amongst community cases, the new UK variant does not appear to cause a different symptom profile to previous strains of the virus, though we cannot yet tell if there is any difference in the severity of symptoms caused by the new variant.
3. Public activities and non-household contacts by Local Area Deprivation during second English national lockdown and December holiday period
More deprived communities have been disproportionately impacted by the health, social and economic effects of the COVID-19 pandemic. Greater day-to-day exposure to people outside of their household and/or support bubble (e.g. lesser ability to work from home, greater dependence on public transport, etc) may be driving higher infections, hospitalisations and deaths in deprived areas.
We investigated whether activities during the final week of the second English national lockdown (24 Nov 2020 – 01 Dec 2020) and the December holiday period (23 Dec 2020- 27 Dec 2020) differed by local area deprivation (English or Welsh Office for National Statistics’ Index of Multiple Deprivation quintile). We performed our analyses to account for differences in participants’ age, sex and region (please see this link for detailed methodology) and compared self-reported activities by levels of deprivation.
Figure 1 shows that at the end of the second national lockdown (between 24 November 2020 and 01 December 2020) we found that compared to people in the least deprived areas of England and Wales, those living in the most deprived areas were:
- 74% more likely to share a car with someone outside of their household or support bubble
- 318% more likely to have used public transport
- 9% more likely to go to work or education outside of the household
- 4% more likely to visit an essential shop
- 6% more likely to have had close contact with non-household/support bubble members
Similarly, Figure 2 shows that during the December holiday period (between 23-27 December 2020) we found that compared to people in the least deprived areas, participants in the most deprived areas were:
- 96% more likely to share a car with someone outside of their household or support bubble
- 529% more likely to have used public transport
- 19% more likely to go to work or education outside of the household
- 9% more likely to visit an essential shop
- 17% more likely to have visited a healthcare setting
- 19% more likely to have had close contact with non-household/support bubble members
There were no observable differences by deprivation (beyond those expected due to random chance) for social and entertainment activities or visiting non-essential shops or services during either time period. For the percentages of reported activities by IMD and the total number of respondents please see this link.
Public transport use was particularly high in London and therefore we further investigated reported use by age and deprivation for London (Figure 3). A higher proportion of adult participants in the most deprived areas reported public transport use, with the proportion decreasing as level of deprivation decreased.
Figure 1. Relative risk of self-reported activities by deprivation (24 Nov 2020 – 01 Dec 2020) – adjusted for age, sex, and region


Notes:
- All results are provisional and subject to revision.
- Terms used in these figures are defined in the glossary of terms and definitions.
Figure 2. Relative risk of self-reported activities by deprivation (23 Dec 2020 – 27 Dec 2020) – adjusted for age, sex, and region
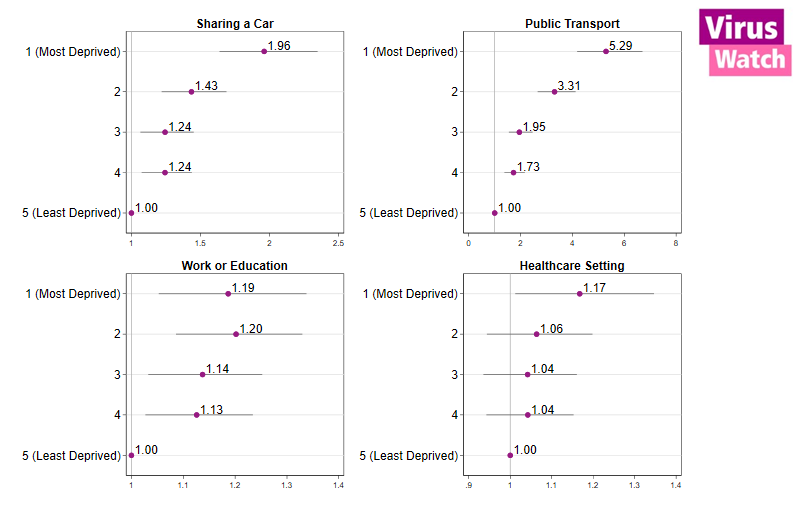

Notes:
- All results are provisional and subject to revision.
How to read these figures: The dots and corresponding numbers for each deprivation quintile give the relative risk, with the horizontal lines giving the 95% confidence intervals. If the relative risk is >1 and the confidence intervals do not cross 1, then this means that participants in this deprivation quintile are more likely to report an activity than those in the least deprived quintile. If the relative risk is <1 and and the confidence intervals do not cross 1, then participants in that group are less likely to report the activity than those in the least deprived group. If the confidence intervals cross 1, then there is no difference between this group and the least deprived group beyond that expected due to random chance. For example, the public transport relative risk in Figure 5 is 5.29 for the most deprived group – i.e. they are about 529% more likely to report using public transport compared to the least deprived group. Confidence intervals above 1 indicate this is unlikely to be due to random chance.
*support bubble member(s) explicitly added to second survey
Figure 3. Proportion of individuals, stratified by age category and index of multiple deprivation (IMD Quintile), in London that reported using public transport during 24 Nov 2020 – 01 Dec 2020 (1) and 23 Dec 2020- 27 Dec 2020 (2).

4. Prevalence of cough, fever and loss or change to sense of smell and/or taste by week
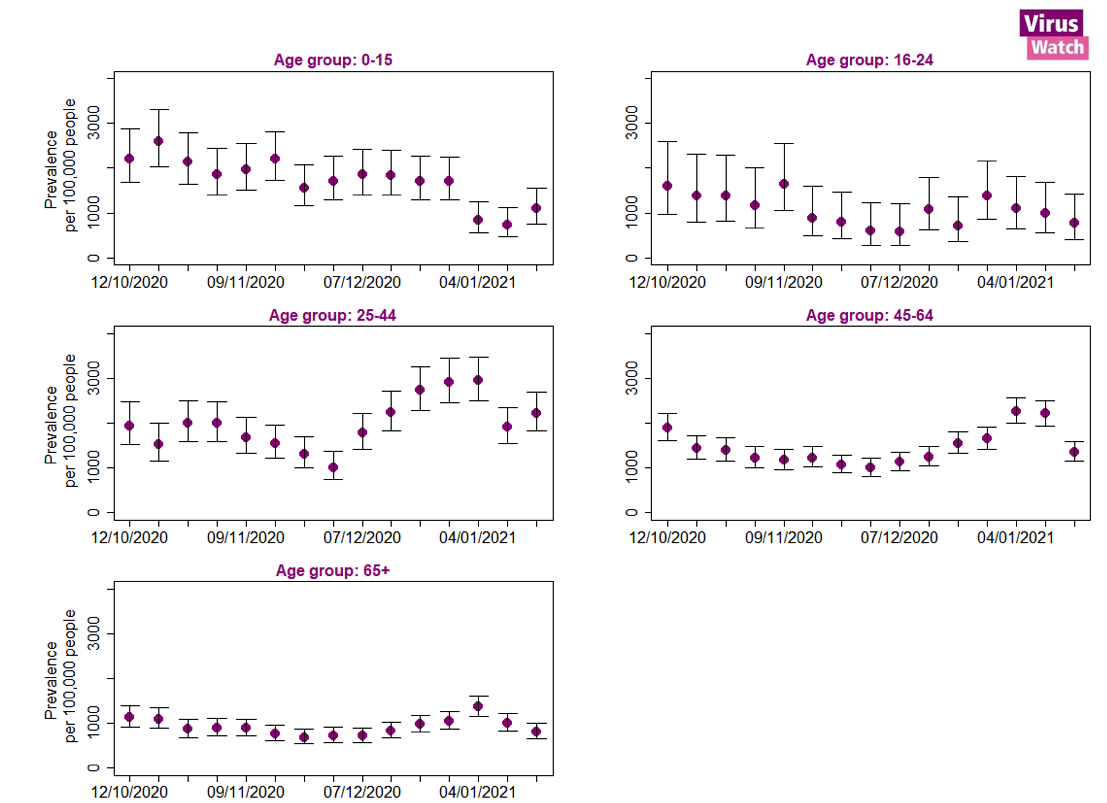
The prevalence of cough, fever and loss or change to sense of smell and/or taste across all age groups was highest in the week beginning 21st September 2020 at 3,795 per 100,000 (95% confidence intervals: 3,500 – 4,114; Figure 4). The peak seen in the week commencing 21st September 2020 coincides with a large number people testing positive for Rhinovirus in the Public Health England data mart surveillance results (see Figure 13 in this Public Health England report), suggesting this peak in symptoms of cough, fever and loss or change to sense of smell was likely driven by Rhinovirus and not SARS-CoV-2 (the virus responsible for COVID-19). After declining from this peak, the prevalence of these symptoms began to increase again from 30th November 2020 and peaked on 4th January 2021 at 1,855 per 100,000 (95% confidence intervals: 1,711 – 2,011; Figure 5). The peak in the week commencing 4th January 2021 was highest in the 25-44 year old age groups at 2,947 per 100,000 (95% confidence intervals: 2,493 – 3,479; Figure 3).
Figure 4. Weekly prevalence of cough, fever and loss or change to sense of smell and/or taste per 100,000 people with 95% confidence intervals.
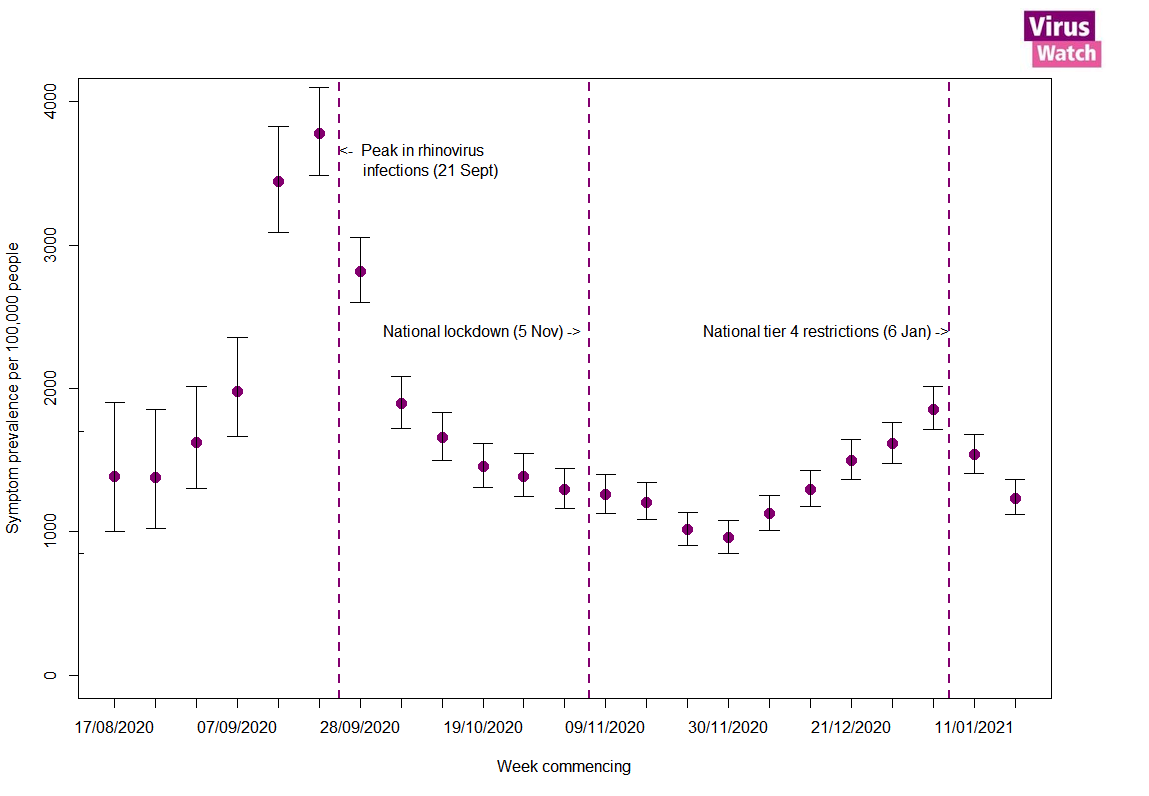
Figure 5. Weekly prevalence of cough, fever and loss or change to sense of smell and/or taste per 100,000 people by age group with 95% confidence intervals.
Notes:
- All results are provisional and subject to revision.
- These statistics refer to symptoms reported by Virus Watch participants in the community.
- Weekly prevalence rates used in these figures were calculated using the total number of people reporting to Virus Watch each week as the denominator, and the number of people reporting symptoms of cough fever and loss of smell or taste as the numerator.
- The date range in Figure 3 is different to Figure 2 in order to focus on the typical ‘cold and flu season’ to see the trends more clearly.
We excluded data from the first week of reporting for all participants.
5. Symptoms by COVID-19 swab result and UK variant hotspot status.
We explored differences in the symptoms of COVID-19 versus non-COVID-19 illness (determined through self-reported swab test results), both overall and by age group. We also explored whether COVID-19 illnesses in hotspots with high levels of the new UK variant of concern had different symptoms (or symptom groups) to COVID-19 illnesses in non-hotspots (please see this accompanying paper for further methodology details on the analysis presented in this section). Although we cannot tell in this preliminary analysis whether an individual’s COVID-19 illness was caused by the new variant or not, comparing illnesses in hotspot and non-hotspots (determined by time and place) can give us clues as to whether the new variant leads to a different symptom profile.
Our results are based on 18,587 illnesses, of which 4,450 were swabbed, resulting in 682 swab-positive COVID-19 illnesses.
Overall, those with COVID-19 illnesses were more likely than those with non-COVID-19 illnesses to include each of the symptoms and symptom groups investigated (Figure 6). The symptoms most commonly reported by COVID-19 cases were respiratory, nose or throat, cough, and meeting the case definition (cough or fever or loss or change of sense of smell/taste), whereas eye symptoms were least commonly reported. As expected, most illnesses with an associated test result met the NHS Test and Trace case definition, but the percentage was higher for COVID-19 cases (82%) compared non-COVID-19 cases (59%). Conversely, 18% of COVID-19 cases did not meet the case definition, highlighting the fact that some COVID-19 illnesses lack the typical symptoms. These may be under-represented here, as illnesses not meeting the case definition are less likely to receive a test. Although less than half of illnesses reported loss or change to sense of smell or taste it was the most discriminatory symptom group, with COVID-19 cases approximately four times more likely to report this symptom group than non-COVID-19 cases.
Figure 6. Symptoms by COVID-19 swab test result:

Notes:
- All results are provisional and subject to revision.
- Terms used in these figures and symptom lists are defined in the glossary of terms and definitions.
These differences, however, varied by age (Figure 7). Children with COVID-19 were less likely than adults to meet the Covid-19 case definition used by Test and Trace. It was also harder to distinguish COVID-19 from other illnesses in children than in adults. The only discriminatory symptom group was loss or change to sense of smell or taste; nonetheless, this was reported by less than half (45%) of confirmed COVID-19 cases and only 18% of children.
In adults aged 25 years or over, differences between COVID-19 illnesses and non-COVID-19 illnesses were more evident across all symptoms and symptom groups (Figure 8). For these age groups, the most discriminatory symptoms were loss or change to smell or taste, fever, cough, corresponding to the Test and Trace case definition.
Figure 7. Symptoms by COVID-19 swab test result and age group:

Notes:
- All results are provisional and subject to revision.
- Terms used in these figures and symptom lists are defined in the glossary of terms and definitions.
When comparing community COVID-19 illnesses in UK variant hotspots with non-hotspots (Figure 9), there was little difference in the percentage of COVID-19 illnesses reporting each of the symptoms or symptom groups. This suggests that, among community cases, the new U.K. variant is unlikely to cause a different symptom profile to other circulating virus strains. Further analysis is planned to explore the symptom severity of COVID-19 illnesses in hotspot and non-hotspot areas.
Figure 8. Symptoms by new U.K. variant hotspot status (B.1.1.7)

Notes:
- All results are provisional and subject to revision.
- *UK variant of concern hotspots by region and time
- Results are based on 327 COVID-19 cases in hotspot areas and 336 COVID-19 cases in non-hotspot areas.
- Results exclude 19 cases from Wales because of lack of data needed to determine hotspot timing.
6. Characteristics of households and individuals in Virus Watch
Virus Watch began recruiting people in July 2020. On 25th January 2021 there were 22,488 households and 45,861 people taking part in the Virus Watch across England and Wales (Table 1) with a median age of 54. Participants were recruited using a range of methods including sample by post, social media, and SMS messages from General Practices.
A total of 572,296 weekly surveys have been completed by Virus Watch participants and completion and retention of participants has been high (Figure 1) with 30,603 completing over 75% of surveys.
Table 1: Participants in Virus Watch, 25th January 2021

*ONS = Office for National Statistics. ONS data for age and region drawn from Mid-2019 Estimates of the Population for the UK, England, and Wales, Scotland and Northern Ireland (figures for England and Wales). ONS data for household size drawn from Families and Households in the UK 2019 (UK wide estimates).
Figure 9: Count of survey completions by week since start of Virus Watch recruitment in June 2020.

Notes:
- All results are provisional and subject to revision.
- These results exclude participants who did not ever complete a weekly survey (4,419 participants).
7. Glossary / definitions
Terms used in figures 4 and 5 :
- Sharing a car – used a car or taxi with non-household or support bubble* members(s)
- Public transport – any of: bus, overground train or tram, or underground train
- Social/entertainment – any of: attending theatre, cinema, concert or sports event; eating in a restaurant, café or canteen; going to a bar, pub or club; going to a party
- Non-essential shops/ services – non-essential shops or personal care services (inc. hairdresser, barber, nail salon, beauty parlour, or similar location)
- Non-household contacts – face-to-face contact with a non-household or support bubble* member less than a metre away (even if a face-covering or face-mask is worn) or being within 2 metres of an infected person for 15 minutes or more, or travelling in a car or other small vehicle with someone (even on a short journey)
The symptoms and symptom groups we explored in section 5 of this report were:
- Case definition – the UK Test and Trace criteria for COVID-like symptoms, i.e. one or more of the following: cough, fever or feeling feverish, loss or change to sense of smell or taste.
- Cough – any type of cough, including dry or wet cough
- Fever – a high temperature (≥37.8C) and/or ‘feeling feverish’.
- Smell / taste – either a loss of, or change to, sense of smell and/or taste.
- Nose / throat – sneezing, runny nose, blocked nose, sore throat, swollen tonsils, and/or sinus pain.
- Respiratory – cough, loss/change to sense of smell or taste, wheezing, shortness of breath, chest pain on breathing, and the nose and throat symptoms listed above.
- GI – nausea, vomiting, and diarrhoea.
- Eye – red, painful, and/or sticky eyes, and deterioration of vision.