
Virus Watch preliminary findings on 14th May 2021
You can find our most recent results at findings so far.
Virus Watch is a research study run by University College London and the NHS. Virus Watch aims to identify how SARS-CoV-2 spreads, and how to stop it. Findings so far presented on this page are early, preliminary results and should be interpreted with caution as they have not yet been peer-reviewed by scientists external to our research collaborators. We are presenting these early findings for participants, the general public and policy makers. A detailed description of the Virus Watch study and our research questions can be found in our study protocol. Virus Watch began recruiting people in June 2020 and as of 14th May 2021, 24,322 households and 50,774 people across England and Wales have joined the study with a total of 1,057,388 weekly surveys having been completed by Virus Watch participants.
Table of contents
- Summary of findings
- Interpretation of findings
- Antibody responses following first and second doses of AstraZeneca and Pfizer vaccines
- Symptom profiles and accuracy of clinical definitions for COVID-19 in the community
- Prevalence of cough, fever and loss or change to sense of smell and/or taste by week
- Characteristics of people in Virus Watch
1. Summary of findings:
Antibody responses following first and second doses of AstraZeneca and Pfizer vaccines:
- We found that 96.42% of Virus Watch participants were antibody positive 28-34 days after a single dose of a COVID-19 vaccine. This increased to 99.08% 7-14 days after a second vaccine dose.
- Antibody positivity rates rose faster in participants who received the Pfizer vaccine compared to the AstraZeneca vaccine, but by 4 weeks after the first vaccine dose antibody positivity rates were equivalent for both Pfizer and AstraZeneca vaccines.
- We found evidence that antibody levels were lower with increasing age following the first dose of vaccine. They were also lower in people with some long term health conditions including diabetes, heart disease, cancer and those currently on immunosuppressive therapies. However, following a second dose of either the AstraZeneca or the Pfizer vaccine, high antibody levels were observed for nearly all individuals including those with long term health conditions.
Symptom profiles and accuracy of clinical definitions for COVID-19 in the community:
- Common symptoms such as cough, headache, fatigue, muscle aches and loss of appetite occurred early in the course of a COVID-19 illness but were also very common in COVID-19-negative illnesses. Rarer symptoms such as fever or loss or altered sense of smell or taste were often not present but were markedly more common in COVID-19 positive compared to COVID-19 negative cases.
- The current UK definition of COVID-19 (any one of: new continuous cough, high temperature or loss of or change in sense of smell or taste) had a sensitivity and specificity of 81% and 47% respectively for symptomatic COVID-19 compared to 93% and 26% for a broader case definition that also included muscle aches or chills or headache or loss of appetite. On average, cases met the broader case definition one day earlier than the current COVID-19 case definition. 1.7 fold more illnesses met the broader definition than the current case definition.
We have also completed other early analyses which can be found here:
- COVID and occupations. This report shows that many occupations have an increased risk of COVID-19 because of regular work based close contact.
- Serial interval analysis – This report shows that the increased speed of spread of the B.1.1.7 – so called “Kent” strain is not explained by shortening of the serial interval (the time between cases who have infected one another)
- Where did I catch COVID? This report shows that Home, Work and Education are the main places where people caught COVID-19 but that transmission in other settings such as shops is also likely to be important.
You can find our previous findings on the link below.
2. Interpretation of findings
A single dose of the AstraZeneca or Pfizer vaccine leads to high antibody levels in people that have not previously had COVID-19. We observed some differences in antibody levels after the first dose by vaccine type, age, and health conditions. These observed differences in antibody levels highlight the importance of ongoing public health preventative measures such as social distancing for adults who have only had one dose of vaccine, particularly those who are older and more clinically vulnerable. High antibody positivity rates were observed for nearly all individuals after a second dose reinforcing the importance of full coverage of this second dose for the population.
COVID-19 is difficult to distinguish from other respiratory infections and common ailments on the basis of symptoms. Broadening the list of symptoms used to encourage engagement with Test, Trace and Isolate (TTI), could moderately increase the number of infections identified and shorten delays to diagnosis, but would require a large increase in the number of tests needed and in the number of people and contacts who do not have COVID-19 but might need to self isolate whilst awaiting results.
3. Antibody responses following first and second doses of AstraZeneca and Pfizer vaccines
Vaccination constitutes the best long-term solution against COVID-19, but data about antibody responses following first and second doses of AstraZeneca (ChAdOx1) and Pfizer (BNT162b2) vaccines from people in the community are limited, particularly for the AstraZeneca vaccine and in populations with chronic health conditions.
In the UK, the interval between doses has increased from 3-4 weeks to 8-12 weeks, to maximise coverage of the first dose. Therefore, it is also important to understand antibody responses in people that have not previously had COVID-19 after just one dose of the vaccine. We analysed data from adults aged over 18 years from households enrolled in Virus Watch who provided finger prick blood samples and self-reported vaccination status.
8,517 vaccinated participants contributed 13,232 blood samples (8,115 following AstraZeneca, 5,008 following Pfizer), which were tested for Spike (S)-antibodies (See note 2 on Figure 1 for an explanation of what S-antibodies are). S-antibody positivity was 96.42% (95%CI 96, 96.79) at 28-34 days following a single dose, reaching 99.08% (97.8, 99.62) at 7-14 days after a second dose.
S-antibody positivity rates, and S-antibody levels rose more quickly following the first dose of Pfizer vaccine, however, results for Pfizer and AstraZeneca vaccines were equivalent by 8 weeks (Figure 1).
Figure 1. S-antibody positive rates (as per ≥0.8 U/ml cutoff) and S-antibody levels (U/ml) by vaccine type and time since vaccination (blacklines indicate median values).

- All results are provisional and subject to revision.
- S-antibody positivity rates refers to the percentage of samples that were positive for antibodies against a virus protein called ‘Spike’. These antibodies are produced as a result of COVID-19 vaccination or as a result of infection (however we excluded the latter).
- S-antibody level refers to the amount of antibodies to the Spike protein that were detected in each sample on average. A higher level means more antibodies, and we assume this to mean a stronger response to the vaccine.
- We do not yet know what the level of antibodies means for the future risk of infection, and we know that antibodies are not the only component of the immune system. Therefore we cannot say whether those who are negative for antibodies, or those with lower levels of antibodies, are at higher risk of infection.
- BNT162b2 is commonly referred to as the Pfizer vaccine.
- ChAdOx1 is commonly referred to as the AstraZeneca (or Oxford) vaccine.
There was evidence of lower S-antibody levels with increasing age. In partially vaccinated 65-79 year-olds, lower S-antibody levels were observed in men (25.9 vs 42.3 U/ml, p<0.0001), those with a chronic condition (33.0 vs 41.2 U/ml, p<0.0001), diabetes (22.32 vs 36.01 U/ml, p<0.0001), cardiovascular disease (32.1 vs 36.7 U/ml, p=0.0002), or history of cancer (30.1 vs 35.7 U/ml, p=0.0001), particularly those with haematological rather than solid organ cancer (7.48 vs 31.68 U/ml, p<0.0001), and those currently on immunosuppressive therapy (21.7 vs 35.6 U/ml, p<0.0001; Figure 2). Following a second dose, high S-antibody levels (≥250U/ml) were observed for nearly all individuals (Figure 2).
Figure 2: S-positivity rates (as per ≥0.8 U/ml cutoff) and S-antibody levels (U/ml) by obesity, chronic condition, and immunosuppressive therapy status at 28+ days following the first dose and 14+ days following the second dose (all ages; comparator groups in blue; black line indicates median value).

Notes:
- All results are provisional and subject to revision.
- Further details of the conditions in this figure and study methods in the full paper reported here.
Please see this link for our full analysis.
4. Symptom profiles and accuracy of clinical definitions for COVID-19 in the community
People infected with COVID-19 can have no symptoms (asymptomatic infection) or one or more of a range of possible symptoms (symptomatic infection). To help inform testing strategies and prevent transmission, it’s important to understand the patterns, timing and severity of COVID-19 symptoms. We described the profiles of symptoms in the Virus Watch study population symptom profiles and estimated the accuracy of clinical case definitions for COVID-19. All symptoms we asked about were more frequently reported in COVID-19 positive illnesses compared to COVID-19 negative illnesses and were generally more severe and longer lasting.
Amongst COVID-19 positive illnesses, the 10 most commonly reported symptoms in decreasing order of frequency were: fatigue, headache, cough, muscle ache, loss or change to sense of smell or taste, needing to spend extra time in bed, sore throat, difficulties in undertaking daily activities, feeling feverish and sneezing. The percentage showing each symptom by day of illness is shown in figure 3 illustrating both the higher frequency and longer duration of key symptoms in COVID-19 positive and negative cases.
Figure 3. The proportion of COVID positive and COVID negative on a given day of illness within the first three week of illness (Day 1 represents the onset of symptoms).

Notes:
- All results are provisional and subject to revision.
- These statistics refer to symptoms reported by Virus Watch participants in the community.
Individually, cough and some constitutional symptoms including headache, muscle ache and fatigue presented early in illness and had moderate sensitivity and specificity as they were common in both COVID-19 positive and COVID-19 negative illnesses.
In contrast, fever and loss or change to smell or taste presented slightly later in illness and had a lower sensitivity but higher specificity as they were not as common in COVID-19 positive illnesses but were even less common in COVID-19 negative illnesses.
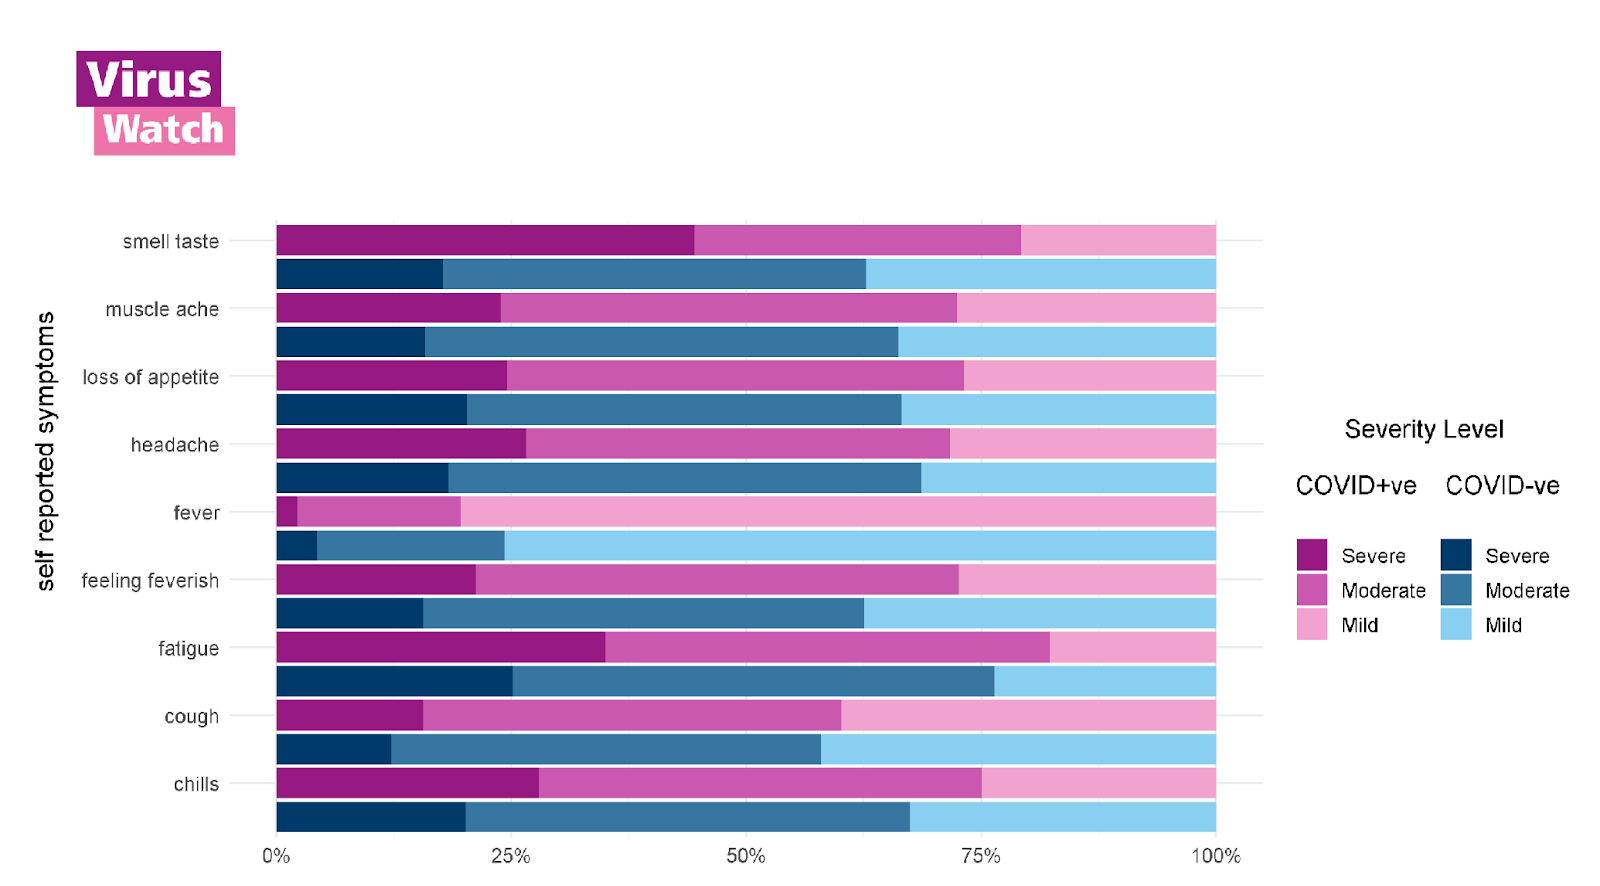
Figure 4 shows the maximum reported severity for a range of key symptoms in COVID-19 positive and negative illnesses. It can be seen that when symptoms do occur, they are more likely to be severe in COVID-19 illnesses than in test negative illnesses.
Figure 4. Severity of symptoms among swab-confirmed COVID positive and negative illnesses reporting the symptom
Notes:
- All results are provisional and subject to revision.
- These statistics refer to symptoms reported by Virus Watch participants in the community.
The combination of symptoms in the current UK TTI case definition had a higher sensitivity (81%) than any individual symptom, with a specificity of 47%. Adding additional symptoms to the case definition can lead to earlier case identification and higher sensitivity but at the cost of specificity and consequently, a substantial increase in the number of illnesses eligible for testing. For example, when we compare the broader case definition to the current UK case definition, cases on average met the case definition one day earlier and there was a moderate increase in sensitivity to 93% but at a much lower specificity of 26%. It would also lead to 1.7 times more illnesses eligible for testing.
Please see this link for our full analysis.
5. Prevalence of cough, fever and loss or change to sense of smell and/or taste by week
The prevalence of cough, fever and loss or change to sense of smell and/or taste across all age groups was highest in the week beginning 14th September 2020 at 3,791 per 100,000 (Figure 2). The peak seen in the week commencing 14th September 2020 coincides with a large number people testing positive for Rhinovirus in the Public Health England data mart surveillance results (see Figures 14 and 15 in this Public Health England report) in the same time period, suggesting this peak in symptoms of cough, fever and loss or change to sense of smell was likely driven by Rhinovirus and not SARS-CoV-2 (the virus responsible for COVID-19).
After declining from this peak, the prevalence of symptoms began to increase again from week commencing 7th December 2020 and peaked on week commencing 28th December at 1,858 per 100,000. A third smaller peak was seen during week commencing 15th March at 1,034 per 100,000, with symptoms highest in the 0-15 year old age group (1,760 per 100,000; Figure 6) which was also associated with an increase in Rhinovirus in the Public Health England data mart surveillance results (see Figures 14 and 15 in this Public Health England report) in the same time period.
Figure 5. Weekly prevalence of cough, fever and loss or change to sense of smell and/or taste per 100,000 people with 95% confidence intervals.

Figure 6. Weekly prevalence of cough, fever and loss or change to sense of smell and/or taste per 100,000 people by age group with 95% confidence intervals.

Notes:
- All results are provisional and subject to revision.
- These statistics refer to symptoms reported by Virus Watch participants in the community.
- Weekly prevalence rates used in these figures were calculated using the total number of people reporting to Virus Watch each week as the denominator, and the number of people reporting symptoms of cough fever and loss of smell or taste as the numerator.
- The date range in Figure 3 is different to Figure 2 in order to focus on the typical ‘cold and flu season’ to see the trends more clearly.
- We excluded data from the first week of reporting for all participants.
6. Characteristics of households and individuals in Virus Watch
Virus Watch began recruiting people in June 2020 and as of 14th May 2021, 24,322 households and 50,774 people across England and Wales have joined the study (Table 1). Participants were recruited using a range of methods including sample by post, social media, letters and SMS messages from General Practices.
A total of 1,057,388 weekly surveys have been completed by Virus Watch. 44,687 of participants have completed at least one weekly survey and 30,167 have completed over 75% of surveys since joining the study (Figure 7).
Table 1: Participants in Virus Watch, 14th May 2021
| Characteristic | All Virus Watch participants on 14th May 2021 | ONS (%)* |
| All | 50,774 | (100%) |
| Age Group | ||
| 0-15 | 6,526 (13%) | (19.1%) |
| 16-24 | 3,174 (6.3%) | (10.6%) |
| 25-44 | 10,500 (21%) | (26.1%) |
| 45-64 | 16,635 (33%) | (25.6%) |
| 65+ | 13,813 (27%) | (18.5%) |
| Missing | 0 (0%) | – |
| Ethnicity | ||
| White British | 34,202 (67%) | (80.5%) |
| White Irish | 602 (1.2%) | (0.9%) |
| White Other | 2,541 (5.0%) | (4.4%) |
| Mixed | 895 (1.8%) | (2.2%) |
| South Asian | 2,673 (5.3%) | (5.3%) |
| Other Asian | 399 (0.8%) | (2.2%) |
| Black | 464 (0.9%) | (3.3%) |
| Other Ethnicity | 261 (0.5%) | (1%) |
| Prefer not to say | 170 (0.3%) | (-) |
| Missing | 8,526 (17%) | – |
| Sex | ||
| Male | 18,880 (37%) | (49.4%) |
| Female | 23,432 (46%) | (50.6%) |
| Missing/Prefer not to say | 8,421 (17%) | – |
| Region | ||
| East Midlands | 4,182 (8.2%) | (4.5%) |
| East of England | 9,431 (19%) | (12.4%) |
| London | 8,431 (17%) | (9.3%) |
| North East | 2,221 (4.4%) | (8.1%) |
| North West | 4,670 (9.2%) | (10%) |
| South East | 8,348 (16%) | (10.5%) |
| South West | 3,149 (6.2%) | (15.1%) |
| Wales | 1,049 (2.1%) | (15.4%) |
| West Midlands | 2,352 (4.6%) | (9.5%) |
| Yorkshire and The Humber | 2,481 (4.9%) | (5.3%) |
| Missing | 4,460 (8.8%) | – |
| Number of householders** | ||
| 1 | 7,755 (15%) | (29.5%) |
| 2 | 21,805 (43%) | (34.5%) |
| 3 | 7,658 (15%) | (15.4%) |
| 4 | 8,827 (17%) | (13.9%) |
| 5 | 3,374 (6.6%) | (4.5%) |
| 6 | 1,369 (2.7%) | (2.1%) |
*ONS = Office for National Statistics. ONS data for age and region drawn from Mid-2019 Estimates of the Population for the UK, England, and Wales, Scotland and Northern Ireland (figures for England and Wales). ONS data for household size drawn from Families and Households in the UK 2019 (UK wide estimates).
Figure 7: Count of survey completions by week since start of Virus Watch recruitment in June 2020.

Notes:
- All results are provisional and subject to revision.
- These results exclude participants who did not ever complete a weekly survey.