Article

Pipeline for Advanced Contrast Enhancement (PACE) of Chest X-ray in Evaluating COVID-19 Patients by Combining Bidimensional Empirical Mode Decomposition and Contrast Limited Adaptive Histogram Equalization (CLAHE)

by
Giulio Siracusano
1,
Aurelio La Corte
1,
Michele Gaeta
2,*,
Giuseppe Cicero
2,
Massimo Chiappini
3,4,* and
Giovanni Finocchio
3,5,*
1
Department of Electric, Electronic and Computer Engineering, University of Catania, Viale Andrea Doria 6, 95125 Catania, Italy
2
Department of Biomedical Sciences, Dental and of Morphological and Functional Images, University of Messina, Via Consolare Valeria 1, 98125 Messina, Italy
3
Istituto Nazionale di Geofisica e Vulcanologia (INGV), Via di Vigna Murata 605, I-00143 Roma, Italy
4
Maris Scarl, via Vigna Murata 606, 00143 Roma, Italy
5
Department of Mathematical and Computer Sciences, Physical Sciences and Earth Sciences, V.le F. Stagno D’Alcontres 31, University of Messina, 98166 Messina, Italy
*
Authors to whom correspondence should be addressed.
Sustainability 2020, 12(20), 8573; https://doi.org/10.3390/su12208573
Submission received: 12 September 2020 / Revised: 5 October 2020 / Accepted: 6 October 2020 / Published: 16 October 2020
(This article belongs to the Special Issue COVID-19: Defense Strategies and Technologies)

Abstract

:
COVID-19 is a new pulmonary disease which is driving stress to the hospitals due to the large number of cases worldwide. Imaging of lungs can play a key role in the monitoring of health status. Non-contrast chest computed tomography (CT) has been used for this purpose, mainly in China, with significant success. However, this approach cannot be massively used, mainly for both high risk and cost, also in some countries, this tool is not extensively available. Alternatively, chest X-ray, although less sensitive than CT-scan, can provide important information about the evolution of pulmonary involvement during the disease; this aspect is very important to verify the response of a patient to treatments. Here, we show how to improve the sensitivity of chest X-ray via a nonlinear post-processing tool, named PACE (Pipeline for Advanced Contrast Enhancement), combining properly Fast and Adaptive Bidimensional Empirical Mode Decomposition (FABEMD) and Contrast Limited Adaptive Histogram Equalization (CLAHE). The results show an enhancement of the image contrast as confirmed by three widely used metrics: (i) contrast improvement index, (ii) entropy, and (iii) measure of enhancement. This improvement gives rise to a detectability of more lung lesions as identified by two radiologists, who evaluated the images separately, and confirmed by CT-scans. The results show this method is a flexible and an effective approach for medical image enhancement and can be used as a post-processing tool for medical image understanding and analysis.

1. Introduction

Non-contrast chest computed tomography (CT) has many advantages over the planar chest X-ray (CXR) such as the better spatial and densitometric resolution and the possibility of a more clear identification of morphologic features of lesions [1]. Although chest CT can provide early diagnosis of COVID-19 pneumonia, it is not sufficient for that purpose considering that it is a specific (COVID-19 pneumonia patterns are similar to the ones of other pneumonia), and the World Health Organization set as the reference standard, in this diagnosis, the transcription-polymerase chain reaction which detects viral nucleic acid [2]. As already discussed in literature, chest CT can be used for the study of COVID-19 progression in patients providing quantitative information [3]. However, this approach needs several scans in a short time window giving rise to additional risks such as an increased possibility of cancer induction, because CT scan can expose a patient to as much radiations as 20–70 chest X-rays (CXR) [4]. In addition, when used for evaluating COVID-19 patients, difficult and time- consuming procedures of decontamination have to be set after each scan, originating either increasing cost for the patient and reducing availability time of the CT. Recent guidelines of the North American Radiology Scientific Expert Panel have assessed that portable CXR has to be considered as the main imaging approach in evaluating COVID-19 patients [5] which not only reduces radiations for patients, but also avoids their transportation. The additional advantage of portable CXR is the possibility to monitor patients in the intensive care units (ICUs) which are more than 5% of the total known cases of COVID-19. Recent clinical studies [6,7] confirm that CXRs can be used in describing some features in COVID-19 patients. The protocol to use CXR for evaluating COVID-19 patients has been set in the Hospital ‘Policlinico G. Martino’ of Messina (Italy) since the beginning of February 2020. In particular, an anteroposterior grey scale CXR in supine position has been acquired for each patient at bed with portable X-ray equipment. Those images are often of low quality for the environment difficulties [8,9,10] as well as for non-collaborative and severely ill patients in most cases [11,12] causing many different artifacts originating inhomogeneities in luminance distribution of radiograms [13]. To overcome these limitations that can impact on diagnostic effectiveness, here we develop a nonlinear post-processing tool, which we named Pipeline for Advanced Contrast Enhancement (PACE) which is aimed at improving the image quality of the CXR as evaluated in terms of contrast improvement index (CII), image entropy (ENT), and the measurement of enhancement (EME).
Other imaging methods such as Optical Coherence Tomography (OCT), Ultrasonography (US) and Magnetic Resonance Imaging (MRI) can be used to study the lungs but with different purposes as compared with CXRs and CTs. OCT has been proposed to potentially replace tissue biopsy for lung cancer diagnosis [14]. US is reliable in diagnosing pleural effusion and pneumothorax but air in the lungs constitutes a barrier for ultrasound. For this reason, US is not as effective as CT in evaluating lung disease [15]. MRI has the advantage of not using ionizing radiation but has a lower spatial resolution than CT. However, MRI faces big difficulties in imaging lungs because air contains few hydrogen atoms. Moreover, molecular oxygen is paramagnetic and causes artifacts at air-soft tissue interfaces (e.g., between lung vessels and alveolar air). In general, MRI is not used for routine lung examination although its specificity in diagnosing mucinous adenocarcinoma has been demonstrated [16,17].

2. Method

Figure 1 shows a block diagram of PACE. As step one, the CXR is processed with the Fast and Adaptive Bidimensional Empirical Mode Decomposition (FABEMD) which decomposes the input image into multiple hierarchical components named bidimensional intrinsic mode functions (BIMFs) and a bidimensional residual image (BR). The residual image is filtered with a Homomorphic Filter (HMF) with a High-Frequency Emphasis Filter (HEF) as kernel function. The CXR is then reconstructed combining the BIMFs with the filtered residual image. The last step of PACE is the use of the Contrast Limited Adaptive Histogram Equalization (CLAHE) to improve the contrast and generate an enhanced CXR (ECXR) image. The performance of the algorithm has been evaluated in 79 patients showing a stable and remarkable improvement on each of the considered metrics (i.e., CII, ENT, EME) against state-of-the-art methods.
To evaluate the clinical impact of the post-processed images, two radiologists have independently analyzed the lung lesions. They have subjectively found in all the enhanced images a clearer definition of the lesions already detectable in the original images and, interestingly, more lesions have been found in 8 cases (>10%). In 3 out of 8 cases, the baseline CXR have been evaluated as negative. The positivity in the enhanced images of those cases has been confirmed by chest CT. This work paves the way for the development of sophisticated post-processing tools to improve the image quality of the cost-effective portable CXR for the monitoring of COVID-19 patients and all patients in the intensive critical unit as well. We argue that this research can be also used as a support of clinical activities either in poor regions where CT is not available and hospitals in developed countries at the peak of the COVID-19 pandemic. In addition, PACE can be used as a tool for preprocessing CXR data or data augmentation in machine/deep learning approaches, such as segmentation and classification, with a possible application in early diagnosis of COVID-19 [18,19,20].

3. Description and Performance Evaluation of the Algorithm

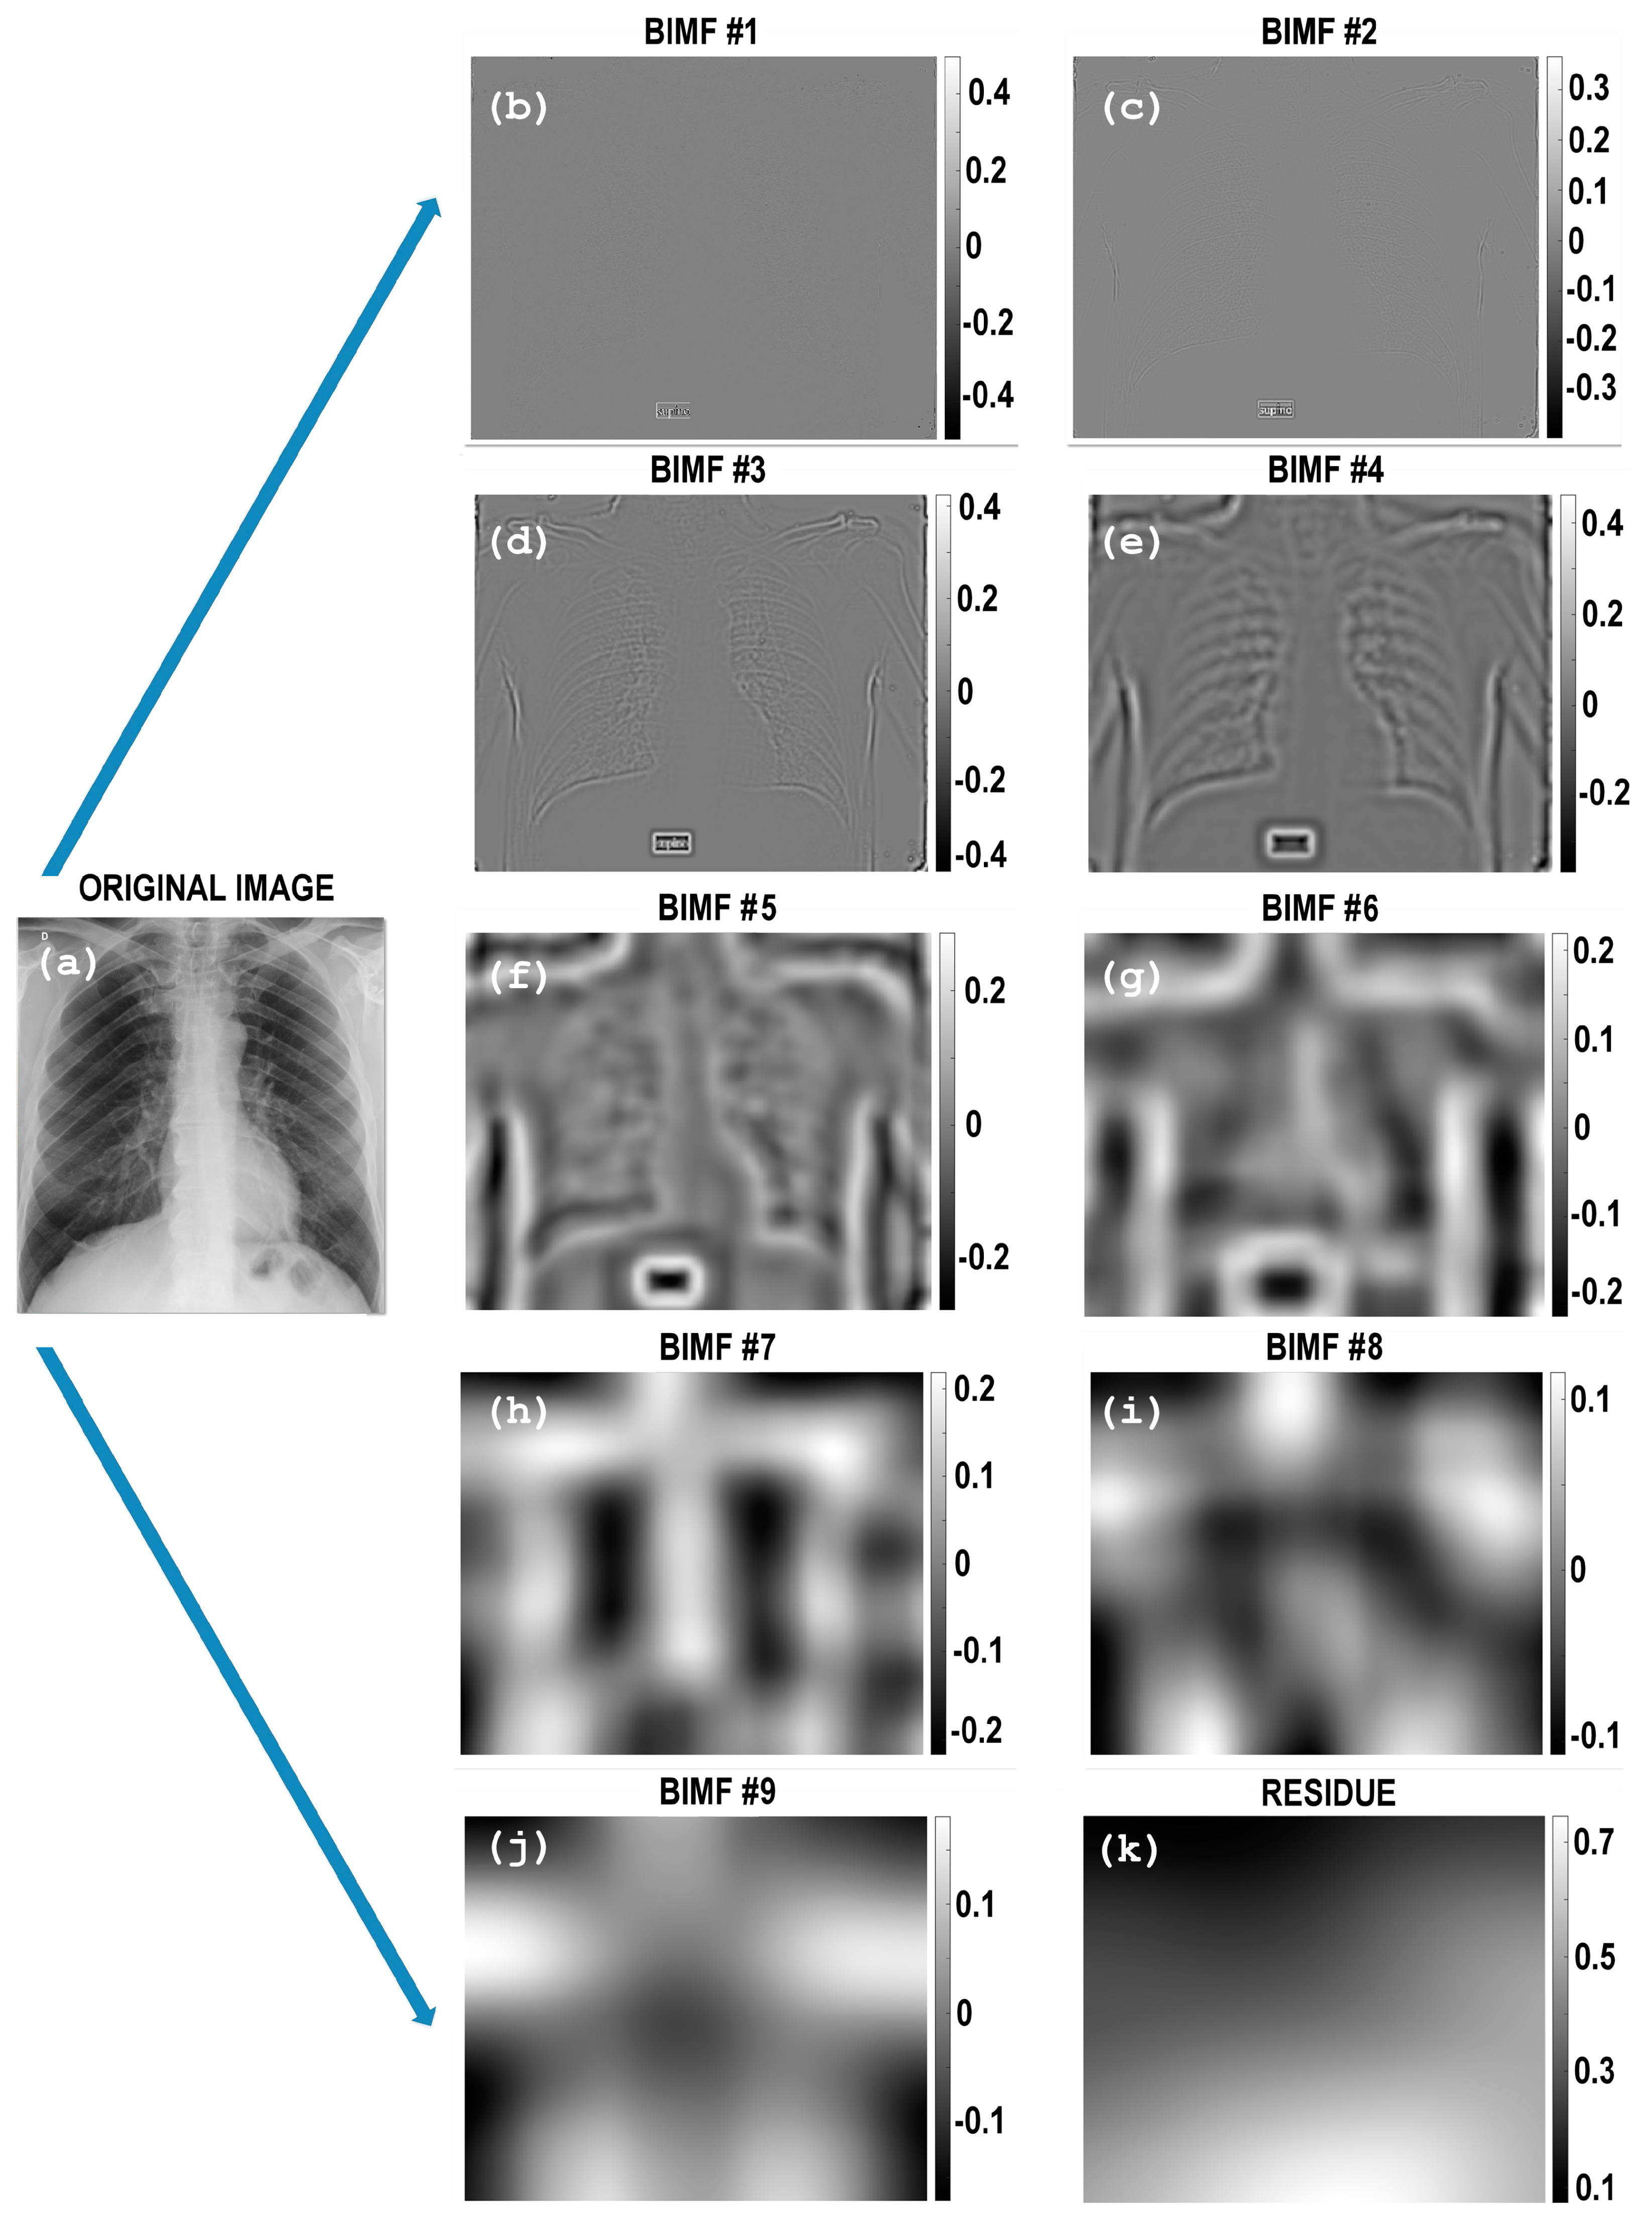
3.1. Fast and Adaptive Bidimensional Empirical Mode Decomposition—FABEMD

The algorithm of FABEMD [21] estimates the intrinsic mode functions (IMFs) in a bi-dimensional space (BIMFs). It uses a variable window order-statistics filter and an iterative procedure to identify a finite number of BIMFs and a BR representing the latent information. The BIMFS are numbered from the faster to the slower ones. Compared to other approaches used to extract the BIMFs, FABEMD is fast because it does not need a recursive approach for the calculation of each IMF [22]. The implementation of FABEMD algorithm can be summarized by the following steps.
Step 1—Local maxima and minima detection
The j-th BIMF λ j of an image S i is obtained by a neighboring window method [22]. The minima and maxima of S i are collected in a 2D matrix A = [ a m , n ] ( m and   n are the row and column respectively) and are obtained by window size w e x × w e x as follows:
a m , n = { l o c a l max   if   a m , n > a k , l l o c a l min   if   a m , n < a k , l
where [21]:
k = m w e x 1 2 : m + w e x 1 2 , ( k m ) l = n w e x 1 2 : n + w e x 1 2 , ( l n )
Step 2—Size of order-statistic filter window calculation
d a d j max and d a d j min are defined to be the adjacent maximum and minimum array distance, respectively. Their values are calculated from each local maximum or minimum point to the nearest nonzero element and then sorted in a descending order. The gross window width is computed as follows:
w max _ e n g = minimum { d a d j max } w max _ e n g = maximum { d a d j max } w min _ e n g = minimum { d a d j min } w min _ e n g = maximum { d a d j min }
Step 3—Application of the order statistics and smoothing filters
The upper and lower envelopes are computed from two functions U E j ( x , y ) and L E j ( x , y ) defined as:
U E j ( x , y ) = max { λ j ( s , t ) } = 1 w s , m × w s , m ( s , t ) Z x , y U E j ( s , t ) L E j ( x , y ) = min { λ j ( s , t ) } = 1 w s , m × w s , m ( s , t ) Z x , y L E j ( s , t )
where Z x , y is a square region having the window size, and w s , m is the window width of the smoothing filter. Equation (4) describes the operation of arithmetic mean filters which is used to smooth local variances. The average envelope is calculated by using the smoothed envelopes U E j and L E j . Therefore, the MAX and MIN filters are collected in a new 2-D matrix for the envelope surface [23].
FABEMD has been used for different purposes in medical imaging [24] including image retrieval [25] and fusion [26,27]. Here, we have used FABEMD to separate the low varying (latent) from high varying components of CXRs with the aim to correct the luminance contributions while preserving the other information. Figure 2 shows an example of the BIMFs as calculated with FABEMD. In order to evaluate the relevance, in terms of information contents, of a BIMF, we have computed its energy E following the approach provided in Ref. [28]. By comparing the BIMFs with the original image, the more informative BIMFs are the panels (d)–(f). In particular, we noted that the edges are well represented on panel (d), the signal is contained in panel (e) while the contrast is mainly in panel (f). On the other hand, the residual image in panel (j), representing the latent information, clearly shows the non-uniform luminance of the original image. Similar results have been also observed for the other images.
We wish to highlight that the meaning of the BIMFs of Figure 2 does not depend on the type of information content of CXR (normal, pneumonia, etc.) and FABEMD extracts, and isolates specific features of the input image such as edges, noise, low and high frequency components, and background. Once this information is coded in the BIMFs, it is possible to filter or perform a selective image reconstruction with the aim to improve the global information of the original image.

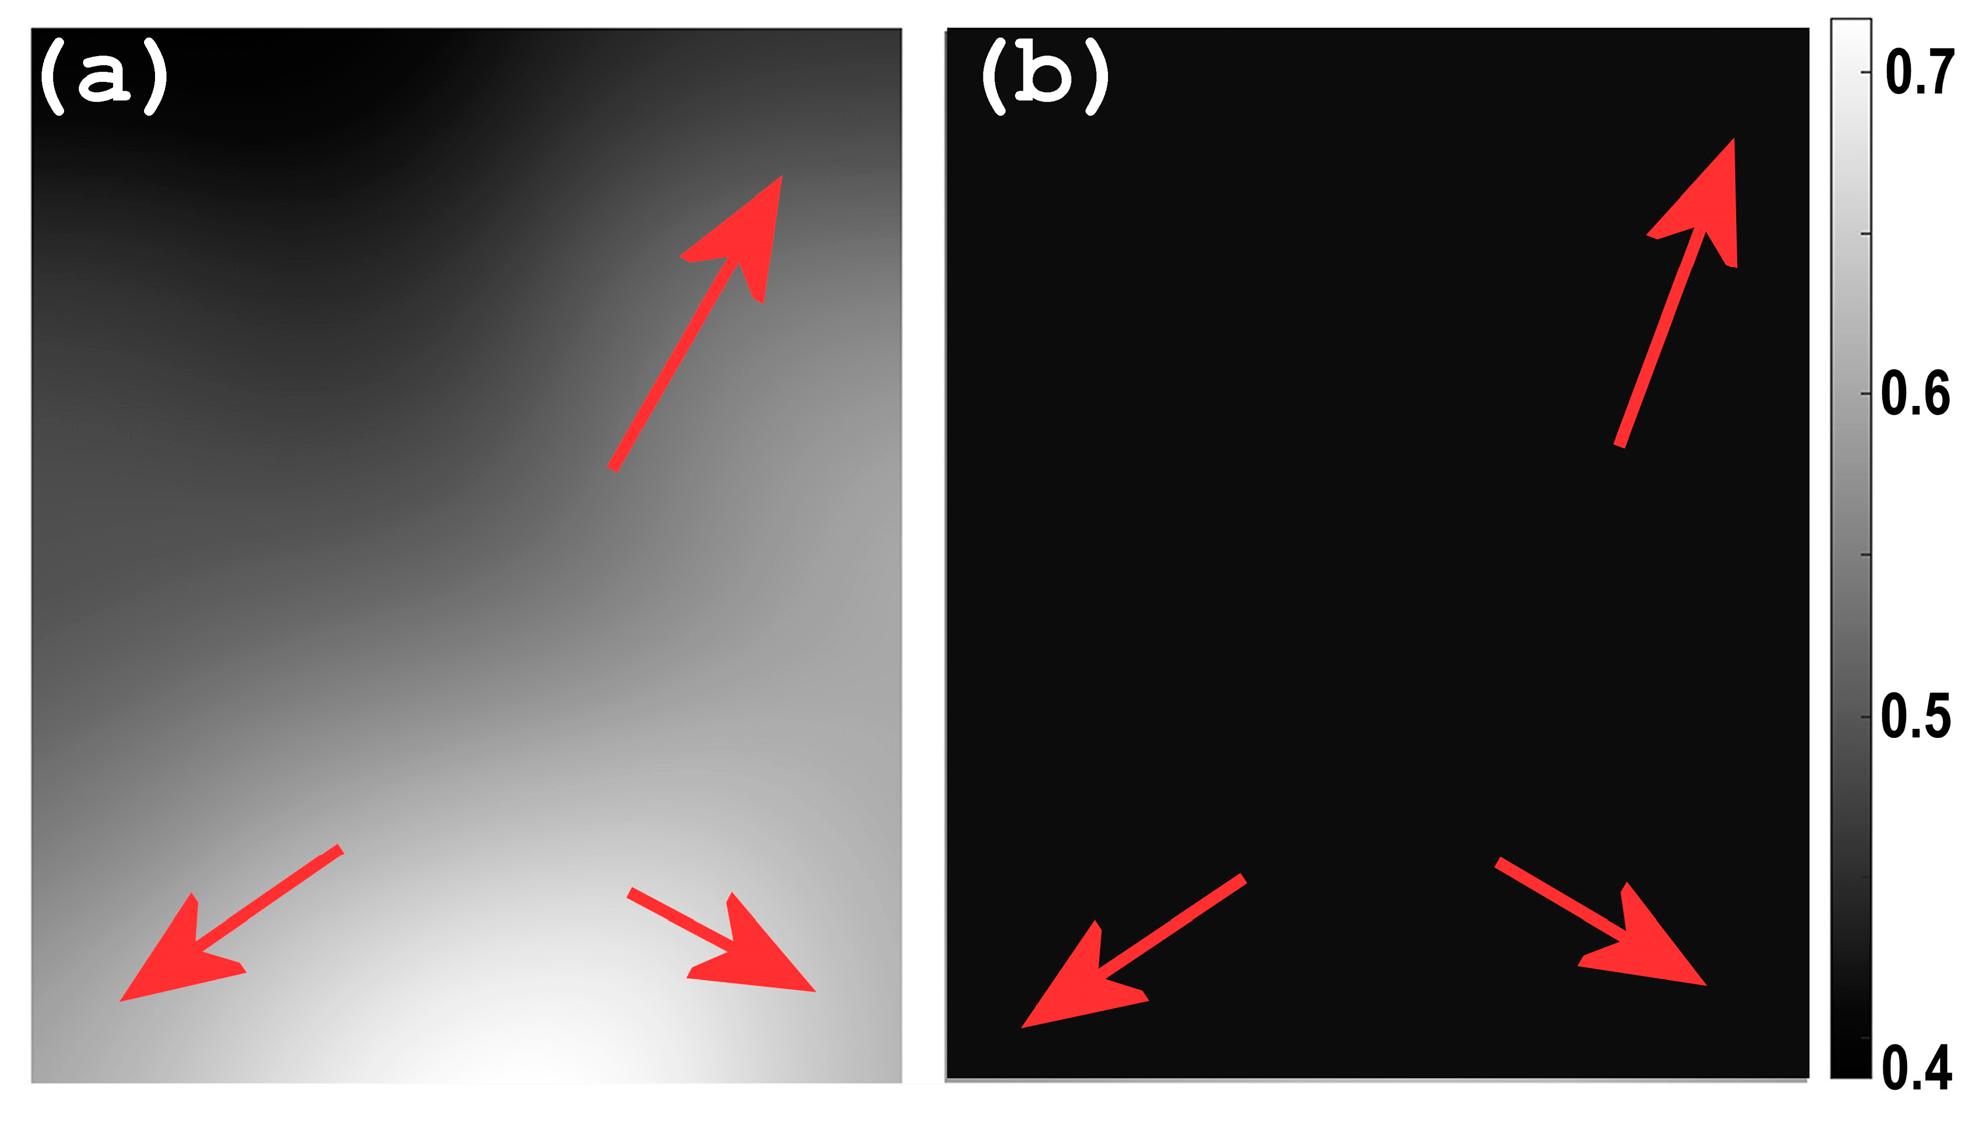
3.2. Homomorphic Filtering—HMF

The log-transformed residual image is then filtered with an HMF— H ( x , y ) for correcting the non-uniform illumination of the CXR [29,30]. We stress one more time that the HMF is used to reduce inhomogeneous effects of CXRs. It is built with a High-Frequency Emphasis Filter (HEF) [13] given by:
H H E F ( x , y ) = g L + g H H ( x , y )
where g L < 1 and g H > 1 , respectively.
From a theoretical point of view, an image I ( x , y ) ((x, y) are the spatial coordinates) can be expressed as a product between reflectance R ( x , y ) of the object or scene and the intensity of the illumination L ( x , y ) , which represents the image noise, I ( x , y ) = R ( x , y ) L ( x , y ) [31]. The undesired effect of L ( x , y ) can be filtered in the log domain considering the log-transformed image Q ( x , y ) [32,33]:
Q ( x , y ) = ln ( I ( x , y ) ) = ln ( R ( x , y ) L ( x , y ) ) = ln ( R ( x , y ) ) + ln ( L ( x , y ) )
and its Fourier Transform (FT) Ω is given by:
Ω ( Q ( x , y ) ) = Ω ( ln ( R ( x , y ) ) ) + Ω ( ln ( L ( x , y ) ) ) = Ω R ( x , y ) + Ω L ( x , y )
where Ω R and Ω L are the FT of ln ( R ( x , y ) ) and ln ( L ( x , y ) ) respectively. The filtered image I ( x , y ) is computed as I ( x , y ) = exp ( w ( x , y ) ) , w ( x , y ) being the inverse FT of the convolution between Q ( x , y ) and H H E F ( x , y ) as
w ( x , y ) = Ω 1 ( W ( x , y ) ) = Ω 1 ( H ( x , y ) Ω R ( x , y ) ) + Ω 1 ( H ( x , y ) Ω L ( x , y ) )
The setting parameters are g L = 0.99 and g H = 1.5 which have been computed by using multi-objective optimization (MOO) [34,35,36]. Figure 3 shows an example of the application of the HMF applied to the BR achieved with the FABEMD algorithm displayed in Figure 2j. In summary, HMF represents the intermediate step in our pipeline and it has been implemented to integrate such filtering process with FABEMD and to prepare the image, via a reconstruction block, for a contrast enhancement achieved by means of CLAHE. The reconstruction block combines the BIMFs with the filtered BR that will be then processed to generate a final single CXR with improved contrast, preserved details and where the illumination inhomogeneities are dramatically reduced.

3.3. Contrast Limited Adaptive Histogram Equalization—CLAHE

CLAHE is a generalization of the Adaptive Histogram Equalization [37]. For a given input image, the algorithm of CLAHE creates non-overlapping contextual regions (also called sub-images, tiles or blocks) and then applies the histogram equalization to each contextual region, clips the original histogram to a specific value and then redistributes the clipped pixels to each gray level. The size of the contextual region or block size (BS) is typically computed at the point where the maximum entropy curvature is achieved [38]. The Clip Limit (CL) for the calculations is 0.01 as suggested in Ref. [39], whereas the BS is empirically determined in 16 × 16 pixels. The redistributed histogram is different from an ordinary histogram because each pixel intensity is limited to a selected maximum. However, either the enhanced image and the original image exhibit the same minimum and maximum gray values. In detail, for enhancing the intensity values in each contextual region, we have used a uniform distribution, because it has demonstrated to provide better results as suggested in Ref. [40]. Finally, the calculation of the new gray-level assignment of the pixels is achieved within a sub-matrix contextual region by using a bi-linear interpolation between four different mappings to eliminate boundary artifacts. CLAHE was already applied for the enhancement of contrast in medical images [30,41,42,43]. Huang proposed CLAHE-DWT (DWT is for discrete wavelet transform) using a combination of CLAHE and DWT to overcome the limitations of CLAHE which faces the contrast overstretching and noise enhancement problems. This aspect is central because bright parts of the image are unnecessary to be enhanced with respect to the dark ones. The proposed approach motivates the proper combination of CLAHE, FABEMD and HMF to exploit both direct component segmentation capabilities of the former and correction benefits of the latter to stabilize and preprocess the image before CLAHE is applied.

3.4. Metrics Definition

Nowadays, specific processing methods are available [44] to enhance image quality for specific applications [45,46]. In order to assess the improvement, different enhancement metrics can be considered [47]. Previous works have demonstrated that the combination of several enhancement techniques is required to improve the overall image quality. In PACE, the improvement is focused on homogeneous contrast, visibility, and image detail as they are the most essential and important factors that are used in detection, recognition, and monitoring of lung lesions especially for COVID-19 patients. With this in mind, we have evaluated performance of PACE, considering as reference metrics the CII, the ENT and EME.

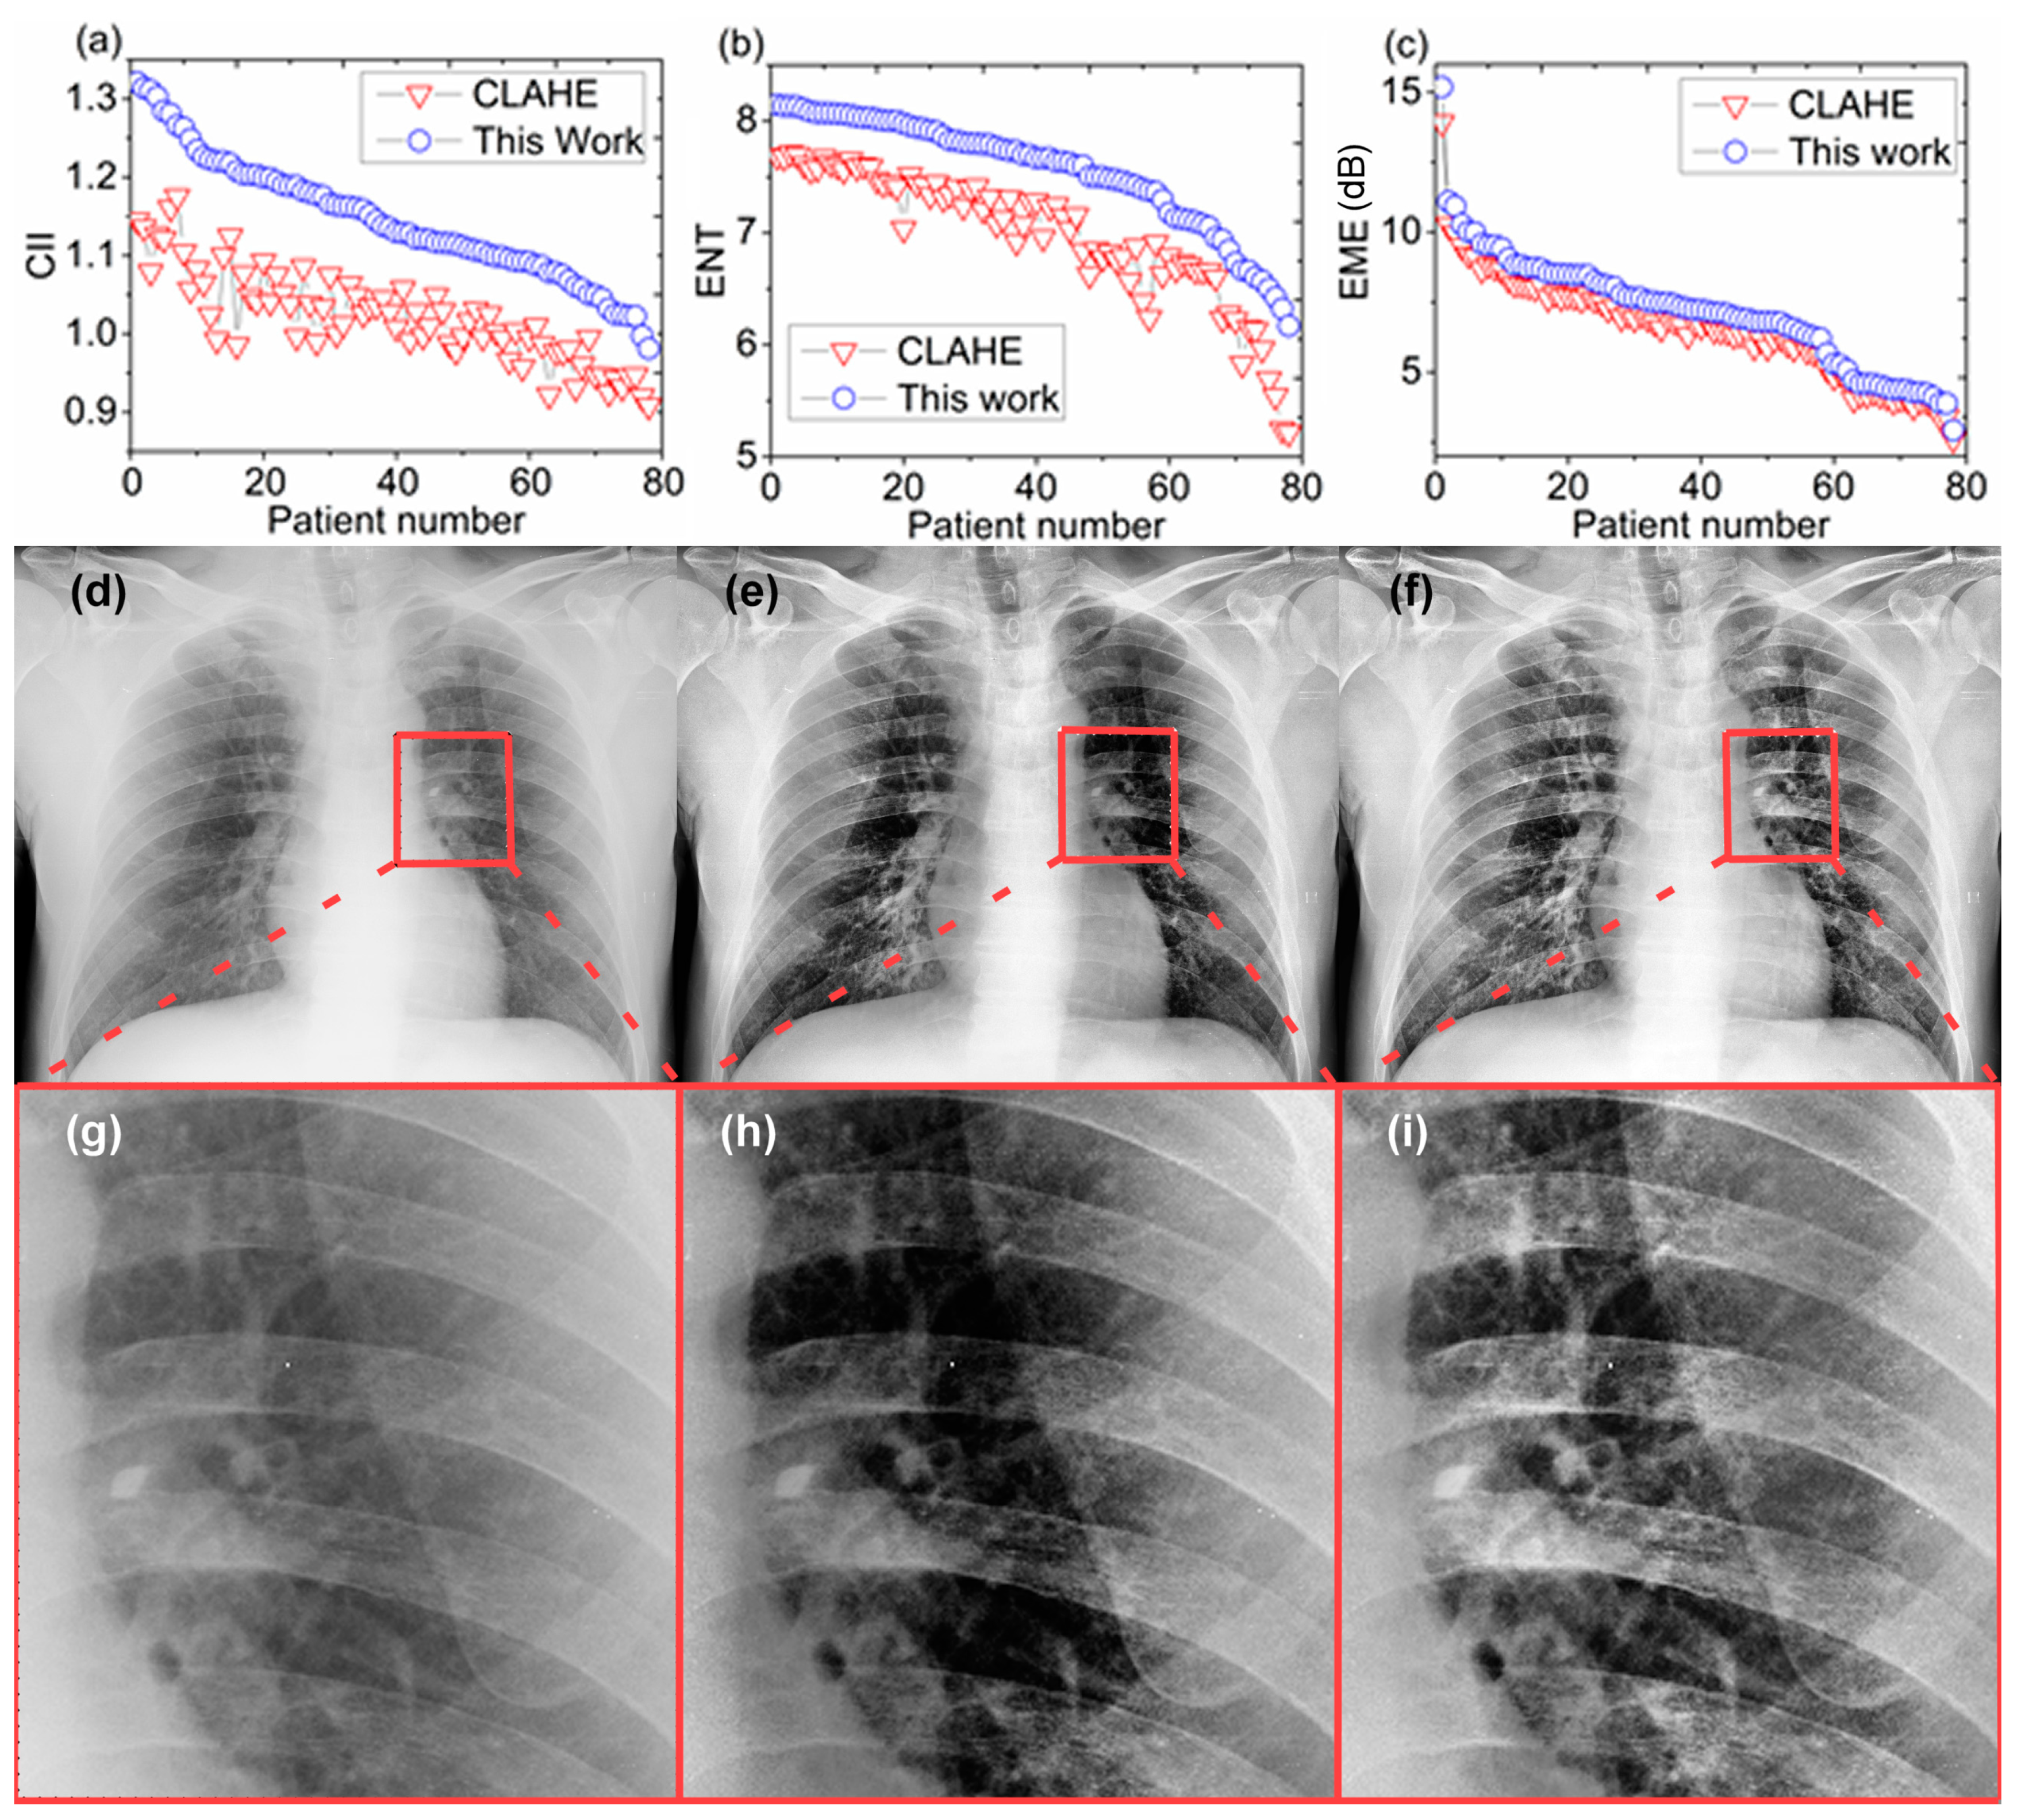
3.4.1. Contrast Improvement Index (CII)

According to the literature, the CII is defined as follows [48]:
C I I = C p r o c e s s e d C r e f e r e n e e
where C p r o c e s s e d and C r e f e r e n c e are the contrast values of the processed and original image, respectively. The contrast C of a region is defined as [47]:
C = k = 0 L 1 ( k m ) 2 p ( k )
p(k) being the probability to have a specific gray-level value.

3.4.2. Entropy—ENT

The entropy, [49] which is a measure of the randomness characterizing the texture of the image, is estimated by the histogram of the image considered as a whole:
E N T = p × ln ( p )
where 𝑝 is the histogram count for an image segment. In general, there are more complex metrics based on entropy such as measure of enhancement by entropy (EMEE) [50]. However, as pointed out in literature by Gupta et al. [51] and Panetta et al. [52], EMEE is suitable for images with attributes like noncomplex segments or small-size complex segments, non-periodic patterns in segments, and randomness because of the inclusion of entropy. EMEE has been suggested for assessing nodule enhancement [53,54] rather than for the evaluation of contrast enhancement in larger areas, which makes EMEE not appropriate for this specific study.

3.4.3. Measure of Enhancement—EME

For an image x ( n , m ) split into r × c blocks of size I 1 × I 2 , EME is defined as [45]:
E M E r c = 1 r × c l = 1 r k = 1 c [ 20 ln ( C R k , l ) ]
where { k , l } represents the block B k , l considered for the calculations, EMErc depends on the image segmentation into r × c blocks and the contrast C R k , l (as calculated in the block B k , l ) is defined as [55]:
C R k , l = I m a x { k , l } I min { k , l } + c
being I m a x and I min are the maximum and minimum intensity levels, respectively, for the image x ( n , m ) inside B k , l . The value c is a small constant which is equal to 0.0001 to avoid dividing by 0. The EME measure is suitable for images with attributes like noncomplex segments (e.g., regular geometrical shapes, like for human body parts), non-periodic pattern in segments, and little to no randomness in segments [55]. In addition, many literatures on contrast enhancement [56,57,58,59] adopted EME as an evaluation indicator including contrast enhancement in mammographic images, [60] or in brain and breast cancer images [55].

4. Results and Discussion

4.1. Evaluation of the Algorithm Performance

To demonstrate the performance of the proposed method, 79 baseline CXR images of COVID-19 patients from the University Hospital ‘Policlinico G. Martino’ in Messina have been analyzed. The original CXR images (3520 × 4280 pixels; 10-bit grayscale; grayscale value is 0–1024, spatial resolution, 0.175 mm/pixel) are subsampled by 4 to reduce the processing time to 1 min per single image. Figure 4a–c provide a quantitative comparison of the metrics discussed in the previous paragraph, (a) CII, (b) ENT, and (c) EME, as computed in images enhanced with CLAHE (red empty triangles) and PACE (blue empty circles) for all the 79 patients. The values are plotted in descending order considering the results of PACE; the same order of images enhanced with CLAHE is used and therefore, those curves (red triangles) are nonmonotonic. An improvement for all the images based on all the three metrics have been obtained. An average increase of 10% in CII, 7.5% in entropy, and 4.7% in EME have been documented.
Figure 4a–c provide a comparison between CLAHE (red triangles) and PACE (solid blue line) considering (a) the contrast index improvement metric, (b) the image entropy, and (c) the measure of enhancement. The metrics are computed on a dataset of 79 baseline CXR images from COVID-19 patients, and the values have been ordered via descending order considering the results achieved with PACE. The three metrics show the better performance of PACE over CLAHE.
A visual example of a CXR enhancement, acquired with the portable X-ray equipment, is shown in Figure 4d–f, where the original CXR (panel (d)), post-processed with CLAHE (panel (e)) and with the approach proposed here (panel (f)) are displayed, respectively. To better show the improvement, Figure 4g–i provide a magnified region for evaluating a specific part of the images.
The performance of PACE has been also benchmarked in a public database (https://github.com/ieee8023/covid-chestxray-dataset) [61] showing an average increase of 9% in CII, 2.4% in ENT, and 2% in EME.
Recent research contributions for X-ray image enhancement [62,63,64,65] worthwhile to be mentioned, and their similarities and differences are highlighted in the following pages. In Reference [62], the method uses image fusion and filtering/sharpening techniques to resolve problems such as noise and blurriness in degraded X-ray images. We do not use image fusion because this study was originally conceived for COVID-19 patients whose conditions (especially in the ICUs) are such that it is very difficult to have consecutive CXRs to be used for fusion. On the other hand, we do consider a filtering stage in our processing pipeline to correct for brightness inhomogeneities by using Homomorphic Filtering. In Ref. [63], Fruit fly optimization algorithm is used to optimize a fuzzy enhancement algorithm for medical image enhancement. Differently from this approach, we have used Multi-Objective Optimization (MOO) to achieve optimization of the filtering parameters that are used into the HMF stage of the processing pipeline. Furthermore, we compared our results using standard metrics (CII, ENT and EME) and we used a larger dataset of CXR patients.
In Reference [66], the method uses a processing pipeline composed of a two-stage filtering process (adapting median filter and bilateral filter, respectively) and CLAHE. Similarly, we consider either HMF for the filtering part and CLAHE for the contrast enhancement part. Differently, we have introduced the FABEMD to perform an adaptive isolation of image feature and to achieve a more selective filtering of the image components. In addition, we perform evaluation of the results using well-known metrics (CII and ENT) other than Peak signal-to-noise ratio (PSNR) and Structural Similarity Index (SSIM). Although the structural similarity index family is a set of metrics that has demonstrated good agreement with human observers in tasks using reference images, some studies show limits in the performance of these indices when analyzing medical images [67,68].
In Reference [65], the method used for performing Medical X-ray Image enhancement adopts a new kind of Homomorphic Filtering, which is called Total Variation (TV) Homomorphic Filter. In order to evaluate its performance, different metrics are used, including mean value, ENT, average gradient and average Laplacian. This Homomorphic Filter can be also used for PACE.
In addition, we have evaluated the image contrast enhancement with other methods listed below, selected by checking other works [69,70,71,72,73]:
  • Adaptive Gamma Correction with Weighting Distribution (AGCWD) [74]
  • Contrast Enhanced Gamma Correction (CEGAMMA) [75]
  • Exposure-based Sub-Image Histogram Equalization (ESIHE) [76]
  • Median-Mean-based Sub-Image Clipped Histogram Equalization (MMSICHE) [73]
  • Recursive Sub-Image Exposure-based Histogram Equalization (R-ESIHE) [76]
  • Dominant Orientation-based Texture Histogram Equalization (DOTHE) [72]
  • Contrast Limited Adaptive Histogram Equalization (CLAHE) [38].
Table 1 summarizes the results for: AGCWD, CEGAMMA, ESIHE, MMSICHE, R-ESIHE, DOTHE, CLAHE, and our method (PACE) using a dataset composed of 163 CXR images from patients affected by different pulmonary diseases (including lung cancer, pneumonia, mucoviscidosis, pulmonary fibrosis, pulmonary sarcoidosis, pleural effusion and COVID-19) furnished by the Hospital ‘Policlinico G. Martino’ of Messina (Italy).
An improvement for all the images based on the three metrics have been obtained. An average increase of 11% in CII and 5% in entropy have been documented.

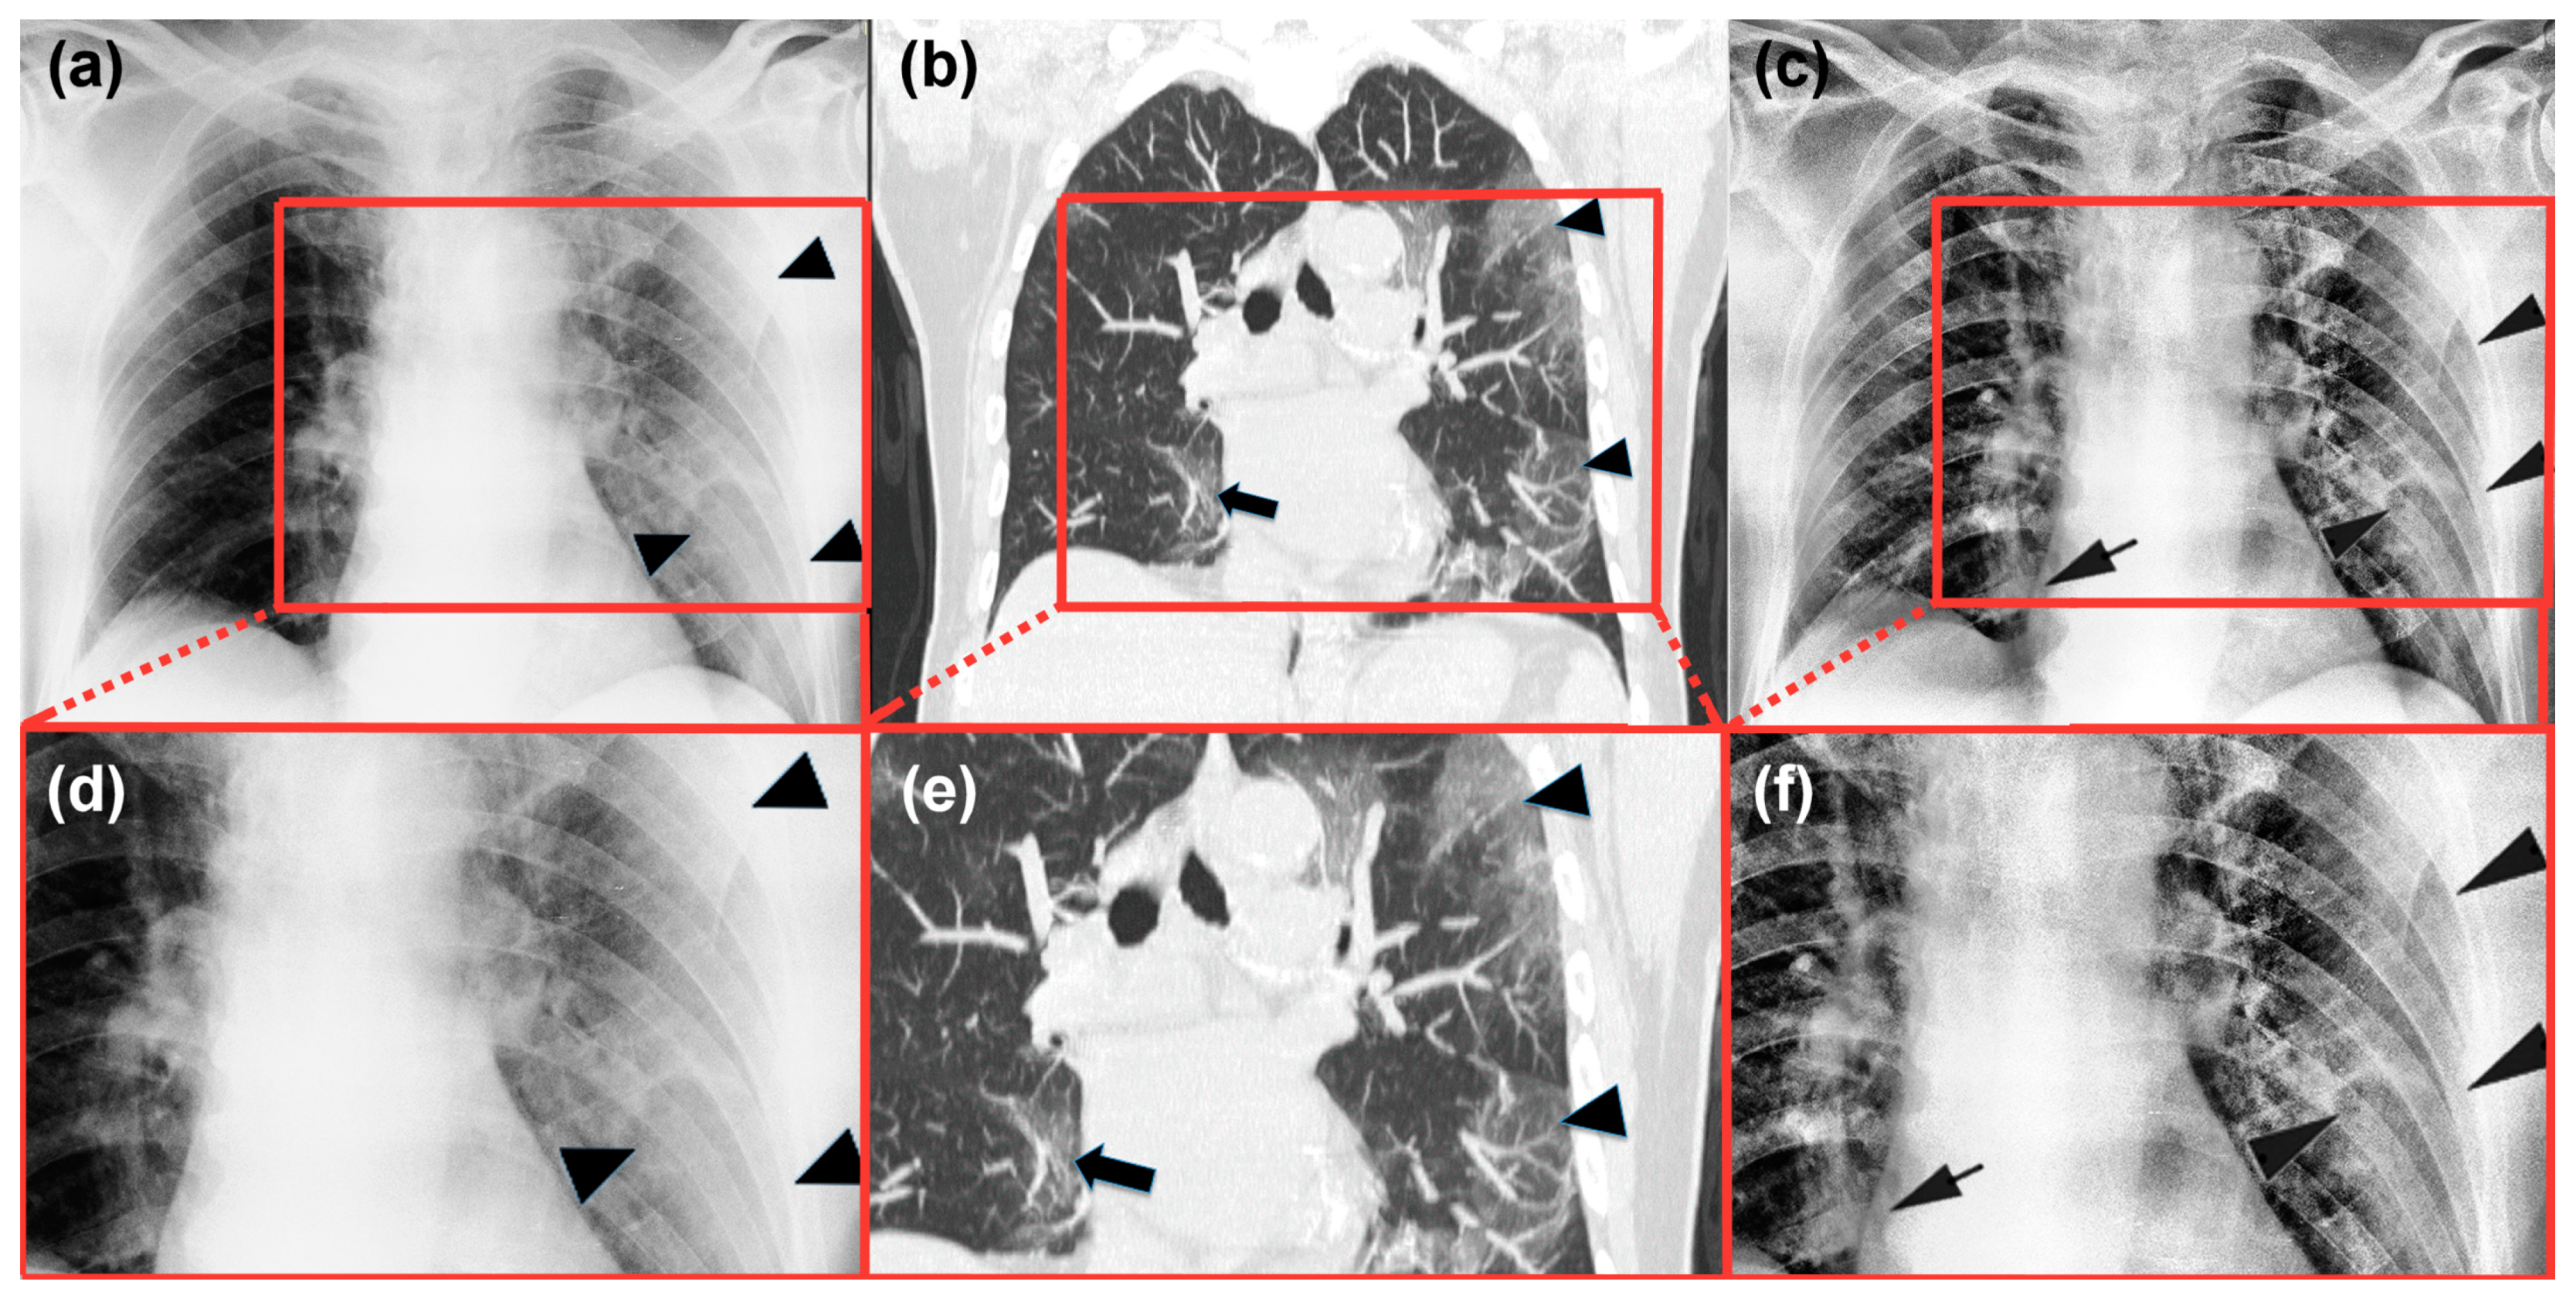
4.2. Radiological Evaluation and Statistics

For each of the 79 patients with laboratory-confirmed COVID-19 who underwent a bedside chest X-ray, two radiologists were asked to express their opinion about: (i) presence of pneumonia (negative or positive) and (ii) assessment of diagnostic improvement with CXR images enhanced with PACE. The evaluation procedure followed a standard procedure, it was carried out separately by the two radiologists in one session and a final agreement was then calculated.
The agreement about both the presence of pneumonia and the diagnostic improvement was calculated with the inter-observer agreement K-value and the statistical significance p. In this evaluation, the values computed are K = 0.933 and p < 0.001. The sensitivity defined as the number of positive diagnosis over the true COVID-19 positive (confirmed by the transcription-polymerase chain reaction) was 69%. Post-processed images improved the detection of lesions in 8 out 79 patients (≅10%), and in 3 patients allowed detection of lesions not visible on not-processed CXRs.
In general, from a radiological point of view, the key achievement is that the number of lesions identified in the original image and the one post-processed with CLAHE is the same, while PACE shows the capability to enhance the quality of the CXR enough in order to find more lesions when present. This result is confirmed in 8 patients; for the other cases, while the number of lesions is the same for the three images (original, CLAHE, and our method), the velocity of lesion search has been improved as confirmed independently by a third radiologist. To support our claims in those cases, we have also performed the CT scans. Figure 5 shows a comparison among the original CXR image (panel a), the corresponding CT scan (panel b), and the enhanced CXR (panel c) as computed with PACE. Baseline CXR (a) shows a large peripheral ground-glass pneumonia in the left lung indicated with arrowheads. No lesions can be seen in the right lung. On the other hand, on the enhanced image (c), left lung pneumonia (arrowheads) is better visible as well as further focus of pneumonia in the right lung (arrow). Maximum intensity projection of isotropic coronal reconstruction (b) confirms the presence of both the large left lung lesion (arrowheads) and the small focus of pneumonia in the right lung (arrow). We highlight that on the baseline radiogram it is present as (a) overexposition of the right lung due to slight rotation of the patient. On the enhanced image (c), overexposition has been corrected. To analyze how details are preserved and contrast enhanced, in Figure 5d–f show a magnified region for original (d), CT scan (e) and enhanced image (f), respectively. Indeed, a more important aspect is accomplished in 3 cases of the 8 cited above. In those specific cases, it has not been possible to detect any lesions in the original and the CLAHE images, while lesions have been found in the image enhanced by our approach. Such results have been confirmed by the CT scans.
An example for those cases is shown in Figure 6, where a comparison among original CXR image (a), the corresponding CT scan (b) and the enhanced CXR (c) is displayed. Baseline CXR does not show any lesions. However, both the CT scan and the enhanced image (see arrow) show the presence of a lesion in the left lung. A zoom of the area where this specific lung lesion is located is investigated in panels (d–f). Here, the magnified region is shown from the original image (d), CT scan (e) and with PACE (f), respectively. PACE enables to identify the lesion (black arrow) which is not visible using original CXR. The lesion in confirmed by evaluating the CT scan (white arrow) (e).
While developed for supporting the monitoring of COVID-19 patients, PACE can be also used to improve the image contrast for other possible scenarios as shown in the two examples of Appendix A. For those cases, the CT also confirms the additional information which can be caught from the enhanced CXR.

5. Conclusions

Medical imaging has a significant impact on medical applications, and since the quality of healthcare directly affects the quality of living of a patient, using the images for improving the performance of the medical specialists is an important issue [79]. We have developed an automatic post-processing tool to enhance CXR images for the detection of lung lesions. These results are generally applicable to image enhancement. On the other hand, the capability to support image monitoring of the healthy status of COVID-19 patients has been tested in 79 patients. From a clinical point of view, the image enhancement induced by the method implemented in this work originated (i) a faster detection of lung lesions in general, (ii) in 8 cases, it was able to highlight additional lesions, while (iii) in 3 out of the 8 cases, lesions have been detected in the enhanced CXR image while baseline CXR did not show any lesions. The clinical findings have been evaluated by two radiologists, initially independently of each other, and a third consultancy has been further used for confirmation. In addition, CT scan verification substantiates the achievement observed in enhanced CXR.
From a technical point of view, the improved performance of PACE approach has been confirmed by three well-known metrics, (i) contrast improvement index, (ii) entropy, and (iii) measure of enhancement. The analysis of these metrics shows that this method preserves the input image details more accurately and gives a processed image with better contrast enhancement and reduced brightness inhomogeneities. Concretely, we believe that this tool can support the clinical assistance of COVID-19 patients by enhancing the readability of CXR attained by portable X-ray equipment and, in addition, furnishing capability to monitor patients in intensive care units.

Author Contributions

G.S. implemented the algorithm and the methodology supported by A.L.C.; G.S., M.G., M.C. and G.F. developed the idea; G.F. coordinated the work; M.G. and G.C. cured the clinical part. G.F. wrote the paper with input from G.S. and M.G. The validation part has been accomplished by G.S., M.G. and G.F. All authors have read and agreed to the published version of the manuscript.

Funding

This research received no external funding.

Acknowledgments

This work was partially supported by PETASPIN association and MARIS s.c.a.r.l.

Conflicts of Interest

The authors declare no conflict of interest.

Ethical Statement

The Ethical Committee at the University Hospital of Messina does not require approval for a work on retrieved and anonymized data. For any information, contact the secretary of Ethical Committee at the University Hospital of Messina at the contact information posted on its website (https://pre.polime.it/comitato_etico_interaziendale).

Data Availability

The data that support the plots within this paper and other findings of this study are available from the corresponding authors upon reasonable request.

Appendix A

Figure A1a shows a CXR, obtained in supine position, of a patient hospitalized in an intensive care unit after blunt thoracic trauma where pulmonary contusions were suspected with low diagnostic confidence both in the left and in the right lung (asterisks). On the enhanced CXR (Figure A1b), a large retrocardiac area of attenuation due to the contusion of the left lower lobe can be seen. Air-containing bronchi are also visible within the contusion (black arrow). In addition, a smaller and inhomogeneous contusion (white arrows) can be detected with high confidence in the right lower lobe close to the right edge of the heart (R). Figure A1c shows the chest CT coronal reconstruction, which confirms the lung contusions in the left (L) and right (white arrows) lower lobes as well as bronchi (black arrow) within the left contusion. CT correlates perfectly with the enhanced CXR.
Figure A1. A comparison among (a) original CXR image, (b) enhanced CXR image using PACE and (c) CT image for a non-COVID-19 case.
Sustainability 12 08573 g0a1
Figure A2a shows the CXR of a patient with hemoptysis where a nodule was suspected in the right upper lobe (arrow). The enhanced CXR allows to detect the nodule with higher confidence (Figure A2b) and with more details about the shape. The coronal CT reconstruction in Figure A2c confirmed the speculated nodule in the left lung. A transthoracic biopsy yielded pulmonary adenocarcinoma.
Figure A2. A comparison among (a) original CXR image, (b) enhanced CXR image using PACE and (c) CT image for a non-COVID-19 case (a patient with hemoptysis).
Sustainability 12 08573 g0a2

References

  1. Huda, W.; Abrahams, R.B. X-ray-based medical imaging and resolution. Am. J. Roentgenol. 2015, 204, W393–W397. [Google Scholar] [CrossRef] [PubMed]
  2. World Health Organisation. Coronavirus Disease 2019 (COVID-19) Situation Report-68; WHO: Geneva, Switzerland, 2020. [Google Scholar]
  3. Pan, F.; Ye, T.; Sun, P.; Gui, S.; Liang, B.; Li, L.; Zheng, D.; Wang, J.; Hesketh, R.L.; Yang, L.; et al. Time course of lung changes on chest ct during recovery from 2019 novel coronavirus (COVID-19) pneumonia. Radiology 2020, 200370. [Google Scholar] [CrossRef] [PubMed] [Green Version]
  4. Larke, F.J.; Kruger, R.L.; Cagnon, C.H.; Flynn, M.J.; McNitt-Gray, M.M.; Wu, X.; Judy, P.F.; Cody, D.D. Estimated radiation dose associated with low-dose chest ct of average-size participants in the national lung screening trial. Am. J. Roentgenol. 2011, 197, 1165–1169. [Google Scholar] [CrossRef] [PubMed]
  5. Mossa-Basha, M.; Meltzer, C.C.; Kim, D.C.; Tuite, M.J.; Kolli, K.P.; Tan, B.S. Radiology Department preparedness for COVID-19: Radiology scientific expert panel. Radiology 2020, 200988. [Google Scholar] [CrossRef] [PubMed] [Green Version]
  6. Wong, H.Y.F.; Lam, H.Y.S.; Fong, A.H.-T.; Leung, S.T.; Chin, T.W.-Y.; Lo, C.S.Y.; Lui, M.M.-S.; Lee, J.C.Y.; Chiu, K.W.-H.; Chung, T.; et al. Frequency and distribution of chest radiographic findings in COVID-19 positive patients. Radiology 2020, 201160. [Google Scholar] [CrossRef] [PubMed] [Green Version]
  7. Bandirali, M.; Sconfienza, L.M.; Serra, R.; Brembilla, R.; Albano, D.; Ernesto, P.F.; Messina, C. Chest X-ray findings in asymptomatic and minimally symptomatic quarantined patients in Codogno, Italy. Radiology 2020, 201102. [Google Scholar] [CrossRef] [Green Version]
  8. Ortiz-Jaramillo, B.; Kumcu, A.; Platisa, L.; Philips, W. Content-aware contrast ratio measure for images. Signal Process. Image Commun. 2018, 62, 51–63. [Google Scholar] [CrossRef]
  9. Qureshi, M.A.; Beghdadi, A.; Deriche, M. Towards the design of a consistent image contrast enhancement evaluation measure. Signal Process. Image Commun. 2017, 58, 212–227. [Google Scholar] [CrossRef]
  10. Wang, X.; Chen, L. An effective histogram modification scheme for image contrast enhancement. Signal Process. Image Commun. 2017, 58, 187–198. [Google Scholar] [CrossRef]
  11. Campbell, J.; Pyer, M.; Rogers, S.; Walter, D.; Reddy, R. Enabling patients with respiratory symptoms to access chest X-rays on demand: The experience of the walk-in service in Corby, UK. J. Public Health 2014, 36, 511–516. [Google Scholar] [CrossRef] [Green Version]
  12. Cao, A.M.Y.; Choy, J.P.; Mohanakrishnan, L.N.; Bain, R.F.; van Driel, M.L. Chest radiographs for acute lower respiratory tract infections. Cochrane Database Syst. Rev. 2013, 12. [Google Scholar] [CrossRef] [PubMed] [Green Version]
  13. Walz-Flannigan, A.; Magnuson, D.; Erickson, D.; Schueler, B. Artifacts in Digital Radiography. Am. J. Roentgenol. 2012, 198, 156–161. [Google Scholar] [CrossRef] [PubMed]
  14. Hariri, L.P.; Mino-Kenudson, M.; Lanuti, M.; Miller, A.J.; Mark, E.J.; Suter, M.J. Diagnosing lung carcinomas with optical coherence tomography. Ann. Am. Thorac. Soc. 2015, 12, 193–201. [Google Scholar] [CrossRef] [Green Version]
  15. Galbois, A.; Ait-Oufella, H.; Baudel, J.-L.; Kofman, T.; Bottero, J.; Viennot, S.; Rabate, C.; Jabbouri, S.; Bouzeman, A.; Guidet, B.; et al. Pleural ultrasound compared with chest radiographic detection of pneumothorax resolution after drainage. Chest 2010, 138, 648–655. [Google Scholar] [CrossRef] [PubMed]
  16. Gaeta, M.; Minutoli, F.; Ascenti, G.; Vinci, S.; Mazziotti, S.; Pandolfo, I.; Blandino, A. MR white lung sign: Incidence and significance in pulmonary consolidations. J. Comput. Assist. Tomogr. 2001, 25, 890–896. [Google Scholar] [CrossRef]
  17. Gaeta, M.; Ascenti, G.; Mazziotti, S.; Contiguglia, R.; Barone, M.; Mileto, A. MRI differentiation of pneumonia-like mucinous adenocarcinoma and infectious pneumonia. Eur. J. Radiol. 2012, 81, 3587–3591. [Google Scholar] [CrossRef]
  18. Lv, D.; Qi, W.; Li, Y.; Sun, L.; Wang, Y. A cascade network for Detecting COVID-19 using chest X-rays. arXiv 2020, arXiv:2005.01468. Available online: http://arxiv.org/abs/2005.01468 (accessed on 1 May 2020).
  19. Tartaglione, E.; Barbano, C.A.; Berzovini, C.; Calandri, M.; Grangetto, M. Unveiling COVID-19 from Chest X-ray with deep learning: A hurdles race with small data. arXiv 2020, arXiv:2004.05405. Available online: http://arxiv.org/abs/2004.05405 (accessed on 11 April 2020).
  20. Oh, Y.; Park, S.; Ye, J.C. Deep learning COVID-19 features on CXR using limited training data sets. arXiv 2020, arXiv:2004.05758. Available online: http://arxiv.org/abs/2004.05758 (accessed on 5 May 2020).
  21. Bhuiyan, S.M.A.; Adhami, R.R.; Khan, J.F. A novel approach of fast and adaptive bidimensional empirical mode decomposition. In Proceedings of the 2008 IEEE International Conference on Acoustics, Speech and Signal Processing, Las Vegas, NV, USA, 31 March–4 April 2008; pp. 1313–1316. [Google Scholar]
  22. Bhuiyan, S.M.A.; Adhami, R.R.; Khan, J.F. Fast and adaptive bidimensional empirical mode decomposition using order-statistics filter based envelope estimation. EURASIP J. Adv. Signal Process. 2008, 2008, 728356. [Google Scholar] [CrossRef] [Green Version]
  23. Looney, D.; Mandic, D.P. Multiscale Image fusion using complex extensions of EMD. IEEE Trans. Signal Process. 2009, 57, 1626–1630. [Google Scholar] [CrossRef]
  24. Sotiras, A.; Davatzikos, C.; Paragios, N. Deformable medical image registration: A survey. IEEE Trans. Med. Imaging 2013, 32, 1153–1190. [Google Scholar] [CrossRef] [PubMed] [Green Version]
  25. Liu, W.; Xu, W.; Li, L. Medical image retrieval based on bidimensional empirical mode decomposition. In Proceedings of the 2007 IEEE 7th International Symposium on BioInformatics and BioEngineering, Boston, MA, USA, 14–17 October 2007; pp. 641–646. [Google Scholar]
  26. Zheng, Y.-Z.; Qin, Z. Medical image fusion algorithm based on bidimensional empirical mode decomposition. J. Softw. 2010, 20, 1096–1105. [Google Scholar] [CrossRef]
  27. James, A.P.; Dasarathy, B.V. Medical image fusion: A survey of the state of the art. Inf. Fusion 2014, 19, 4–19. [Google Scholar] [CrossRef] [Green Version]
  28. Flandrin, P.; Gonçalvès, P.; Rilling, G. EMD equivalent filter banks, from interpretation to applications. In The Hilbert-Huang Transform and Its Applications; World Scientific: Singapore, 2014; pp. 99–116. [Google Scholar]
  29. Pitas, I.; Venetsanopoulos, A.N. Nonlinear Digital Filters; Springer US: Boston, MA, USA, 1990; ISBN 978-1-4419-5120-5. [Google Scholar]
  30. Wen, H.; Qi, W.; Shuang, L. Medical X-ray image enhancement based on wavelet domain homomorphic filtering and CLAHE. In Proceedings of the 2016 International Conference on Robots & Intelligent System (ICRIS), Zhangjiajie, China, 27–28 August 2016; pp. 249–254. [Google Scholar]
  31. Fan, C.-N.; Zhang, F.-Y. Homomorphic filtering based illumination normalization method for face recognition. Pattern Recognit. Lett. 2011, 32, 1468–1479. [Google Scholar] [CrossRef]
  32. Castaño Moraga, C.A.; Westin, C.F.; Ruiz-Alzola, J. Homomorphic filtering of DT-MRI fields. In Lecture Notes in Computer Science; Springer: Berlin/Heidelberg, Germany, 2003; pp. 990–991. [Google Scholar]
  33. Delac, K.; Grgic, M.; Kos, T. Sub-image homomorphic filtering technique for improving facial identification under difficult illumination conditions. In Proceedings of the 13th International Conference on Systems, Signals and Image Processing, Budapest, Hungary, 21–23 September 2006. [Google Scholar]
  34. Dutta, P.; Saha, S. Fusion of expression values and protein interaction information using multi-objective optimization for improving gene clustering. Comput. Biol. Med. 2017, 89, 31–43. [Google Scholar] [CrossRef]
  35. Yang, X.-S. Multi-Objective Optimization. In Nature-Inspired Optimization Algorithms; Elsevier: Amsterdam, The Netherlands, 2014; pp. 197–211. [Google Scholar]
  36. Seow, M.-J.; Asari, V.K. Ratio rule and homomorphic filter for enhancement of digital colour image. Neurocomputing 2006, 69, 954–958. [Google Scholar] [CrossRef]
  37. Zimmerman, J.B.; Pizer, S.M.; Staab, E.V.; Perry, J.R.; McCartney, W.; Brenton, B.C. An evaluation of the effectiveness of adaptive histogram equalization for contrast enhancement. IEEE Trans. Med. Imaging 1988, 7, 304–312. [Google Scholar] [CrossRef] [Green Version]
  38. Zuiderveld, K. Contrast Limited Adaptive Histogram Equalization. In Graphics Gems; Elsevier: Amsterdam, The Netherlands, 1994; pp. 474–485. [Google Scholar]
  39. Joseph, J.; Sivaraman, J.; Periyasamy, R.; Simi, V.R. An objective method to identify optimum clip-limit and histogram specification of contrast limited adaptive histogram equalization for MR images. Biocybern. Biomed. Eng. 2017, 37, 489–497. [Google Scholar] [CrossRef]
  40. Al-Ameen, Z.; Sulong, G.; Rehman, A.; Al-Dhelaan, A.; Saba, T.; Al-Rodhaan, M. An innovative technique for contrast enhancement of computed tomography images using normalized gamma-corrected contrast-limited adaptive histogram equalization. EURASIP J. Adv. Signal Process. 2015, 2015, 32. [Google Scholar] [CrossRef]
  41. Sahu, S.; Singh, A.K.; Ghrera, S.P.; Elhoseny, M. An approach for de-noising and contrast enhancement of retinal fundus image using CLAHE. Opt. Laser Technol. 2019, 110, 87–98. [Google Scholar] [CrossRef]
  42. Zhou, X.; Zheng, Y.; Tan, L.; Zhao, J. Medical Image Contrast Enhancement via Wavelet Homomorphic Filtering Transform. TELKOMNIKA (Telecommun. Comput. Electron. Control.) 2016, 14, 1203. [Google Scholar] [CrossRef] [Green Version]
  43. Tan, Y.; Li, G.; Duan, H.; Li, C. Enhancement of medical image details via wavelet homomorphic filtering transform. J. Intell. Syst. 2014, 23, 83–94. [Google Scholar] [CrossRef]
  44. Panetta, K.; Zhou, Y.; Agaian, S.; Hongwei, J. Nonlinear unsharp masking for mammogram enhancement. IEEE Trans. Inf. Technol. Biomed. 2011, 15, 918–928. [Google Scholar] [CrossRef]
  45. Agaian, S.S.; Silver, B.; Panetta, K.A. Transform coefficient histogram-based image enhancement algorithms using contrast entropy. IEEE Trans. Image Process. 2007, 16, 741–758. [Google Scholar] [CrossRef]
  46. Wu, L.; Zhang, X.; Chen, H. Effective quality metric for contrast-distorted images based on SVD. Signal. Process. Image Commun. 2019, 78, 254–262. [Google Scholar] [CrossRef]
  47. Gonzalez, R.C.; Woods, R.E. Digital Image Processing, 3rd ed.; Pearson: London, UK, 2007; ISBN 013168728X. [Google Scholar]
  48. Ema, T.; Doi, K.; Nishikawa, R.M.; Jiang, Y.; Papaioannou, J. Image feature analysis and computer-aided diagnosis in mammography: Reduction of false-positive clustered microcalcifications using local edge-gradient analysis. Med. Phys. 1995, 22, 161–169. [Google Scholar] [CrossRef]
  49. Wu, S.; Zhu, Q.; Yang, Y.; Xie, Y. Feature and contrast enhancement of mammographic image based on multiscale analysis and morphology. In Proceedings of the 2013 IEEE International Conference on Information and Automation (ICIA), Yinchuan, China, 26–28 August 2013; pp. 521–526. [Google Scholar]
  50. Agaian, S.S.; Panetta, K.; Grigoryan, A.M. Transform-based image enhancement algorithms with performance measure. IEEE Trans. Image Process. 2001, 10, 367–382. [Google Scholar] [CrossRef] [Green Version]
  51. Kanwal, N.; Girdhar, A.; Gupta, S. Region based adaptive contrast enhancement of medical X-ray images. In Proceedings of the 2011 5th International Conference on Bioinformatics and Biomedical Engineering, Wuhan, China, 10–12 May 2011; pp. 1–5. [Google Scholar]
  52. Panetta, K.; Samani, A.; Agaian, S. Choosing the optimal spatial domain measure of enhancement for mammogram images. Int. J. Biomed. Imaging 2014, 2014, 1–8. [Google Scholar] [CrossRef]
  53. Chen, S.; Yao, L.; Chen, B. A parameterized logarithmic image processing method with Laplacian of Gaussian filtering for lung nodule enhancement in chest radiographs. Med. Biol. Eng. Comput. 2016, 54, 1793–1806. [Google Scholar] [CrossRef]
  54. Chen, S.; Cai, Y. Enhancement of chest radiograph in emergency intensive care unit by means of reverse anisotropic diffusion-based unsharp masking model. Diagnostics 2019, 9, 45. [Google Scholar] [CrossRef] [PubMed] [Green Version]
  55. Gupta, S.; Porwal, R. Appropriate contrast enhancement measures for brain and breast cancer images. Int. J. Biomed. Imaging 2016, 2016, 1–8. [Google Scholar] [CrossRef] [PubMed] [Green Version]
  56. Sundaram, M.; Ramar, K.; Arumugam, N.; Prabin, G. Histogram modified local contrast enhancement for mammogram images. Appl. Soft Comput. 2011, 11, 5809–5816. [Google Scholar] [CrossRef]
  57. Arici, T.; Dikbas, S.; Altunbasak, Y. A histogram modification framework and its application for image contrast enhancement. IEEE Trans. Image Process. 2009, 18, 1921–1935. [Google Scholar] [CrossRef]
  58. Lee, C.; Lee, C.; Kim, C.-S. Contrast enhancement based on layered difference representation of 2D histograms. IEEE Trans. Image Process. 2013, 22, 5372–5384. [Google Scholar] [CrossRef] [PubMed]
  59. Chen, S.-D. A new image quality measure for assessment of histogram equalization-based contrast enhancement techniques. Digit. Signal. Process. 2012, 22, 640–647. [Google Scholar] [CrossRef]
  60. Akila, K.; Jayashree, L.S.; Vasuki, A. Mammographic image enhancement using indirect contrast enhancement techniques—A comparative study. Procedia Comput. Sci. 2015, 47, 255–261. [Google Scholar] [CrossRef] [Green Version]
  61. Cohen, J.P.; Morrison, P.; Dao, L. COVID-19 image data collection. arXiv 2020, arXiv:2003.11597. Available online: http://arxiv.org/abs/2003.11597 (accessed on 25 March 2020).
  62. Khan, S.U.; Chai, W.Y.; See, C.S.; Khan, A. X-ray image enhancement using a boundary division wiener filter and wavelet-based image fusion approach. J. Inf. Process. Syst. 2016, 12, 35–45. [Google Scholar] [CrossRef] [Green Version]
  63. Zhang, Y. X-ray image enhancement using the fruit fly optimization algorithm. Int. J. Simul. Syst. Sci. Technol. 2016, 2016, 44.1–44.5. [Google Scholar] [CrossRef]
  64. Huang, C.-C.; Nguyen, M.-H. X-ray enhancement based on component attenuation, contrast adjustment, and image fusion. IEEE Trans. Image Process. 2019, 28, 127–141. [Google Scholar] [CrossRef] [PubMed]
  65. Rui, W.; Guoyu, W. Medical X-ray image enhancement method based on TV-homomorphic filter. In Proceedings of the 2017 2nd International Conference on Image, Vision and Computing, ICIVC 2017, Chengdu, China, 2–4 June 2017. [Google Scholar]
  66. Huang, R.; Dung, L.; Chu, C. Noise removal and contrast enhancement for X-ray images. J. Biomed. Eng. Med. Imaging 2016, 3, 56. [Google Scholar] [CrossRef]
  67. Kim, B.; Lee, H.; Kim, K.J.; Seo, J.; Park, S.; Shin, Y.-G.; Kim, S.H.; Lee, K.H. Comparison of three image comparison methods for the visual assessment of the image fidelity of compressed computed tomography images. Med. Phys. 2011, 38, 836–844. [Google Scholar] [CrossRef] [PubMed]
  68. Johnson, J.P.; Krupinski, E.A.; Yan, M.; Roehrig, H.; Graham, A.R.; Weinstein, R.S. Using a visual discrimination model for the detection of compression artifacts in virtual pathology images. IEEE Trans. Med. Imaging 2011, 30, 306–314. [Google Scholar] [CrossRef] [Green Version]
  69. Singh, N.; Kaur, L.; Singh, K. Histogram equalization techniques for enhancement of low radiance retinal images for early detection of diabetic retinopathy. Eng. Sci. Technol. Int. J. 2019, 22, 736–745. [Google Scholar] [CrossRef]
  70. Al-Ameen, Z. Expeditious contrast enhancement for grayscale images using a new swift algorithm. Stat. Optim. Inf. Comput. 2018, 6. [Google Scholar] [CrossRef] [Green Version]
  71. Wong, C.Y.; Liu, S.; Liu, S.C.; Rahman, M.A.; Lin, S.C.-F.; Jiang, G.; Kwok, N.; Shi, H. Image contrast enhancement using histogram equalization with maximum intensity coverage. J. Mod. Opt. 2016, 63, 1618–1629. [Google Scholar] [CrossRef]
  72. Singh, K.; Vishwakarma, D.K.; Walia, G.S.; Kapoor, R. Contrast enhancement via texture region based histogram equalization. J. Mod. Opt. 2016, 63, 1444–1450. [Google Scholar] [CrossRef]
  73. Singh, K.; Kapoor, R. Image enhancement via median-mean based sub-image-clipped histogram equalization. Optik 2014, 125, 4646–4651. [Google Scholar] [CrossRef]
  74. Rahman, S.; Rahman, M.M.; Abdullah-Al-Wadud, M.; Al-Quaderi, G.D.; Shoyaib, M. An adaptive gamma correction for image enhancement. EURASIP J. Image Video Process. 2016, 2016, 35. [Google Scholar] [CrossRef] [Green Version]
  75. Jiang, G.; Wong, C.Y.; Lin, S.C.F.; Rahman, M.A.; Ren, T.R.; Kwok, N.; Shi, H.; Yu, Y.-H.; Wu, T. Image contrast enhancement with brightness preservation using an optimal gamma correction and weighted sum approach. J. Mod. Opt. 2015, 62, 536–547. [Google Scholar] [CrossRef]
  76. Singh, K.; Kapoor, R.; Sinha, S.K. Enhancement of low exposure images via recursive histogram equalization algorithms. Optik 2015, 126, 2619–2625. [Google Scholar] [CrossRef]
  77. Huang, S.-C.; Cheng, F.-C.; Chiu, Y.-S. Efficient contrast enhancement using adaptive gamma correction with weighting distribution. IEEE Trans. Image Process. 2013, 22, 1032–1041. [Google Scholar] [CrossRef]
  78. Singh, K.; Kapoor, R. Image enhancement using Exposure based Sub Image Histogram Equalization. Pattern Recognit. Lett. 2014, 36, 10–14. [Google Scholar] [CrossRef]
  79. Siracusano, G.; La Corte, A.; Gaeta, M.; Finocchio, G. A data-oriented self-calibration and robust chemical-shift encoding by using clusterization (OSCAR): Theory, optimization and clinical validation in neuromuscular disorders. Magn. Reson. Imaging 2018, 45. [Google Scholar] [CrossRef]
Figure 1. A block diagram of the PACE method developed in this work. The input Chest X-ray (CXR) is converted into an Enhanced CXR (ECXR) through different steps. (I) Fast and Adaptive Bidimensional Empirical Mode Decomposition (FABEMD) generates the bi-dimensional intrinsic mode functions (BIMFs) and a bidimensional residual image (BR), (II) the Homomorphic Filtering (HMF) block filters the BR to correct brightness inhomogeneities. Finally, (III) Contrast Limited Adaptive Histogram Equalization (CLAHE) is applied on the reconstructed image (BIMFs + filtered BR) to improve the overall contrast and generate the ECXR.
Sustainability 12 08573 g001
Figure 2. (a)–(j): An example of BIMFS computed with the FABEMD decomposition. (a) Original image; (b) BIMF #1 and (c) BIMF #2, which contain highly varying components with very low amplitude; (d) BIMF #3; (e) BIMF #4 and (f) BIMF #5 display more components with more information content. The panels (g) BIMF #6; (h) BIMF #7, (i) BIMF #8 and (j) BIMF #9 represent the low varying components while (k) shows the bidimensional residue (BR) of the calculation.
Sustainability 12 08573 g002
Figure 3. (a) Residual image as obtained from FABEMD of the same input CXR image as processed in Figure 2 (panel j); (b) Residual image after being processed using the HMF. As shown, the non-uniform luminance of the image has been significantly corrected (see red arrows as reference).
Sustainability 12 08573 g003
Figure 4. (af). The panels (ac) show a comparison of performance between a literature reference algorithm (CLAHE) (empty red triangles) and the one proposed in this work (empty blue circles) evaluated with three metrics (a) contrast improvement index (CII), (b) entropy (ENT), and (c) and enhancement measurement (EME). The panels (df) show an example of the CXR compared with (d) original image, (e) post-processed with CLAHE, and (f) PACE. Finally, the panels (gi) provide a magnified area with evidence of how lungs are differently shown in original (g), post-processed with CLAHE (h) and with our method (i). PACE enhances both contrast and details in a better way than state-of-the-art reference methods.
Sustainability 12 08573 g004
Figure 5. A comparison among (a) original CXR image, (b) CT image and (c) enhanced CXR image using PACE where it is possible to show that the number of lesions found in the enhanced image are more than the one identified in the original image. Finally, the panels (df) provide a magnified area with evidence of how lungs are differently shown in original (d), CT image (e) and with our method (f).
Sustainability 12 08573 g005
Figure 6. A comparison among (a) original CXR image, (b) CT image and (c) enhanced CXR image using PACE. Here, it is possible to see a case where the lesion can be observed in the enhanced image and not in the original one. Lastly, the panels (df) provide a magnified area with evidence of how lungs are differently shown in original (d), CT image (e) and with our method (f).
Sustainability 12 08573 g006
Table 1. Performance comparison based on entropy (ENT) and CII as expressed in average +/− standard deviation. Results of 163 CXR images from patients with different pulmonary diseases as evaluated using several state-of-the-art methods. The asterisk ‘*’ represents the best method for the metric.
ENTCII
AGCWD [77]6.94 +/− 0.621.27 +/− 0.33
CEGAMMA [75]6.84 +/− 0.640.94 +/− 0.07
ESIHE [78]6.86 +/− 0.631.11 +/− 0.18
MMSICHE [73]6.85 +/− 0.631.05 +/− 0.1
R-ESIHE [76]6.77 +/− 0.621.09 +/− 0.21
RS-ESIHE [76]6.72 +/− 0.650.9 +/− 0.23
DOTHE [72]6.46 +/− 0.591.23 +/− 0.29
CLAHE [38]7.27 +/− 0.571.18 +/− 0.17
PACE* 7.69 +/− 0.2* 1.31 +/− 0.24
Publisher’s Note: MDPI stays neutral with regard to jurisdictional claims in published maps and institutional affiliations.

