Article

Less Food Wasted? Changes to New Zealanders’ Household Food Waste and Related Behaviours Due to the 2020 COVID-19 Lockdown

1
Te Kura Mātai Taiao/School of Environment, University of Auckland, Auckland 1010, New Zealand
2
Department of Human Nutrition, University of Otago, Dunedin 9016, New Zealand
3
School of Nursing, University of Auckland, Auckland 1023, New Zealand
4
Discipline of Nutrition, Department of Nutrition and Dietetics, University of Auckland, Auckland 1023, New Zealand
5
Centre for Hauora and Health, Massey University, Palmerston North 4442, New Zealand
6
Department of Communication Studies, University of Antwerp, 2000 Antwerpen, Belgium
7
School of Population Health, University of Auckland, Auckland 1142, New Zealand
*
Author to whom correspondence should be addressed.
Sustainability 2021, 13(18), 10006; https://doi.org/10.3390/su131810006
Submission received: 5 July 2021 / Revised: 29 August 2021 / Accepted: 30 August 2021 / Published: 7 September 2021

Abstract

:
Food waste is a crisis of our time, yet it remains a data gap in Aotearoa New Zealand’s (NZ’s) environmental reporting. This research contributes to threshold values on NZ’s food waste and seeks to understand the impact of the 2020 COVID-19 lockdown on household food waste in NZ. The data presented here form part of the ‘Covid Kai Survey’, an online questionnaire that assessed cooking and food planning behaviours during the 2020 lockdown and retrospectively before lockdown. Of the 3028 respondents, 62.5% threw out food ‘never’/‘rarely’ before lockdown, and this number increased to 79.0% during lockdown. Participants who wasted food less frequently during lockdown were more likely to be older, work less than full-time, and have no children. During lockdown, 30% and 29% of those who ‘frequently’ or ‘sometimes’ struggled to have money for food threw out food ‘sometimes or more’; compared with 20% of those who rarely struggled to have money for food (p < 0.001). We found that lower levels of food waste correlated with higher levels of cooking confidence (p < 0.001), perceived time (p < 0.001), and meal planning behaviours (p < 0.001). Understanding why food waste was generally considerably lower during lockdown may inform future initiatives to reduce food waste, considering socio-economic and demographic disparities.

1. Introduction

1.1. The Problem of Food Waste and Food Sustainability: Internationally and in Aotearoa New Zealand

Internationally, food waste has received significant attention in recent academic discourse due to the staggering figures of an estimated 1.3 billion tonnes of food being wasted globally each year [1]. The UN Environment Programme’s (UNEP) Food Waste Index suggests that around 17% of global food production may go to waste, with 61% of this waste from domestic sources [2]. The environmental degradation that occurs due to food waste–the excess methane and landfill leachate production, or additional dump space required when organic material is landfilled, not to mention the fossil fuels and greenhouse gases generated in the food’s production–is unjustified when food waste is avoidable. According to the United Nations Food and Agriculture Organisation, the 931 million tonnes of food (1/3 of the world’s food) that is unconsumed each year is estimated to generate between 8–10% of global carbon emissions [1].
The UN organisation Food Use for Social Innovation by Optimising Waste Prevention Strategies (FUSIONS) offers an inclusive definition of food waste that has been adopted across the European Union [3]. FUSIONS’ definition of food waste has been simplified by Goodman et al. [4] as: “Any food, and inedible parts of food, removed from the food supply chain to be recovered or disposed of (excludes food that is donated to humans or animals)” (p. 2). The inedible parts of food are included in the definition of food waste to encourage a food system that uses all parts of e.g., an animal, or vegetable. However, food donated to humans or animals is omitted because it is considered food diversion, or food waste prevention [3]. For this study only food wastage that occurred in the household was examined, as part of a suite of domestic food planning, preparation, and waste behaviours.
Most food waste studies have focused on quantifying the total food lost along the supply chain [5,6]. In the European Union alone 180 kg of food per person is wasted every year [7]. A US study on 39,758 individuals indicated that in 2008 wasted food averaged 124 kg, or economic losses of US $390 per capita per year [8]. In comparison, the Australia 2019 National Food Waste Baseline Project quantified food waste at 298 kg/year/person [9]. While the large variability in food waste volume per capita, per year could be down to differences in food waste behaviours and infrastructures between countries, the lack of standard international measures in place to compare waste volumes make absolute comparisons impractical. Other studies have honed in on what is wasted in the retail sector (see studies in the UK [10,11], Sweden [12], and New Zealand [4]). However, there is evidence that it is at the level of the household that the most food waste is generated [13].
Australia has adopted a national waste reduction target aligned to SDG 12.3 that incorporates household food waste, and there have been calls for NZ to do the same [14]) (p. 8). In Aotearoa New Zealand (NZ) a 2013 WasteMINZ campaign was launched, with initial studies auditing 1402 household rubbish bins across 12 council jurisdictions, and administering household food waste diaries to quantify and qualify food waste nationally. This was followed by a food waste attitudes and values survey in 2014, of 1365 respondents [15]. Of the data captured there was little change between surveys undertaken in 2014 and a follow up study undertaken in 2018 [16]. Between surveys, self-declarations of the percentage of food wasted remained at ~5% of a household’s weekly food expenditure, equating to ~NZ $390 per household per year, or ~NZ $144 per capita per year. Further, the demographic profile of ‘high food wasters’ also remained consistent between surveys, correlating with: “younger people i.e., those aged 16 to 24 years in the household responsible or jointly responsible for food shopping and preparation; large households i.e., those with four or more people living in them, households with children aged 15 years and under; and households with a high annual income (NZ $100,000 per annum or more)” [15] (p. 3]. In 2018 in New Zealand, the average household was estimated to be responsible for wasting ~164 kg/year of food of which 86 kg is ‘avoidable’ (or 61 kg of food waste and 32 kg of ‘avoidable’ food waste, per person, per year) [16] (p. 2).
While the overall volumes did not appear to change much between surveys [15] (p. 3), the reasons given for household food wastage did change between 2014 and 2018. Significant differences were around participants’ claims that the main reasons that food was wasted in their household were: because leftovers were uneaten (31% in 2014 to 23% in 2018), food went ‘off’ (25% in 2014 to 21% in 2018), too much food was cooked (11% to 15%), and too much food was purchased (9% to 15%) [17] (p. 50). Food waste in the 2018 survey was particularly high amongst 16–24-year-olds, (44% of whom agreed with this statement compared with 27% of the total sample of 1300 individuals) (p. 21). Of this demographic group busy lifestyles were stated as making it hard to avoid wasting food (50% compared with 34% of the total sample) (p. 24). These assessments were all conducted in pre-Covid times.
Despite these available figures on household food waste, it must be noted that inventories of household waste even in ‘normal’ (i.e., pre-COVID-19) times are challenging to undertake, with the actual total amount of food lost or wasted in New Zealand unknown and its disaggregation (for example to the household level) imprecise. In NZ, food waste data has been noted as “a gap in the country’s environmental reporting” [14] (p. 5). The household is chronologically last in the food supply chain and known to generate significant food waste as discussed above, but food management practices in domestic spaces are often hidden given their private, unregulated, and geographically scattered nature. Therefore, it is complicated to track and be confident of the representativeness of data in these types of studies, which are also most often self-declarations. What is clear is that generative changes in food waste-related attitudes and behaviours could significantly impact environmental and socio-economic sustainability [18]. To advance this project, here we present a study that is, to the authors’ best knowledge, the first paper to report changes to household food waste in NZ due to COVID-19 lockdown conditions, which at the least provide relative estimates, and qualitative information, where precise data on food waste is unavailable. This study supports other important work done in the food waste space in NZ [4,14,15,16,17] to make recommendations towards the standardisation of food waste measurement, and recommendations about NZ’s role in helping to tackle food waste globally through its national commitments to food waste reduction.

1.2. COVID-19 Context in Aotearoa New Zealand

Globally, there is interest in the effects that COVID-19 has had and will likely continue to have on food systems. The longest COVID-19 lockdown (Levels 3 and 4) period in NZ occurred March–May 2020. Lockdown stages in NZ progressed as follows: COVID-19 Alert Level 4 came into force at 11:59 p.m. Wednesday 25 March 2020; COVID-19 Alert Level 3 came into force at 11:59 p.m. Monday 27 April 2020; COVID-19 Alert Level 2 came into force at 11:59 p.m. Wednesday 13 May 2020; COVID-19 Alert Level 1 came into force at 11:59 p.m. Monday 8 June 2020 [19]. In NZ COVID-19 level 3 required people to stay home if possible, including working and learning from home unless not possible (e.g., in the case of essential workers required to be on location elsewhere). Level 4 instructed people to “stay at home in their bubble” (ibid.) which was often familial but could also include carers and sometimes close colleagues other than for essential personal movement. In practice, living in “bubbles” entailed severely limited travel, safe local recreational activity only, and cancellation of all gatherings and public venues with businesses operating only if they constituted essential services. Those services that were considered essential included, for example, supermarkets, pharmacies, clinics, petrol stations, and infrastructure services such as water, wastewater, transport, energy, and telecommunications.
As documented in a prior New Zealand study [20], which presented results from the same survey on what New Zealanders consumed during lockdown, formal and informal supply chains of food to and from NZ were severely impacted by COVID-19 lockdowns. The COVID-19 pandemic changed the way that household food was managed in Aotearoa NZ. For ‘middle-class’ New Zealanders, bottlenecks in the supply of usually available foods made some experimentation in meal preparation necessary. Disrupted supply chains meant that typically available foods were less accessible, with the consequence of households needing to plan meals further in advance and more often, where slow and snaking queues had to be negotiated to enter supermarkets. Oversubscribed online delivery slots made the food shopping experience arduous or even impossible for some [21]. Shopping trips (online or in person) were consequently more widely spaced for the majority of households. An increased number of New Zealanders suffered food poverty, resulting in a greater need for food charity and government support [22,23]. Fishing and harvesting food, and church and community garden use were hindered. Such limitations generated an increase in practices such as the backyard gardening of food crops for food security, food sovereignty and general ‘food management’ concerns. These changes to behaviour all had implications for household food waste.

1.3. International Studies on Household Food Waste in COVID-19 Times

There have been numerous, global, questionnaire-based studies of COVID-19 impacts on household food waste, and several with respondent numbers comparable to this study. The below brief review of COVID-19 food waste studies considers recent larger published datasets (>1000 respondents) and their outcomes, for which the study design used was for self-declarations of domestic food waste, via online survey.
In the UK a study of 4197 participants showed domestic food waste reduced significantly in April 2020 (the early phase of the lockdown there) with a 34% reduction of wasted staples such as bread, chicken, milk, and potatoes versus pre-lockdown figures [24]. This study also noted an increase in particular food planning behaviours, rising to 41% of those surveyed planning their supermarket shop by checking the cupboards and refrigerator, 37% organising that food, 33% ‘cooking more creatively’, and 30% of respondents starting to save leftovers in this period. An Italian study (n = 1188) echoed the UK study, reporting that 33% of consumers perceived a substantial decrease in household food waste due to the COVID-19 lockdown, however ~45% declared that by their own perception, it was unchanged [25]. A second Italian study (n = 1078) similarly surveyed households during March–April 2020 [26]. It showed that respondents spent more on food per week over lockdown (an average of €132 per week compared with €110 pre-Covid), likely due to more food being consumed at home. Making shopping lists to plan food purchases increased from 59% pre-Covid to 86.5% during lockdown. The latter study points to lacking ‘food management habits and behaviour’ as the key reasons for pre-Covid food waste figures, which according to survey responses, reduced from ~10% before COVID-19 to 6.3%.
A Dutch study undertaken between 8–17 May 2020 surveyed 1500 participants (41.8% male, 58.7% female, and 91% middle-to-high income earners) about food planning, buying, preparing, and storing behaviour, as well as self-reported food waste [27]. It found that 26% of respondents self-declared a lower volume of food waste at home over lockdown. The reduction in food waste for this group of consumers can be explained where respondents’ increasingly planned their food in advance before going to the shop: (mean pre-COVID-19: 4.9 vs. mean during lockdown of 5.3, p < 0.001 *) as correlated with an increased use of shopping lists, the purchase of non-perishable food items, and a reduction in impulse-buying). Further, ~40% ate at home more often, with 26% cooking more often during COVID-19 than before, and 20% spending more time on meal preparation. Interestingly, most participants (70–79%) declared that they wasted just as much food as before COVID-19, despite these other behavioural changes. Of those who did discard less (particularly fresh fruits, vegetables, and leftovers), most listed having ‘eaten everything they bought’ as the primary reason for reducing waste.
In Japan, a COVID-19 food waste survey (n = 1959) [28] showed that regions highly impacted by the pandemic (often metropolitan areas) appeared to be more prudent and austere about their food purchasing, considering the amount, type, and cost of domestic food waste. In contrast, residents in low-impact regions appeared to buy more ‘excessive’/’unnecessary’ food since the pandemic was declared. Buying more food than usual due to fear or anxiety, storing more food than before the lockdown, and improvising when buying groceries seemed to increase the food waste reported by the participants in a similarly oriented Spanish study (n = 6293) [29]. These findings chime with a Tunisian study (n = 300), which reported that the most cited reasons for discarding food were overbuying, overcooking, and inappropriate food storage [30].

1.4. Study Objectives

The main aim of the international survey, the ‘CoronaCookingSurvey’ that this study is embedded in was to explore the self-perceived changes in adult food related behaviour due to COVID-19 lockdown restrictions [31]. The current paper examined the data from Aotearoa NZ only (named the ‘Covid Kai Survey’) [20]. We aimed to investigate the influence of the national response to COVID-19 lockdown conditions on household food waste and correlated behaviours.
Specifically, the study objectives were: (1) to examine how lockdown affected levels of food waste in this sample; (2) to examine the demographic predictors of food waste before and during lockdown; (3) to investigate how cooking confidence, time availability, and meal planning is related to food waste before and during lockdown.

2. Materials and Methods

2.1. Study Design

This paper is one from a larger project that analyses COVID-19′s effects on food consumption and related behaviours [31]. The anonymous online questionnaire was designed by researchers at the University of Antwerp (Belgium). Data collection for the NZ sample was undertaken by researchers from The University of Auckland and The University of Victoria Wellington in Aotearoa New Zealand. See the Data Availability Statement for details on both studies.

2.2. Setting

The anonymous, online Covid Kai Survey was open to participants from 24 April to 13 May 2020 (20 days), while New Zealand was under COVID-19 Alert Levels 4 and 3 restrictions for the first time. The median time of lockdown for participants in the Covid Kai survey was 40 days. Data were collected in Qualtrics XM survey software. Recruitment was through convenience/snowball sampling with advertising on social media and through networks. For full details on the Covid Kai survey see Gerritsen et al. [20]. We aimed to recruit as widely as possible among the adult population and monitored responses by demographic groups of interest (gender, age, ethnic group, education) at several points during data collection. Further, $1 was donated to The Foodbank Project (the Salvation Army) for every completed survey. Ethical approval for the international study was granted by the Ethics Advisory Committee on Social and Human Science at the University of Antwerp on 16 April 2020 (ref: SHW_20_46) and the Aotearoa New Zealand arm of the study by the University of Auckland Human Participants Ethics Committee on 24 April 2020 for three years (ref: 024607).

2.3. Participants

All participants were adults: 18 years or older, resident in NZ, with no further restrictions on participation. Participants in the questionnaire responded based on self-declarations, in real-time, to questions about COVID-19 food waste related behaviours, while the control was based on self-declarations of matching queries about food waste and related behaviours pre-Covid.

2.4. Variables

Sociodemographic variables include: gender (female, male, gender diverse); age (<30 years, 30 to <50 years, 50 to <70 years, and, 70+ years); ethnicity (New Zealand European/Other (NZEO); Māori, Pacific, Asian); tertiary education (yes, no); household with children (yes, no); and two questions about general financial difficulty which include employment situation before and during lockdown (full, part, students, no work); struggling to have money for food (rarely, sometimes, frequently).
Food waste habits were assessed by one question “how often do you throw away (leftover) food?”. Cooking confidence was assessed by the question “How often do you feel confident about cooking a variety of healthy meals”. Cooking skills were assessed by the question “How often do you try a new recipe”. Finally, meal planning was assessed by the questions “How often do you plan meals ahead of time” and “How often do you make shopping lists”. Barriers to cooking were considered with the variables of time and cooking confidence, with the statement “Cooking skills are frequently a barrier to cooking and “Time is frequently a barrier to cooking. All statements were on a 7-point scale from ‘never’ to ‘every time’. Respondents were asked each set of items twice, reporting their behaviour before the COVID-19 crisis and at that moment (during the COVID-19 lockdown).

2.5. Statistical Methods

For inferential purposes, the food waste variable was dichotomised to represent ‘low food waste’ (‘never’, ‘very rarely’, or ‘rarely’ threw out food) and ‘higher food waste’ (‘sometimes’, ‘frequently’, ‘very frequently’ or ‘every time’ threw out food). Proportions of participants who were in these categories before and during lockdown were reported. These were also reported by demographic variables, with a chi-squared test to determine if low food waste was dependent on demographics.
Odds ratios were estimated for the odds of higher food waste compared with low food waste by several predictor variables (cooking confidence, cooking skills, time available, and meal planning). In addition, logistic regression models were used, adjusted for age, ethnicity, employment, whether they have enough money for food, and whether the household had children.

3. Results

3.1. Survey Completion: Participants and Descriptive Data

The survey closed with n = 4104 entries. Spam responses indicated by the software programme were removed (n = 81), along with n = 2 respondents who gave implausible ages (as the rest of their survey answers may have been unreliable) and those that were resident outside Aotearoa New Zealand (n = 28). Those that did not complete the relevant questions from the survey were excluded from the analyses in this paper (n = 965). The median (IQR) time taken to complete the survey was 30 min (23–42 min). Respondent characteristics are summarised in Table 1 and described in detail in Gerritsen et al. [20].
Survey responses from n = 3028 adults (age range: 18–87 years) were used in the analyses. One-third of surveys (n = 1012) were completed under Alert Level 4, and 66.6% under Alert Level 3 (n = 2016). Time since the start of lockdown ranged from 31 days to 51 days (median: 40 days). Most respondents were female, with a tertiary education qualification, and identified as NZ European ethnicity. We know from Gerritsen et al., [20] (p. S10) that ‘the majority of respondents (n = 2158, 71.3%) were responsible for the household grocery shopping both before and during lockdown’. The mean age of participants was 44.3 years (SD: 14.0), with the largest proportion in the 30 to less than 50-year age category (Table 1). Households ranged from sole occupant to 13 members, with a median of three people per household (25th/75th percentile: 2/5).

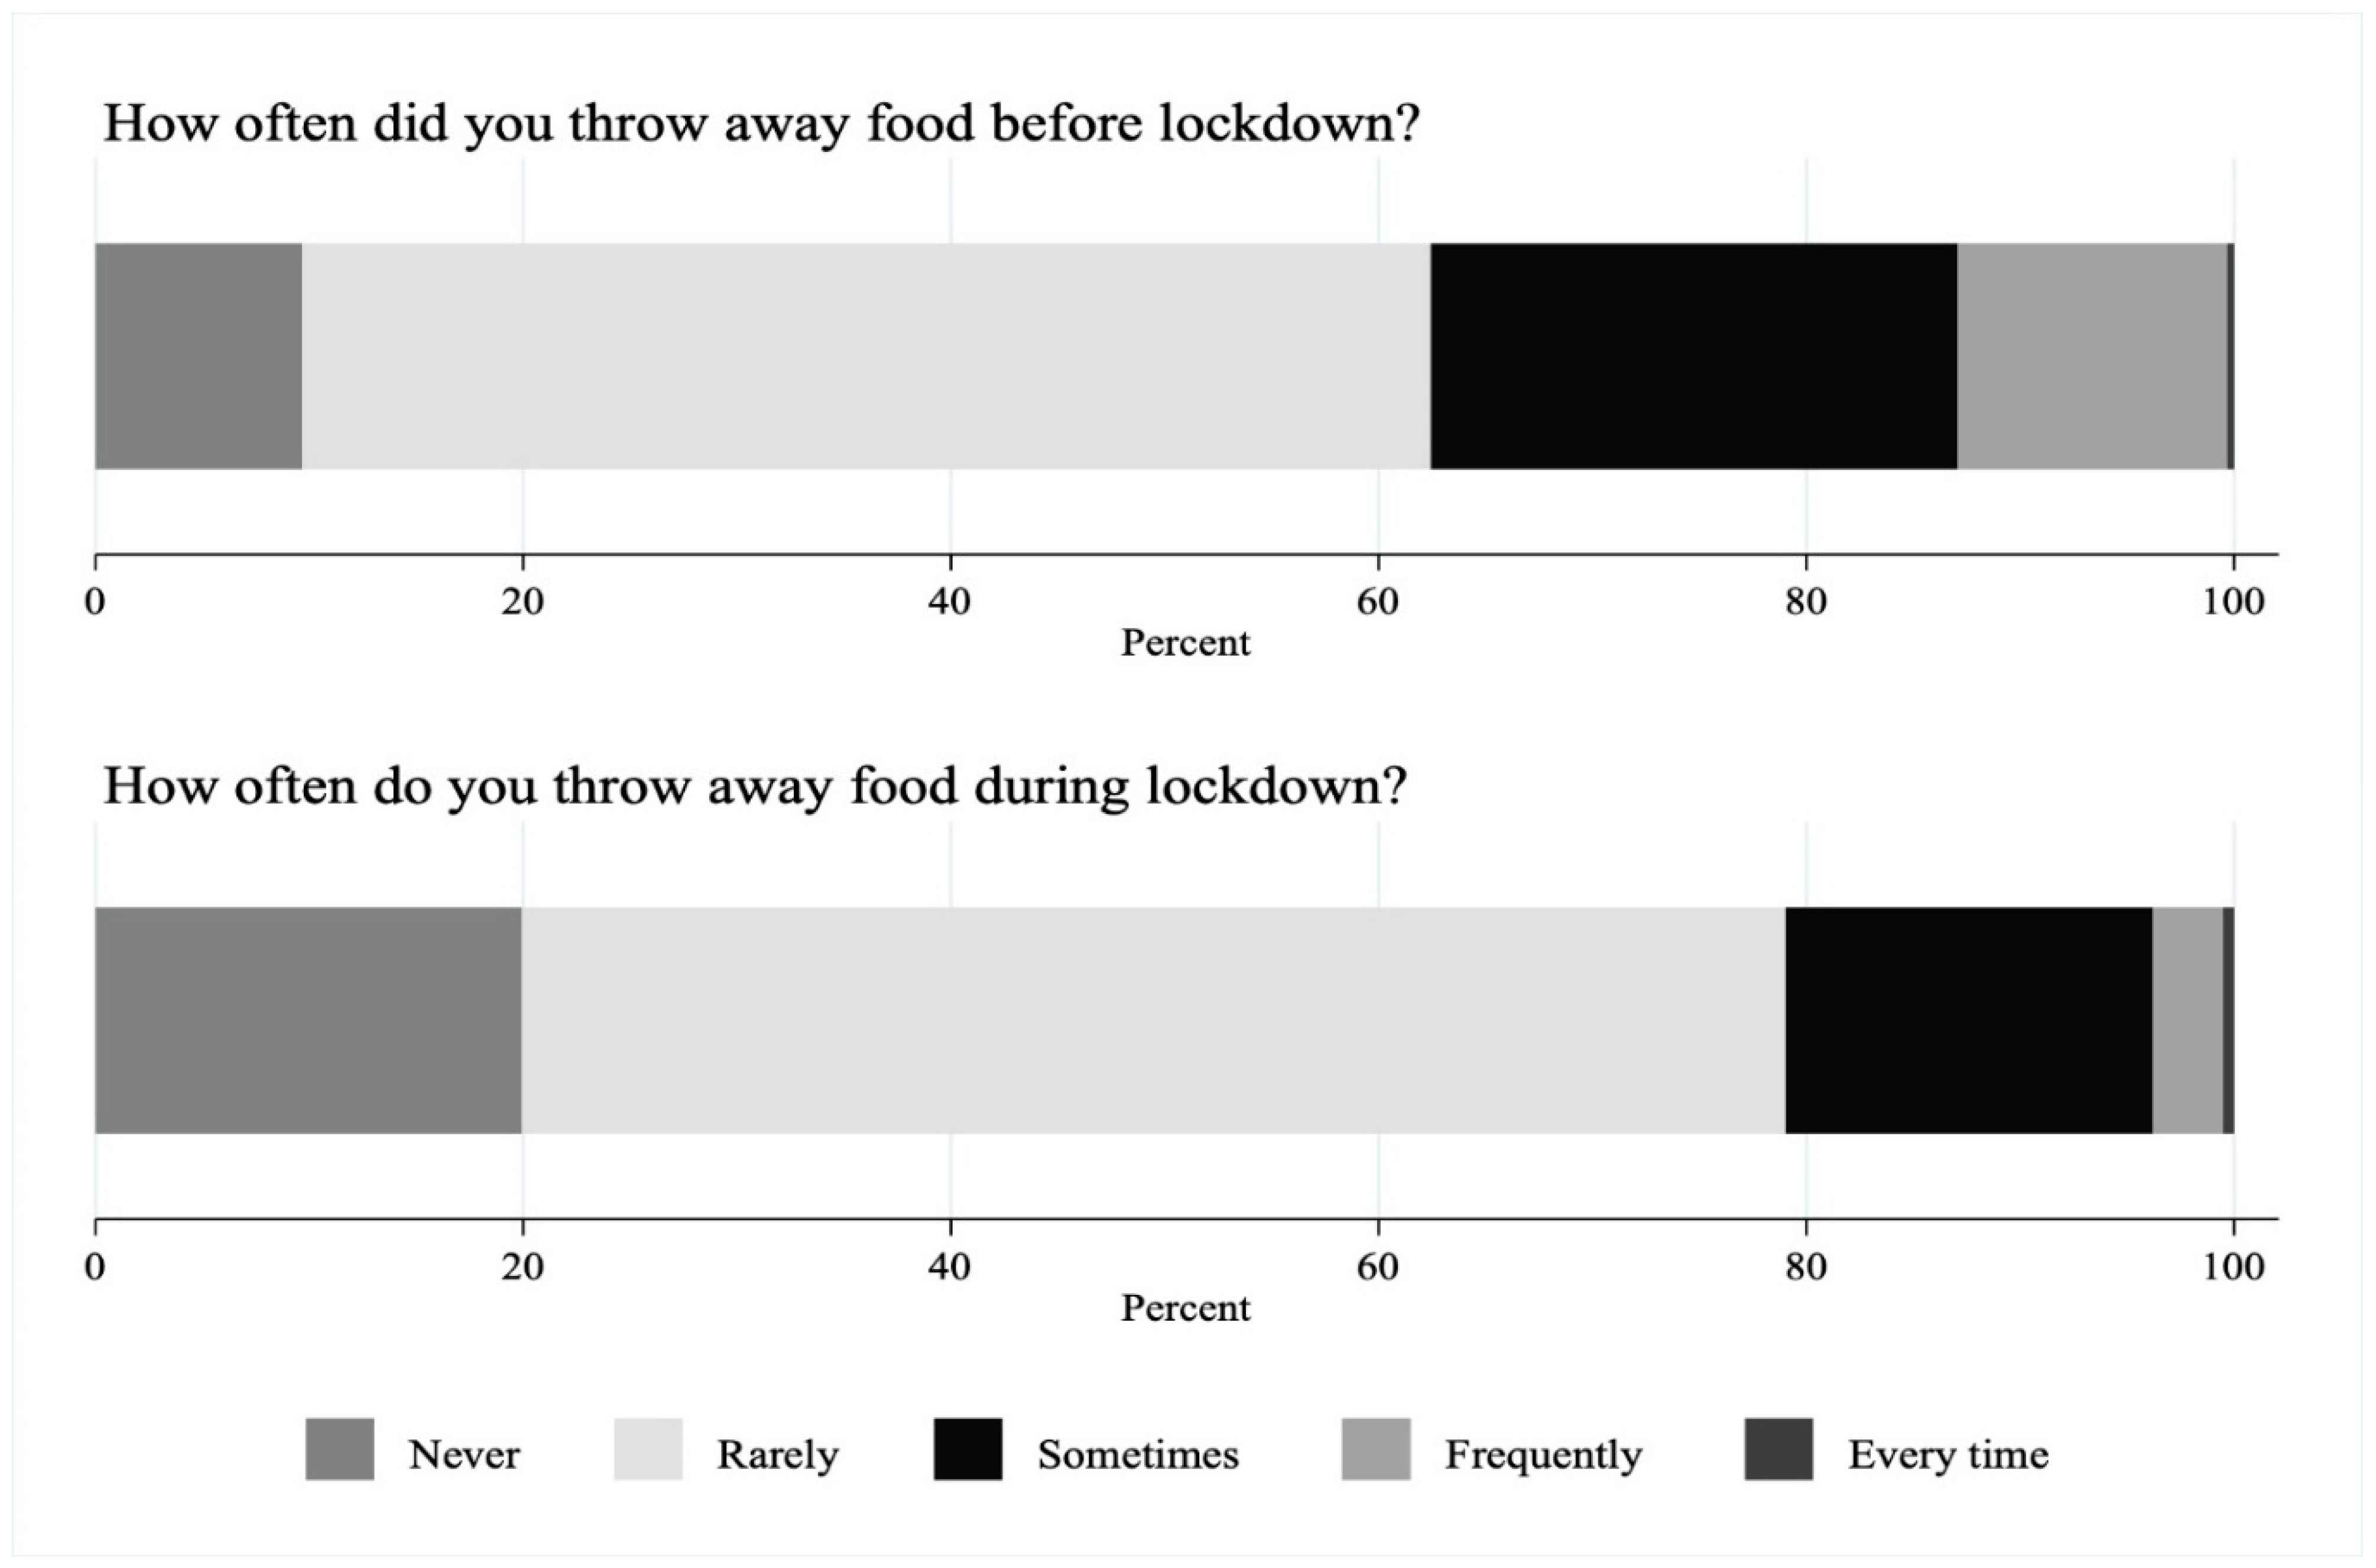
3.2. Changes to Self-Declared Food Disposal Due to Lockdown

3.2.1. Food Waste Changes

Before lockdown, almost two thirds (62.7%) of the sample claimed to ‘rarely or never’ waste food, which rose to nearly 80% during lockdown (Figure 1). The proportion of respondents that claimed they never threw food away in each time period approximately doubled, during lockdown.
When examining the changes in food waste behaviour from before lockdown to during lockdown, 1290 (45.1%) respondents decreased their frequency of food waste during lockdown; 1573 (54.9%) did not change their frequency of food waste during lockdown; and 165 (5.5%) increased their frequency of food waste during lockdown. Disaggregating lockdown ‘levels’, food waste did not appear to differ between Level 3 and Level 4 lockdown (79.8% and 77.6% low food waste, respectively; p = 0.162).

3.2.2. Food Waste and Demographic Characteristics

Food wastage tended to be more frequent in those aged 30–50 years pre-Covid (Table 2), however this was not the case during lockdown. Indeed, participants aged 30–50 years were more likely to decrease their food wastage during lockdown, compared with other age groups (Table 2). There was no evidence that gender or tertiary education were related to food wastage. Those of Asian ethnicity tended to have less frequent food wastage than those from other ethnic groups (Table 2). Participants in full-time employment reported more frequent food waste behaviours before and during lockdown (Table 2), however these participants were also more likely to decrease their food waste behaviours during lockdown (Table 2). During lockdown, 30% and 29% of those who frequently or sometimes struggled to have money for food threw out food ‘sometimes or more’; compared with only 20% of those who rarely struggled to have money for food (p < 0.001, Table 1). We comment on this in Section 4.3. Households with children had more frequent food wastage than those without children, before and during lockdown, but were more likely to decrease food waste during lockdown.

3.3. Food Waste and Household Cooking Behaviours

Cooking Experimentation

Cooking confidence was related to food waste. Pre-Covid, the likelihood of wasting food was considerably lower among those who frequently felt confident about cooking a variety of healthy meals compared with those who did not (OR = 0.37). This relationship remained during lockdown (Table 3).
Respondents with low self-reported cooking skills were much more likely to waste food both pre- and during the Covid lockdown compared with those who did not see their cooking skills as a barrier to cooking. For example, respondents with low cooking skills reported a 2.7 times higher likelihood of sometimes or more often wasting food (OR = 2.66) compared with a nearly three times higher likelihood during Covid lockdown (OR = 2.87).

3.4. Household Food Waste and Meal Planning

3.4.1. Planning Meals Ahead

Pre-Covid, those who frequently planned meals ahead of time were half as likely to waste food compared with those who did not (OR = 0.49). The odds of more food waste for people who plan meals ahead was also 43% less likely under COVID-19 lockdown conditions (OR = 0.57).
In terms of the use of shopping lists to plan meals, the pre-Covid and during Covid responses were similar (OR = 0.51 and OR = 0.48 respectively) suggesting little change to the low likelihood of wasting food for those who use shopping lists to plan their meals.

3.4.2. Time

Perceived availability of time was an important factor for frequency of food waste, where people for whom time was frequently a barrier to cooking pre-Covid had a 95% increase in the likelihood of (sometimes or more often) wasting food (OR = 1.95) compared with those for whom time was not a barrier. During lockdown, time pressured individuals had a 49% increase in the likelihood of (sometimes or more often) wasting food (OR = 1.49).

4. Discussion

4.1. Key Results

Here we revisit the study objectives.
(1)
Regarding the examination of how lockdown affected levels of food waste in the sample, we found that lockdown conditions reduced food waste, except participants who struggled to have money for food who were more likely to waste food during lockdown than before.
(2)
With regards to examining the demographic predictors of food waste before and during lockdown we found that food waste was more likely for the older participants, who worked less than fulltime, and had no children.
(3)
We found that both pre- and during-Covid lockdown, high cooking confidence translated to reduced food waste. Time pressures were a clear predictor of increased food waste. Meal planning (not impulse buying, using shopping lists etc.,) correlated with low food waste both before and during COVID-19.

4.2. Limitations

There are two main caveats to the validity of using questionnaires for measuring food waste [32] where respondents self-declare their behaviours: the value–action gap and social desirability bias.

4.2.1. The Value–Action Gap

The value–action gap is a recognised phenomenon in social research where an individual may create an intention to perform a behaviour, while that intention does not always lead to performing a behaviour. This fissure between intention and behaviour is widely discussed in the literature as the behaviour–intention gap, concern–behaviour gap or more commonly the value–action gap [33,34,35,36]. The gap between intention and behaviour has been suggested to be as simple as someone forgetting or changing their mind [33] or the consequence of barriers that prevent the performance of a behaviour [33,36]. Different cultures experience different barriers to performing a behaviour. Barriers may result from cultural worldviews or meaning systems, such as those that normalise disposing of leftover food. However, these cultural values could equally work to minimise or eliminate barriers [36]. People with different cultural values will also respond differently to the same information, and thus different cultural groups will require tailored interventions.

4.2.2. Social Desirability Bias

Social desirability bias is a tendency of survey respondents to answer questions in a way that they believe will be viewed favourably by others [37]. It manifests in over-reported “good behaviour” or under-reported “bad”, or undesirable behaviour, and is problematic in research with self-declared responses. Previous research has shown the measured food waste is only weakly correlated with self-reported waste [38]. In this study, self-declaration was necessary due to the unpredictable nature of COVID-19 and the inability to retrospectively capture actual behaviours in the past in a consistent fashion. However, the anonymous nature of the current study and the collapsing of responses into binary categories for analyses may have attenuated this issue somewhat [39].

4.3. Interpretation of Findings

To put Aotearoa NZ’s food waste in a global context, it has been found that household food waste per capita is similar across high-income, upper-middle-income and lower-middle-income countries [1]. From a national perspective the food waste trends during COVID-19 lockdown conditions reinforced some previously observed patterns: Where our study found that during the COVID-19 lockdown households who wasted food less frequently were more likely to be on average older, and have no children, the most similar and most contextually comparable survey of food waste conducted in non-lockdown times [16] (p. 31) agreed, indicating that over-65 only households generated lower quantities of both ‘avoidable’ food waste and overall food waste, per household, than younger households [16] (p. 31). There were no prior comparable statistics for household food waste against workload of inhabitants, though the 2018 reports [16,17] did show that high annual income (NZ $100,000 per annum or more) households tended to generate higher volumes of household food waste (p. 27), which we believe also corroborates our study’s findings.
Schmidt’s [40] work on food waste recognised that in non-Covid circumstances there are particular motivations to reduce domestic food waste as a household money-saving strategy. Such international examples show us that in COVID-19 times, household austerity measures and food waste are correlated. Many people in NZ (and a quarter of our respondents) lost income during the lockdown [20], suggesting that many would have been trying to save money and make food last, therefore the general self-reported reduction in household food waste seems plausible. New Zealand showed severe disruption to many social services and provision of basic needs (housing, food, income) contributing to an exacerbation of existing food insecurity from the year 2020 due to COVID-19 conditions [41,42]. Suggested solutions to address economic losses associated with food waste have, in prior studies, included focussing on reducing perishable fruit and vegetable over-purchasing for home consumption [43]. We know from Gerritsen et al., [20] (p. S11) that during Aotearoa NZ’s COVID-19 lockdown, the most commonly stocked up on item was vegetables (with more than half of respondents self-declaring that they stocked up on this food category).
This relationship is not simple however, where these motivations have been seen elsewhere to be offset by the inconvenience of time and effort [44] spent, for example, in planning meals through listing, scheduling, and, in shopping for groceries in advance [31] (p. 54). Further, Schmidt and Matthies’ work [45] has shown that the most effective possible interventions for reducing food waste would tackle: an increased consumption of leftovers, improved literacy around the use of ‘expired/ suboptimal food’, and changes to shopping habits that might predicate surplus food relative to needs.
Pre-Covid, respondents who found food preparation too time consuming were twice as likely to waste food ‘sometimes or often’ (OR = 2.0) and this likelihood decreased during COVID-19 lockdown (OR = 1.7). We might interpret these responses to mean that over lockdown either food preparation became less time consuming (potentially due to increasing familiarity with preparation over time), and/or there was more time available to prepare food and therefore that pressure eased. Despite time pressures, practices that redirected food away from waste improved.
This suggests that individuals responding to the survey (many of whom were the key food planners/preparers for the households they represent, and overwhelmingly women) reduced their food waste in conjunction with COVID-19 conditions, even those for whom lack of time was a key contributor to the waste problem previously. As noted in Gerritsen et al. [20] and De Backer et al. [31], having more time to prepare foods meant that many experienced increased cooking and baking enjoyment. Although the changes in food waste found in this research were not large, there was an overall shift toward waste reduction.
An ability to experiment could explain reduced food waste, where, for example: an agility around using leftovers when there has been a case of overcooking, around using surplus produce when there has been an event of over purchasing, or knowing how to safely cook expiring produce, would save that food from the bin. Overcooking, over purchasing and poor storage were all named as key contributors to food waste internationally e.g., [29,31]. In relation to meal planning, a Lebanese case study from 2018 shows that in non-Covid times, an increased frequency of dining outside the home correlated with increased food wastage [46]. Our data agreed with this, but the conditions of COVID-19 make this a curious relationship. During COVID-19 lockdowns in New Zealand our data show that people were cooking more and eating more inside the home, which concurred with reduced food waste households. However, what was not captured in this study was the equivalent rise in the purchase of take-aways when lockdown conditions enabled many nimble restaurants to ‘pivot’ to contactless delivery to people’s homes. It appeared, though, that those who planned their meals with shopping lists have equally low likelihoods of wasting food, both before and during COVID-19.
During lockdown, participants who struggled to acquire money for food generated food waste more frequently than those who did not struggle. We raise the possibility that food waste increases in this demographic are related to what Poppendieck [47] calls the ‘ins’ of food aid, namely: insufficiency; inappropriateness; nutritional inadequacy; instability; inaccessibility; inefficiency; and indignity. A limitation of this study is that the study questionnaire does not ask whether respondents were the recipients of food aid, or related questions, and therefore we cannot comment further on this pattern, though we see it as an area for further research. We might also consider this anomaly as a response to the very busy, stressful, and potentially chaotic nature of households that were experiencing food insecurity during the COVID-19 lockdown. There is good evidence that the pandemic has exacerbated economic inequities (disproportionately affecting those on low incomes) [48,49] with related downstream effects. We know, for example, that adults experiencing food insecurity are more likely to have depression and anxiety [50].

4.4. Implications and Limitations of the Study

In these findings we provide a mandate for a return to a well-resourced food preparation and cooking education (what has been known as ‘Home Economics’) at primary and secondary school level. In NZ while this is a mainstream subject, and in the New Zealand Curriculum [51] it is stated that “It is expected all children will have had the opportunity to learn practical cooking skills by the end of year 8” (p. 22), in fact there is variation in delivery. In a 2017 report, [52] only 13% of teachers surveyed identified the planning and preparation of a meal as an objective in the material they taught. As a subject, it was observed in a recent study [53] to have a lack of teacher supply, and poor estimation of its value by others in the teaching profession/community. Based on correlations to food waste in this study, cooking confidence, experience and skills make a significant difference to individuals’ competence for reducing food waste.
The results of this study also support calls for a national waste reduction target in NZ. Adoption of a national waste reduction target in line with SDG 12.3 would contribute to an estimated halving of per capita global retail and consumer food waste, as well as the reduction of waste in production and supply, by 2030. It is worth noting, however, that there are also risks that the setting of such a reduction target would (as for so many multilateral sustainability targets set) manifest in ways that gerrymander the ontologies of ‘what is food waste’ as articulated in the Introduction to this paper, and which have made quantifying food waste in this country (and comparing food waste between countries), so challenging. Because such a target would require government to commit (limited) funding to realising or making progress towards such a reduction, is it crucial that methods of measuring food waste are standardised. This would enable scientists, public and policy makers to have more faithful progress metrics and comparators. This is in line with recommendations 16 and 17 of the comprehensive ‘Mirosa report’ which point to a need for clear definitions, targets and indicators of food waste [14] (p. 46). These improvements in food waste measurement should lead to food waste being included in NZ’s environmental reporting.

5. Conclusions

While the more than 3000 responses to the Aotearoa New Zealand Covid Kai survey suggest that the COVID-19 lockdown restrictions brought with it a reduction in (self-declared) household food waste, the story is more complicated than this. Total sample analysis shows that COVID-19 lockdown conditions meant that: (1) there was less food waste overall; (2) more people cooked with leftovers more often, and there was more frequent experimentation by more people in cooking and baking, (3) more planning went into food shopping; and, (4) those with cooking proficiency wasted less. In fact, consistently (pre- and during COVID-19 lockdown conditions) high cooking confidence translated to reduced waste outcomes. These results are consistent with numerous international studies. When we drill down into the detail, participants who wasted food less frequently during lockdown were more likely to be older, work less than fulltime, and have no children. The 30–50-year age group which was least likely to waste food during COVID-19 lockdown, had been the age group most likely to waste more food in non-Covid times. Further, of the total sample, while 45.1% of respondents did decrease their frequency of food waste during lockdown, more than half of the sample surveyed claimed they did not change their frequency of food waste during lockdown.
Notably, participants who struggled to acquire money for food were more likely to waste food during lockdown than before lockdown. This is despite international research that shows a reduction in food waste in lower socio-economic groups as an austerity response to financial pressures. Reasons for this unexpected outcome are unclear, and though we might speculate that they could relate to complexities of food aid receipt over COVID-19 lockdown conditions, and/or exacerbated busyness and stress related to managing a household in COVID-19 times, this finding presents an area that requires further research.
While the use of self-declared online questionnaire data: is imperfect in the data rendered due to self-declaration; can be limited in reach; and, can result in international inconsistency in data analysis thus making comparison complicated, this international food waste data collection exercise emerging out of the COVID-19 crisis provided an opportunity to gather like data with like, and presents an opportunity for longitudinal studies of the same kind. Introducing a national census question on household food waste would also make some progress towards gathering real-time baseline data in non-Covid conditions. It demonstrates the usefulness of such a method for its overall accessibility, affordability, and rapid assessment, showing promise for future large-scale food waste research. NZ’s strategies for waste reduction in times of disruption depend on such data to capture whole systems of food waste, especially at the household level given the significance of domestic food waste as a proportion of total food waste. Further, combining this knowledge with an understanding of the behaviours and attitudes related to food waste in times of crisis, and their correlates, will help inform local and central government and the connections of businesses, organisations, and importantly individuals to take action to reduce food waste.

Author Contributions

Conceptualization, E.L.S., S.G., V.E., R.R., J.H. and L.T.M.; methodology, L.T., P.D., I.C., C.D.B., J.H., S.G., formal analysis, J.H., S.G., R.R., V.E. and E.L.S.; writing—original draft preparation, E.L.S., S.G., V.E., R.R. and J.H., writing—review and editing, E.L.S., S.G., J.H., R.R., V.E., L.T.M., L.T., P.D., I.C. and C.D.B. All authors have read and agreed to the published version of the manuscript.

Funding

The Covid Kai Survey was supported by seed funding from the Food and Health Programme, Faculty of Medical and Health Sciences, The University of Auckland. The Corona Cooking Survey was funded by the Research Foundation Flanders (G047518N) and Flanders Innovation and Entrepreneurship (HBC.2018.0397). These funding sources had no role in the design of the study, the analysis and interpretation of the data or the writing of, nor the decision to publish the manuscript. VE was funded by a Lotteries Health Research Postdoctoral Fellowship #128096.

Institutional Review Board Statement

The study was conducted according to the guidelines of the Declaration of Helsinki, and approved by the Ethics Advisory Committee on Social and Human Science at the University of Antwerp (ref: SHW_20_46 on 16 April 2020), and the Aotearoa New Zealand arm of the study by the University of Auckland Human Respondents Ethics Committee (ref: 024607, 24 April 2020).

Informed Consent Statement

Informed consent was obtained from all subjects involved in the study.

Data Availability Statement

The ‘CoronaCookingSurvey’ international dataset and study protocol are available on the open access data sharing platform: https://osf.io/nz9xf/files/ (accessed on 6 September 2021). The Aotearoa NZ ‘Covid Kai Survey’ data are available on reasonable request.

Acknowledgments

The authors wish to thank everyone that participated in the Covid Kai Survey, and those who shared the survey advertisements among their networks. The authors wish to acknowledge the Research Foundation Flanders (G047518N) and Flanders Innovation & Entrepreneurship (HBC.2018.0397) for their support with the Corona Cooking Survey international study, and other members of the Corona Cooking Survey team, in particular: Kathleen Van Royen, Sara Pabian, Viktor Proesmans, Jules Vrinten, Katrien Maldoy, Karolien Poels, Heidi Vandebosch, Hilde Van den Bulck, Maggie Geuens,. Iris Vermeir, Nelleke Teughels, Liselot Hudders, Christophe Matthys and Tim Smits.

Conflicts of Interest

No potential conflict of interest was reported by the author(s).

References

  1. Food and Agriculture Organization of the United Nations. Technical Platform on the Measurement and Reduction of Food Loss and Waste. Available online: http://www.fao.org/platform-food-loss-waste/news/detail/en/c/1378973/ (accessed on 1 June 2021).
  2. United Nations Environment Programme. Food Waste Index Report. 2021. Available online: https://www.unep.org/resources/report/unep-food-waste-index-report-2021 (accessed on 14 May 2021).
  3. Östergren, K.; Gustavsson, J.; Bos-Brouwers, H.; Timmermans, T.; Hansen, O.; Møller, H.; Anderson, G.; O’Connor, C.; Soethoudt, H.; Quested, T.; et al. FUSIONS Definitional Framework for Food Waste; FUSIONS—The Swedish Institute for Food and Biotechnology: Stockholm, Sweden, 2014; Available online: https://www.eu-fusions.org/phocadownload/Publications/FUSIONS Definitional Framework for Food Waste 2014.pdf (accessed on 1 August 2021).
  4. Goodman-Smith, F.; Mirosa, M.; Skeaff, S. A mixed-methods study of retail food waste in New Zealand. Food Policy 2020, 92, 101845. [Google Scholar] [CrossRef]
  5. Cicatiello, C.; Franco, S.; Pancino, B.; Blasi, E. The value of food waste: An exploratory study on retailing. J. Retail. Consum. Serv. 2016, 30, 96–104. [Google Scholar] [CrossRef]
  6. Dora, M.; Biswas, S.; Choudhary, S.; Nayak, R.; Irani, Z. A system-wide interdisciplinary conceptual framework for food loss and waste mitigation strategies in the supply chain. Ind. Mark. Manag. 2020, 93, 492–508. [Google Scholar] [CrossRef]
  7. European Commission, Roadmap to a resource efficient Europe. White Paper from the Commission to the European Parliament, the Council, the European Economic and Social Committee and Committee of the Regions; COM: Brussels, Belgium, 2011; Volume 0571, pp. 1–25. [Google Scholar]
  8. Buzby, J.C.; Hyman, J. Total and per capita value of food loss in the United States. Food Policy 2012, 37, 561–570. [Google Scholar] [CrossRef]
  9. National Food Waste Strategy: Halving Australia’s Food Waste by 2030. Available online: https://www.environment.gov.au/system/files/resources/4683826b-5d9f-4e65-9344-a900060915b1/files/national-food-waste-strategy.pdf (accessed on 1 August 2021).
  10. Whitehead, P.; Parfitt, J.; Bojczuk, K.; James, K. Estimates of Waste in the Food and Drink Supply Chain; Waste and Resources Action Programme (WRAP): Branbury, UK, 2013. [Google Scholar]
  11. Parfitt, J.; Woodham, S.; Swan, E.; Castella, T.; Parry, A. Quantification of Food Surplus, Waste and Related Materials in the Grocery Food Supply Chain; Waste and Resources Action Plan (WRAP): Banbury, UK, 2016; Available online: http://www.refreshcoe.eu/wp-content/uploads/2017/06/WRAP-Quantification-of-food-surplus-and-waste-May-2016-Final-Report-Summary.pdf (accessed on 1 February 2019).
  12. Eriksson, M. Retail Food Wastage: A Case Study Approach to Quantities and Causes. Licentiate Thesis, Swedish University of Agricultural Sciences, Uppsala, Sweden, 2012. Available online: https://pub.epsilon.slu.se/9264/1/eriksson_m_121126.pdf (accessed on 1 February 2019).
  13. BIOIS. Preparatory Study on Food Waste across EU 27. European Commission (DG ENV) Directorate C-Industry; Final Report; 2010. Available online: https://ec.europa.eu/environment/eussd/pdf/bio_foodwaste_report.pdf (accessed on 6 September 2021).
  14. Environment Select Committee of New Zealand. Briefing to Investigate Food Waste in New Zealand. Report of the Environment Committee March 2020. Available online: https://www.wasteminz.org.nz/wp-content/uploads/2020/03/Final-report-Briefing-to-investigate-food-waste-in-New-Zealand-1.pdf (accessed on 8 June 2021).
  15. WasteMINZ. National Food Waste Prevention Study. 2014. Available online: https://www.wasteminz.org.nz/wp-content/uploads/WasteMINZ-National-Food-Waste-Prevention-Study-National-Report.pdf%20 (accessed on 1 August 2021).
  16. WasteMINZ. New Zealand Food Waste Audits. 2018. Available online: https://lovefoodhatewaste.co.nz/wp-content/uploads/2019/02/Final-New-Zealand-Food-Waste-Audits-2018.pdf (accessed on 8 June 2021).
  17. WasteMINZ. New Zealand Food Waste Campaign Evaluation. 2018. Available online: https://lovefoodhatewaste.co.nz/wp-content/uploads/2019/02/FINAL-WasteMINZ-National-Food-Waste-Prevention-Study-2018.pdf (accessed on 8 June 2021).
  18. Parfitt, J.; Barthel, M.; Macnaughton, S. Food waste within food supply chains: Quantification and potential for change to 2050. Phil. Trans. Biol. Sci. 2010, 365, 3065–3081. Available online: http://rstb.royalsocietypublishing.org/content/365/1554/3065 (accessed on 27 August 2021). [CrossRef] [Green Version]
  19. Uniteforrecovery, Alert System Overview. Available online: https://uniteforrecovery.govt.nz/covid-19/covid-19-alert-system/alert-system-overview/ (accessed on 10 June 2020).
  20. Gerritsen, S.; Egli, V.; Roy, R.; Haszard, J.; De Backer, C.; Teunissen, L.; Cuykx, I.; Decorte, P.; Pabian, S.; Van Royen, K.; et al. Ngapuhi, Ngāti Whātua, Te Uri o Hua, Te Rarawa Seven weeks of home-cooked meals: Changes to New Zealanders’ grocery shopping, cooking and eating during the COVID-19 lockdown. J. R. Soc. N. Z. 2020. [Google Scholar] [CrossRef]
  21. New Zealand Herald. Coronavirus: Long Queues at Supermarkets after First NZ Case Confirmed, Experts Urge Calm. Available online: https://www.nzherald.co.nz/nz/coronavirus-long-queues-at-supermarkets-after-first-nz-case-confirmed-experts-urge-calm/WYAXXJGOBDYZMZQDEFQUEEOYJ4/ (accessed on 1 June 2021).
  22. New Zealand Herald. COVID 19 Coronavirus: Foodbanks Running Dry under Lockdown. Available online: https://www.nzherald.co.nz/nz/covid-19-coronavirus-foodbanks-running-dry-under-lockdown/74TD5D2YLNAUYO66XHVXT2SXQQ/ (accessed on 22 April 2020).
  23. Ministry of Social Development. Evidence Brief: The Impacts of COVID-19 on One-Off Hardship Assistance–July 2020. Available online: https://www.msd.govt.nz/documents/about-msd-and-our-work/publications-resources/statistics/covid-19/the-impacts-of-covid-19-on-one-off-hardship-assistance.pdf (accessed on 1 June 2021).
  24. WRAP (2021) Citizens and Food during Lockdown. Available online: https://wrap.org.uk/resources/report/citizens-and-food-during-lockdown# (accessed on 7 April 2021).
  25. Pappalardo, G.; Cerroni, S.; Rodolfo, M.; Nayga, R.M., Jr.; Yang, W. Impact of COVID-19 on household food waste: The case of Italy. Front. Nutr. 2020. [Google Scholar] [CrossRef] [PubMed]
  26. Principato, L.; Secondi, L.; Cicatiello, C.; Mattia, G. Caring more about food: The unexpected positive effect of the COVID-19 lockdown on household food management and waste. Socio-Econ. Plan. Sci. 2020, 7, 291. [Google Scholar] [CrossRef]
  27. van der Haar, S.; Zeinstra, G.; Bos-Brouwers, H.; Janssen, A. COVID-19 and the Effects on Dutch Consumers’ Food Waste Behaviour. Available online: https://www.wur.nl/en/show/Factsheet-Voedselverspilling-COVID-19.htm (accessed on 1 June 2021).
  28. Qian, K.; Javadi, F.; Hiramatsu, M. Influence of the COVID-19 pandemic on household food waste behavior in Japan. Sustainability 2020, 12, 9942. [Google Scholar] [CrossRef]
  29. Vidal-Mones, B.; Barco, H.; Diaz-Ruiz, R.; Fernandez-Zamudio, M.-A. Citizens’ food habit behavior and food waste consequences during the first COVID-19 lockdown in Spain. Sustainability 2021, 13, 3381. [Google Scholar] [CrossRef]
  30. Jribi, S.; Ben Ismail, H.; Doggui, D.; Debbabi, H. COVID-19 virus outbreak lockdown: What impacts on household food wastage? Environ. Dev. Sustain. 2020, 22, 3939–3955. [Google Scholar] [CrossRef] [PubMed] [Green Version]
  31. De Backer, C.J.; Teunissen, L.; Cuykx, I.; Decorte, P.; Pabian, S.; Gerritsen, S.; Van Royen, K. An evaluation of the COVID-19 pandemic and social distancing policies in relation to planning, selecting, and preparing healthy meals: An observational study in 38 countries worldwide. Front. Nutr. 2020, 7, 621726. [Google Scholar] [CrossRef] [PubMed]
  32. Giordano, C.; Piras, S.; Boschini, M.; Falasconi, L. Are questionnaires a reliable method to measure food waste? A pilot study on Italian households. Br. Food J. 2018, 120, 2885–2897. [Google Scholar] [CrossRef]
  33. Ajzen, I. Consumer attitudes and behaviour: The theory of planned behaviour applied to food consumption decisions. Ital. Rev. Agric. Econ. 2015, 70, 121–138. [Google Scholar]
  34. Armitage, C.J.; Christian, J. From attitudes to behaviour: Basic and applied research on the theory of planned behaviour. Curr. Psychol. Res. Rev. 2003, 22, 187–195. [Google Scholar] [CrossRef]
  35. Ricci, E.C.; Banterle, A.; Stranieri, S. Trust to go green: An exploration of consumer intentions for eco-friendly convenience food. Ecol. Econ. 2018, 148, 54–65. [Google Scholar] [CrossRef] [Green Version]
  36. Tam, K.P.; Chan, H.W. Environmental concern has a weaker association with pro- environmental behaviour in some societies than others: A cross-cultural psychology perspective. J. Environ. Psychol. 2017, 53, 213–223. [Google Scholar] [CrossRef]
  37. Krumpal, I. Determinants of social desirability bias in sensitive surveys: A literature review. Qual. Quant. 2013, 47, 2025–2047. [Google Scholar] [CrossRef]
  38. Elimelech, E.; Ert, E.; Ayalon, O. Exploring the drivers behind self-reported and measured food wastage. Sustainability 2019, 11, 5677. [Google Scholar] [CrossRef] [Green Version]
  39. Cerri, J.; Thøgersen, J.; Testa, F. Social desirability and sustainable food research: A systematic literature review. Food Qual. Prefer. 2019, 71, 136–140. Available online: https://www.sciencedirect.com/science/article/abs/pii/S095032931830199X (accessed on 27 August 2021). [CrossRef]
  40. Schmidt, K. Explaining and promoting household food waste-prevention by an environmental psychological based intervention study. Resour. Conserv. Recycl. 2016, 11, 53–66. [Google Scholar] [CrossRef]
  41. Healy, S.; Chitranshi, B.; Diprose, G.; Eskelinen, T.; Madden, A.; Santala, I.; Williams, M. Planetary food commons and postcapitalist post-COVID food futures. Development 2020, 63, 277–284. [Google Scholar] [CrossRef] [PubMed]
  42. Dombroski, K.; Diprose, G.; Sharp, E.L.; Graham, R.; Lee, L.; Scobie, M.; Richardson, S.; Watkins, A.; Martin-Neuninger, R. Food for people in place: Reimagining food systems for economic recovery. Sustainability 2020, 12, 9369. [Google Scholar] [CrossRef]
  43. Conrad, Z. Daily cost of consumer food wasted, inedible, and consumed in the United States, 2001–2016. J. Nutr. 2020, 19, 35. [Google Scholar] [CrossRef] [PubMed]
  44. Graham-Rowe, E.; Jessop, D.C.; Sparks, P. Identifying motivations and barriers to minimising household food waste. Resour. Conserv. Recycl. 2014, 84, 15–23. [Google Scholar] [CrossRef] [Green Version]
  45. Schmidt, K.; Matthies, E. Where to start fighting the food waste problem? Identifying most promising entry points for intervention programs to reduce household food waste and overconsumption of food. Resour. Conserv. Recycl. 2018, 139, 1–14. [Google Scholar] [CrossRef]
  46. Mattar, L.; Abiad, M.G.; Chalak, A.; Diab, M.; Hassan, H. Attitudes and behaviors shaping household food waste generation: Lessons from Lebanon. J. Clean. Prod. 2018, 198, 1219–1223. [Google Scholar] [CrossRef]
  47. Poppendieck, J. Sweet Charity? Emergency Food and the End of Entitlement; Viking: New York, NY, USA, 1998. [Google Scholar]
  48. Wolfson, J.A.; Leung, C.W. Food insecurity and COVID-19: Disparities in early effects for US Adults. Nutrients 2020, 12, 1648. [Google Scholar] [CrossRef]
  49. Humpage, L.; Moore, C. Income Support in the wake of COVID-19: Interviews. 2020. Available online: https://www.cpag.org.nz/assets/Covid%2019%20survey%20report%2012%20October%20final.pdf (accessed on 1 August 2021).
  50. Fang, D.; Thomsen, M.R.; Nayga, R.M. The association between food insecurity and mental health during the COVID-19 pandemic. BMC Public Health 2021, 21, 607. [Google Scholar] [CrossRef] [PubMed]
  51. Ministry of Education. The New Zealand Curriculum for English-Medium Teaching and Learning in Years 1–13, Wellington: Learning Media. 2007. Available online: https://nzcurriculum.tki.org.nz/content/download/1108/11989/file/The-New-Zealand-Curriculum.pdf (accessed on 27 August 2021).
  52. Massey Dietetic Students. Year 7 and 8 New Zealand Food Survey. 2017. Massey University. Available online: https://www.vegetables.co.nz/assets/Research/Year-7-and-8-New-Zealand-Food-Survey-Final-L-Henderson.pdf (accessed on 27 August 2021).
  53. Dixon, R. Imagining the Future of Home Economics in New Zealand. Master’s Thesis, University of Canterbury, Christchurch, New Zealand, 2016. Available online: https://ir.canterbury.ac.nz/handle/10092/12810 (accessed on 27 August 2021).
Figure 1. Food waste frequency before and during lockdown (n = 3028).
Sustainability 13 10006 g001
Table 1. Demographic characteristics of the sample and food waste habits before and during lockdown (n = 3028).
Total SampleBefore LockdownDuring Lockdown
n (%)‘Never’ or ‘Rarely’ Threw Out Food‘Sometimes’ or More Threw Out Foodp-Value‘Never’ or ‘Rarely’ Threw Out Food‘Sometimes’ or More Threw Out Foodp-Value
N (% a)3028 (100)1891 (62.5)1137 (37.6) 2393 (79.0)635 (21.0)
Age, mean (SD) years44.3 (14.0)45.1 (14.6)43.1 (12.8)<0.00144.6 (14.1)43.4 (13.6)0.066
Age group, n (% a) <0.001 0.122
<30 years515 (17.0)333 (64.7)182 (35.3) 405 (78.6)110 (21.4)
30 to <50 years1446 (47.8)832 (57.5)614 (42.5) 1120 (77.5)326 (22.5)
50 to <70 years952 (31.4)636 (66.8)316 (33.2) 773 (81.2)179 (18.8)
70+ years115 (3.8)90 (78.3)25 (21.7) 95 (82.6)20 (17.4)
Gender, n (% a) 0.740 0.483
Female2682 (88.6)1675 (62.5)1007 (37.6) 2128 (79.3)554 (20.7)
Male314 (10.4)194 (61.8)120 (38.2) 241 (76.8)73 (23.3)
Gender diverse32 (1.1)22 (68.8)10 (31.3) 24 (75.0)8 (25.0)
Ethnicity, n (% a) 0.007 0.002
NZEO b2507 (82.8)1580 (63.0)927 (37.0) 2005 (80.0)502 (20.0)
Māori320 (10.6)178 (55.6)142 (44.4) 231 (72.2)89 (27.8)
Pacific66 (2.2)37 (56.1)29 (43.9) 46 (69.7)20 (30.3)
Asian135 (4.5)96 (71.1)39 (28.9) 111 (82.2)24 (17.8)
Tertiary education, n (% a) 0.576 0.198
Yes2300 (76.0)1430 (62.2)870 (37.8) 1830 (79.6)470 (20.4)
No728 (24.0)461 (63.3)267 (36.7) 563 (77.3)165 (22.7)
Employment, n (% a) <0.001 <0.001
Full time1604 (53.0)926 (57.3)678 (42.3) 1221 (76.1)383 (23.9)
Part time738 (24.4)484 (65.6)254 (34.4) 610 (82.7)128 (17.3)
Students229 (7.6)158 (69.0)71 (31.0) 183 (79.9)46 (20.1)
No work457 (15.1)323 (70.7)134 (29.3) 379 (82.9)78 (17.1)
Struggle to have money for food, n (% a) 0.425 <0.001
Rarely2648 (87.5)1665 (62.9)983 (37.1) 2125 (80.3)523 (19.8)
Sometimes284 (9.4)170 (59.9)114 (40.1) 201 (70.8)83 (29.2)
Frequently96 (3.2)56 (58.3)40 (41.7) 67 (69.8)29 (30.2)
Household with children, n (% a) <0.001 <0.001
Yes1123 (37.1)630 (56.1)493 (43.9) 849 (75.6)274 (24.4)
No1905 (62.9)1261 (66.2)644 (33.8) 1544 (81.1)361 (19.0)
a Percentages are row percentages except for the first column. b NZEO–New Zealand European and Others.
Table 2. Decreased food waste during lockdown, compared with pre-lockdown, by demographic characteristics (n = 2863 a).
No Change in Food Waste HabitsDecreased Food Waste Habitsp-Value
N (% b)1573 (54.9)1290 (45.1)
Age, mean (SD) years45.1 (14.3)43.5 (13.4)0.003
Age group, n (% b) 0.014
<30 years254 (16.2)222 (17.2)
30 to <50 years732 (46.5)649 (50.3)
50 to <70 years517 (32.9)384 (29.8)
70+ years70 (4.5)35 (2.7)
Gender, n (% b) 0.501
Female1386 (88.1)1154 (89.5)
Male170 (10.8)125 (9.7)
Gender diverse17 (1.1)11 (0.9)
Ethnicity, n (% b) 0.608
NZEO c1303 (82.8)1087 (84.3)
Māori167 (10.6)124 (9.6)
Pacific29 (1.8)27 (2.1)
Asian74 (4.7)52 (4.0)
Tertiary education, n (% b) 0.283
Yes388 (24.7)296 (23.0)
No1185 (75.3)994 (77.1)
Employment, n (% b) 0.002
Full time785 (49.9)732 (56.7)
Part time408 (25.9)296 (23.0)
Students121 (7.7)93 (7.2)
No work259 (16.5)169 (13.1)
Struggle to have money for food, n (% b) 0.693
Rarely1377 (87.5)1136 (88.1)
Sometimes146 (9.3)120 (9.3)
Frequently50 (3.2)34 (2.6)
Household with children, n (% b) 0.011
Yes549 (34.9)510 (39.5)
No1024 (65.1)780 (60.5)
a Only 165 participants increased their food waste during lockdown. Given these small numbers, they are not included here. b Percentages are column percentages. c NZEO–New Zealand European and Others.
Table 3. Cooking confidence, time availability, the use of meal kits, and meal planning related to food waste before and during lockdown (n = 3028).
Predictors of Food Waste aBefore LockdownDuring Lockdown
N (%)Odds Ratio (95% CI) b for ‘Sometimes’ or More Threw Out Foodp-ValueN (%)Odds Ratio (95% CI) b for ‘Sometimes’ or More Threw Out Foodp-Value
Frequently feel confident about cooking a variety of healthy meals2506 (82.8)0.37 (0.31, 0.46)<0.0012641 (87.2)0.37 (0.29, 0.47)<0.001
Cooking skills are frequently a barrier to cooking c97 (3.6)2.66 (1.74, 4.06)<0.00153 (2.0)2.87 (1.63, 5.03)<0.001
Time is frequently a barrier to cooking c 1027 (38.2)1.95 (1.65, 2.31)<0.001149 (5.6)1.49 (1.02, 2.16)0.039
Preparing food was frequently too time-consuming c1326 (49.4)2.00 (1.69, 2.35)<0.001495 (18.4)1.70 (1.35, 2.13)<0.001
Frequently plan meals ahead of time1642 (54.2)0.49 (0.42, 0.57)<0.0012318 (76.6)0.57 (0.47, 0.70)<0.001
Frequently make a list before shopping2186 (72.2)0.51 (0.43, 0.60)<0.0012807 (92.7)0.48 (0.36, 0.64)<0.001
a All statements were measured on a 7-point scale from ‘never’ to ‘every time’ at the same time as the food waste question; these predictor variables were then dichotomised into two groups: “frequently” and “not frequently”. b Odds ratios estimated using logistic regression models adjusted for age, ethnicity, employment, whether they have enough money for food, and whether the household had children and represent the odds ratio for one point higher on the predictor scale. c n = 2686 participants completed these items in the survey. n = 3004 participant completed these items in the survey. Group sizes too small for reliable estimates.
Publisher’s Note: MDPI stays neutral with regard to jurisdictional claims in published maps and institutional affiliations.

