
Tribbles Gene Expression Profiles in Colorectal Cancer
by
 , , ,
, , ,
Mónica T. Fernandes
1,2,3 ,
,
Victor Yassuda
3,
José Bragança
1,2,4,5,
Wolfgang Link
6,
Bibiana I. Ferreira
1,2,4 and
Ana Luísa De Sousa-Coelho
1,2,3,7,* 1
Algarve Biomedical Center Research Institute (ABC-RI), Universidade do Algarve, Campus de Gambelas, 8005-139 Faro, Portugal
2
Algarve Biomedical Center (ABC), Universidade do Algarve, Campus de Gambelas, 8005-139 Faro, Portugal
3
Escola Superior de Saúde (ESS), Universidade do Algarve, Campus de Gambelas, 8005-139 Faro, Portugal
4
Faculdade de Medicina e Ciências Biomédicas (FMCB), Universidade do Algarve, Campus de Gambelas, 8005-139 Faro, Portugal
5
Champalimaud Research Program, Champalimaud Center for the Unknown, 1400-038 Lisboa, Portugal
6
Instituto de Investigaciones Biomédicas “Alberto Sols” (CSIC-UAM), Arturo Duperier 4, 28029 Madrid, Spain
7
Centro de Estudos e Desenvolvimento em Saúde (CES), Universidade do Algarve, Campus de Gambelas, 8005-139 Faro, Portugal
*
Author to whom correspondence should be addressed.
Gastrointest. Disord. 2021, 3(4), 218-236; https://doi.org/10.3390/gidisord3040021
Submission received: 20 August 2021
/
Revised: 29 October 2021
/
Accepted: 3 November 2021
/
Published: 9 November 2021
(This article belongs to the Special Issue Therapeutic Targets for the Treatment of Colorectal Cancer)
Abstract
:Colorectal cancer (CRC) is the third most common cancer and the second leading cause of death due to cancer in the world. Therefore, the identification of novel druggable targets is urgently needed. Tribbles proteins belong to a pseudokinase family, previously recognized in CRC as oncogenes and potential therapeutic targets. Here, we analyzed the expression of TRIB1, TRIB2, and TRIB3 simultaneously in 33 data sets from CRC based on available GEO profiles. We show that all three Tribbles genes are overrepresented in CRC cell lines and primary tumors, though depending on specific features of the CRC samples. Higher expression of TRIB2 in the tumor microenvironment and TRIB3 overexpression in an early stage of CRC development, unveil a potential and unexplored role for these proteins in the context of CRC. Differential Tribbles expression was also explored in diverse cellular experimental conditions where either genetic or pharmacological approaches were used, providing novel hints for future research. This comprehensive bioinformatic analysis provides new insights into Tribbles gene expression and transcript regulation in CRC.
1. Introduction
Colorectal cancer (CRC) is a carcinoma that develops in the colon or rectum, also known as bowel cancer. CRC initiates with the transformation of a normal epithelium to a benign growth on the inner lining of the colon or rectum, named polyp, and progresses through a stepwise accumulation of multiple genetic and epigenetic alterations in key genes, in a context of a growing genetic instability [1,2].
Sporadic colorectal cancers have traditionally been described to develop through two molecular pathways: the conventional adenoma–carcinoma and the serrated pathway [3]. The conventional pathway is linked to chromosomal instability (CIN), which refers to a high rate of gains or losses of whole, or large portions of chromosomes, and is observed in 70 to 75% of sporadic CRC [3]. This pathway is characterized by the accumulation of mutations in specific oncogenes, including Epithelial Growth Factor Receptor (EGFR), KRAS proto-oncogene GTPase (KRAS), Cyclooxygenase 2 (COX2), and B-Raf proto-oncogene serine/threonine kinase (BRAF), and tumor suppressor genes, such as Adenomatous Polyposis Coli (APC), Deleted in Colon Cancer (DCC), Phosphatase and Tensin Homolog (PTEN), and Tumor Protein 53 (TP53) [4]. The serrated pathway accounts for about 25–30% of sporadic colorectal cancers [3,5] and involves BRAF mutations and microsatellite instability (MSI) [6,7,8,9], which is a consequence of the inactivation of DNA mismatch repair (MMR) genes such as MutL Homolog 1 (MLH1), MutL Homolog 2 (MSH2), and PMS1 Homolog 2, Mismatch Repair System Component (PMS2) [5,10]. A subset of serrated lesions seem to evolve through the classical pathway as they show altered KRAS, p53, and APC, and MSI is not present [11], suggesting the existence of a third pathway to CRC development [12].
The identification of molecular alterations and other mechanisms contributing to CRC development and progression have led to improved therapies for CRC patients, allowing the development and use of targeted therapies, in addition to the classical therapies (i.e., surgery, chemotherapy, and radiotherapy). Nevertheless, despite the current developments in prevention, diagnosis, and treatment, CRC is the third most common cancer and the second leading cause of death due to cancer in the world [13]. Therefore, the identification of new targets is sorely needed, especially for metastatic disease, for which the treatment options are scarce and less is known regarding targetable molecular mechanisms.
Tribbles (TRIB) proteins have emerged as potential therapeutic targets for the treatment of several cancer types. There are three mammalian Tribbles, TRIB1 (C8FW or SKIP1), TRIB2 (C5FW), and TRIB3 (NIPK, SKIP3, or LKW), which contain both unique and shared features. It is thought that eukaryotic Tribbles evolved from a common ancestor, the human TRIB2 homolog, and all contain a highly atypical pseudokinase domain fused to a unique docking site in an extended C tail that binds to ubiquitin E3 ligases [14,15]. Why three distinct Tribbles pseudokinases evolved in human cells, and how they mechanistically support diverse signaling pathways, is currently not fully understood.
Tribbles were reported to regulate intracellular cell signaling through two main mechanisms. One involves positioning proteins and controlling their E3 ligase-dependent ubiquitination. The other involves a scaffolding function, which operates to integrate and modulate canonical MAPK and AKT modules. Through these mechanisms, Tribbles are involved in the regulation of the cell cycle, differentiation, metabolism, proliferation, and cell stress [14,15]. Tribbles are also associated with pathologic states, including metabolic and neurological diseases, and several types of cancer [14,15,16,17,18]. In cancer, Tribbles were shown to have both oncogenic and tumor suppressive roles, dependent on the family member and cellular context, suggesting a tightly regulated balance between these proteins [14,15].
All three Tribbles proteins were previously implicated in CRC in independent studies [19] and have been pointed as novel potential pharmacological targets for therapeutic intervention [20,21,22]. However, TRIB1, TRIB2, and TRIB3 expression was not concurrently evaluated in the same samples or datasets, precluding the identification of potential complementary, synergistic, and exclusive mechanisms involving the three Tribbles in CRC. Based on the sequence similarities between human Tribbles, their well conserved pseudokinase domain [16], along with common interacting proteins [23,24], a certain degree of overlapping functions might be expected. Previously, both inverse and correlative relationships [25], and competition between Tribbles members [26], were identified.
In this work, we analyzed TRIB1, TRIB2, and TRIB3 expression simultaneously in the same sets of CRC data from the available gene expression arrays from GEO database [27,28]. With this strategy, we aimed at further elucidating redundancy and specificity of Tribbles in CRC formation and progression. Moreover, we also intended to potentially identify novel therapeutic strategies and pathways involved in the modulation of Tribbles expression. Though our main focus was to evaluate human samples, we have also integrated the results from established cell lines’ datasets. Overall, our results can provide novel hints for clinical decision making in patients with CRC.
2. Results
2.1. Tribbles Expression in Colon Cancer Tissues and Cell Lines
Several authors have already individually identified the amplification and/or overexpression of each of the Tribbles proteins in CRC samples compared to matched normal colon tissue [19]. Although different studies have used bioinformatic tools to study the mRNA levels of Tribbles in CRC, there are no studies that simultaneously evaluate TRIB1, TRIB2, and TRIB3 gene expression within the same datasets.
2.1.1. Colon and Rectal Cancer Tissues Compared to Controls
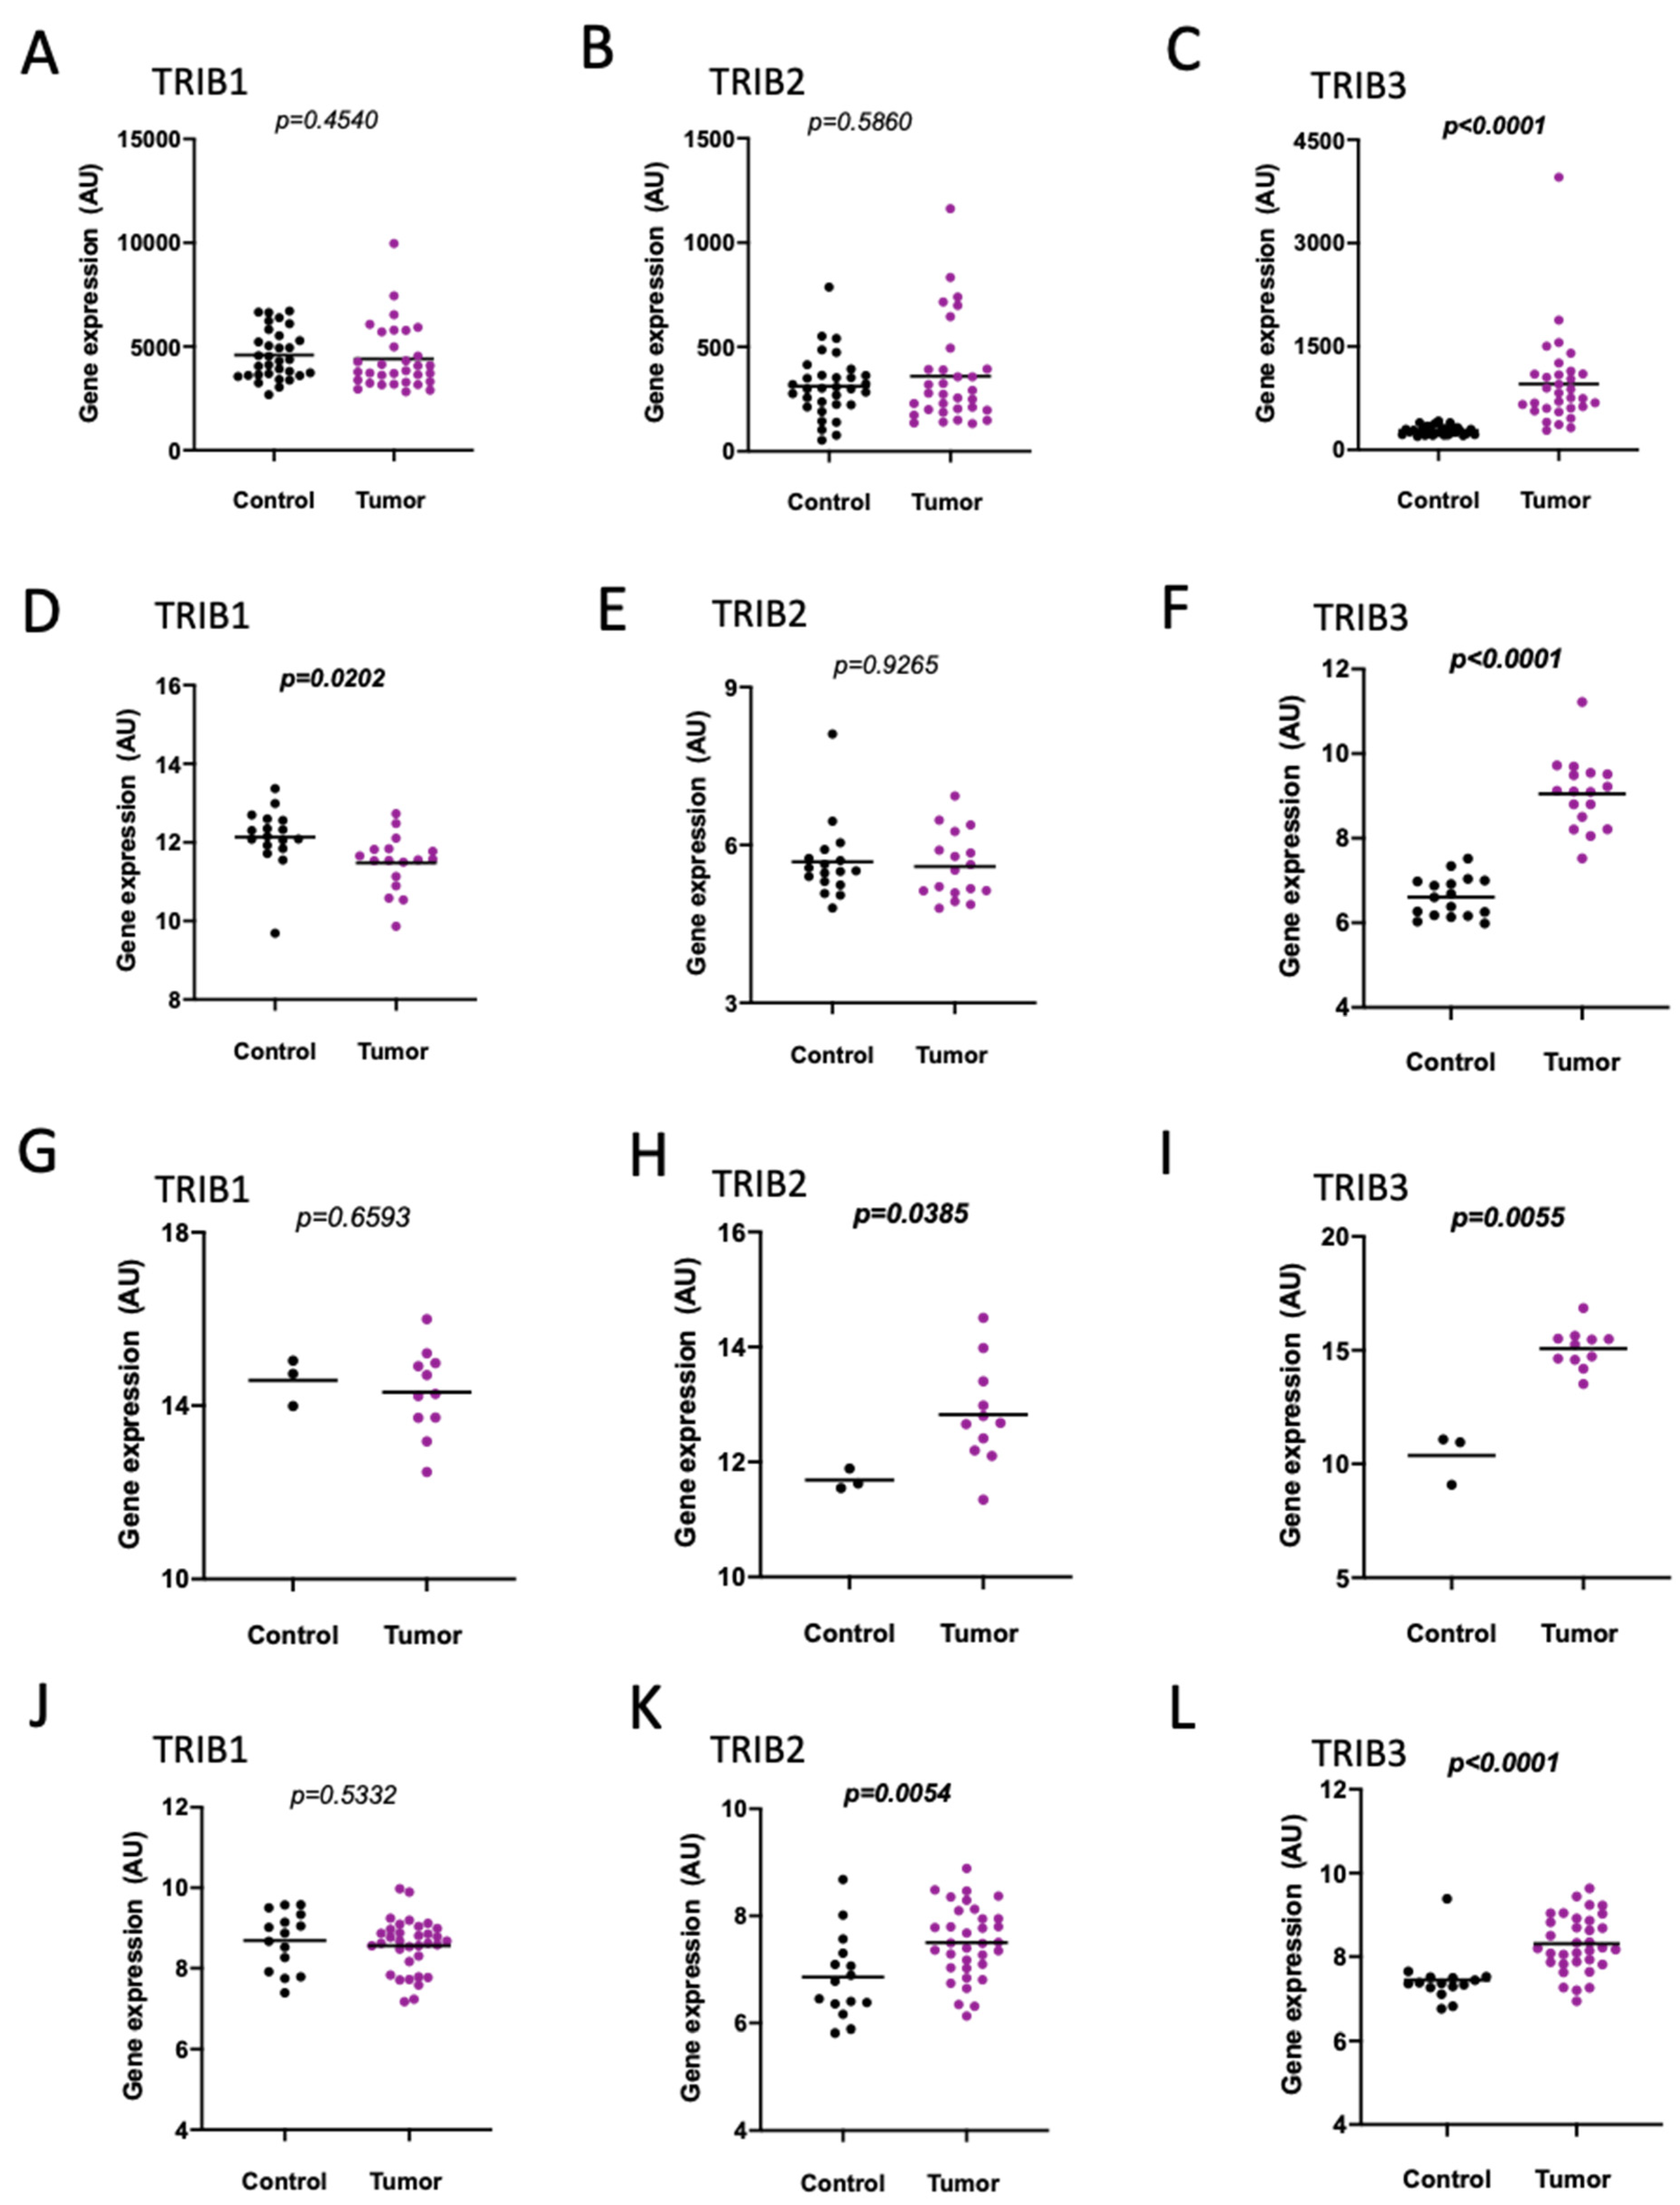
In the GEO profiles, we identified four independent datasets that compared human colon tumors to either normal colonic mucosa from healthy donors or paired, adjacent normal tissue from patients (Table S1). Independent paired analysis of colorectal adenomatous polyps/adenomas and normal colon mucosa (GDS2947) [29] (Figure 1A–C and Figure S1A,B), and of CRC tumors and adjacent non-cancerous tissues (GDS4382) [30] (Figure 1D–F and Figure S2A–C), showed a significant upregulation of TRIB3 in tumors (Figure 1C,F, Figures S1B and S2C). By contrast, either no significant differences (Figure 1A and Figure S2A) or a decrease in TRIB1 in tumors (Figure 1D), and no significant differences (Figure 1B,E and Figure S1A) or a relative increase (Figure S2B) in TRIB2 gene expression in tumors, was observed. Interestingly, both TRIB2 and TRIB3 were significantly overexpressed in CRC (Figure 1H,I), i.e., between non-paired samples of primary CRC tumors from male patients, 69 to 87 years old at diagnosis (late onset) vs. controls (GDS5232) [31,32], while TRIB1 expression did not differ (Figure 1G). In agreement, both TRIB2 and TRIB3 (but not TRIB1) were upregulated in colorectal adenocarcinomas with microsatellite instability (MSI CRCs) (Figure 1J–L and Figure S3), when compared to non-paired normal colonic mucosa (GDS4515) [33]. Supporting the previous findings, we found a significantly higher expression of TRIB2 and TRIB3 in CRC tumors as compared to adjacent non-cancerous tissues in the TCGA colon and rectum adenocarcinoma (COADREAD) cohort (Figure S4A–C).
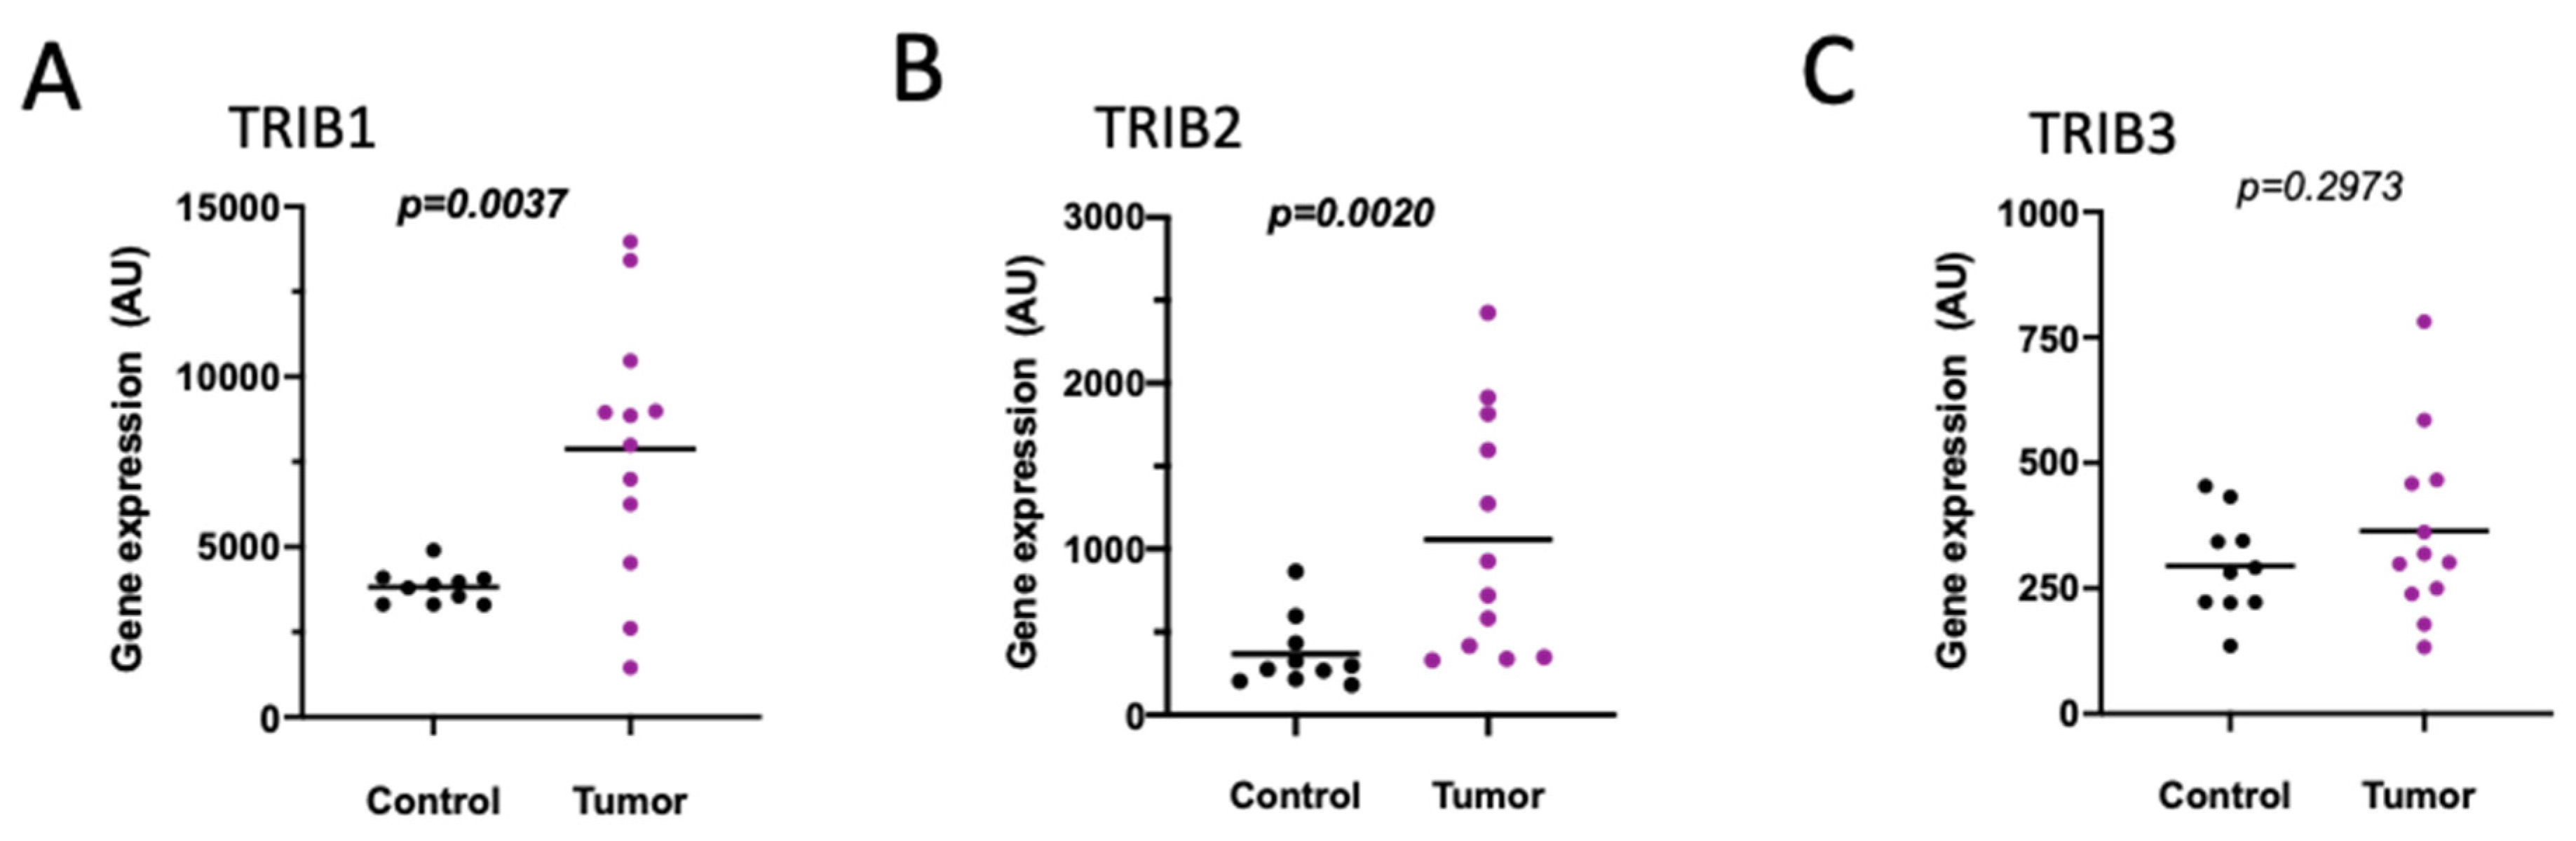
When compared to the normal mucosa of healthy individuals, both TRIB1 and TRIB2 (but not TRIB3) were 2-fold overexpressed in normal-appearing colonic mucosa adjacent to tumors of CRC patients below 50 years of age and without a previous family history of CRC (GDS2609) [34] (Figure 2A–C and Figure S5).
It has been previously suggested that young- vs. late-onset CRC have different molecular profiles, namely at the mutation status or mRNA expression levels [35,36]. From a set of CRC samples that included both male and female patients stratified by age at diagnosis, we found that TRIB2, though not TRIB1 nor TRIB3, was preferentially expressed in primary CRC tumors from female patients diagnosed with CRC at an early age (28 to 53 years of age) when compared with patients diagnosed at a later age (69 to 87 years) (GDS5232) (Figure S6A–C). However, this difference in TRIB2 expression was not observed in male patients. Only TRIB3 was upregulated in male patients diagnosed at an advanced age compared to early onset diagnose (GDS5232) (Figure S6D–F). To confirm these findings, we analyzed the TCGA colon and rectum adenocarcinoma (COADREAD) cohort and did not find any significant difference regarding TRIB1, TRIB2 and TRIB3 expression in CRC tumors between young and old patients, neither in females nor in males (Figure S7A–F).
Serrated and conventional colorectal carcinomas (CRCs) present not only morphological differences, but also distinct gene expression profiles [12]. Nevertheless, no statistically significant differences in the gene expression of Tribbles were identified between these two types (GDS2201) (Table S2).
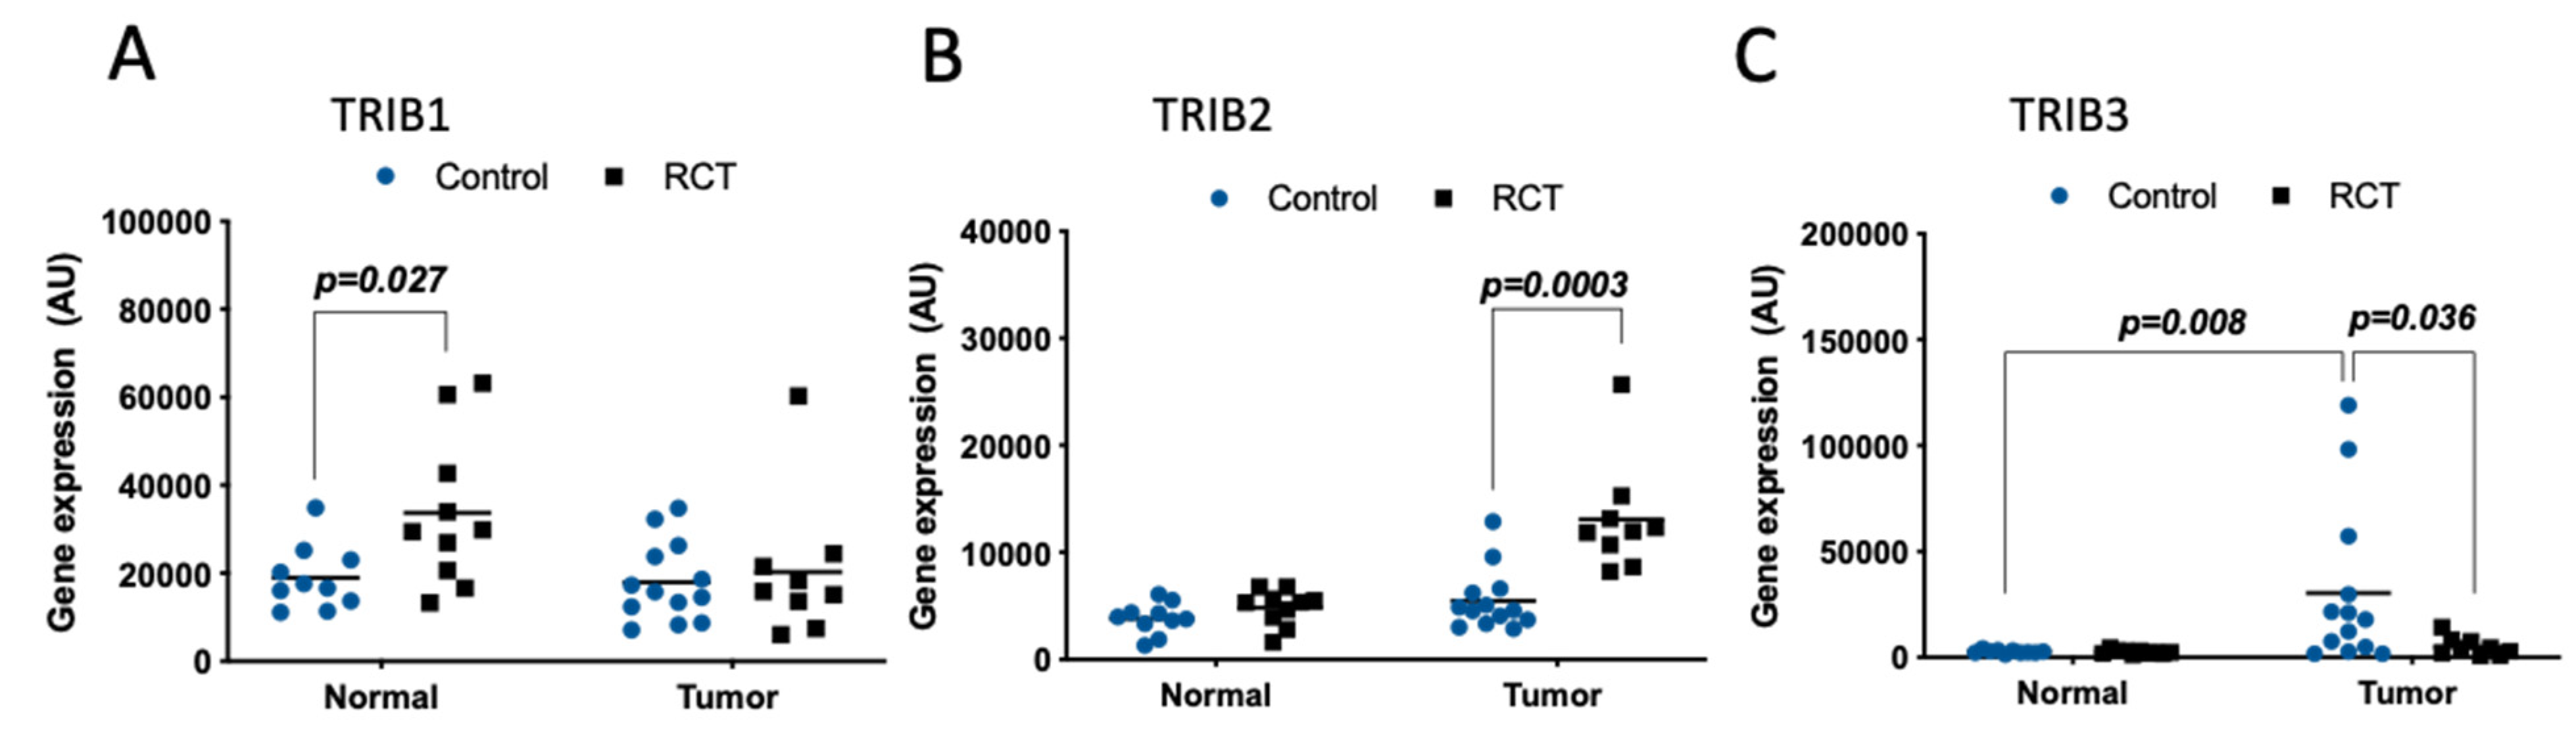
Rectal samples from normal tissue and tumor specimens from a Norwegian cohort, including patients with resectable adenocarcinoma of the rectum before and after treatment, were also compared (GDS3756) [37]. As for most of the CRC data presented above (Figure 1), TRIB1 levels were equivalent in normal vs. tumor samples without treatment (control) (Figure 3A, blue circles). However, TRIB1 levels were higher in normal (but not in tumor) tissue after preoperative neoadjuvant radio-chemotherapy (RCT) treatment (p = 0.027), compared to the normal not treated tissue (control) (Figure 3A). TRIB2 was expressed at a higher level in tumors subjected to RCT, compared not only to tumors from non-treated patients (p = 0.0003), but also to normal tissue, regardless of exposure to RCT (Figure 3B). TRIB3 was significantly overexpressed in rectal cancer before treatment, compared to the normal tissue (p = 0.008) (Figure 3C, blue circles). Importantly, this difference in TRIB3 levels was not found in tumors subjected to preoperative neoadjuvant RCT, as TRIB3 expression was significantly lower than in tumors not subjected to RCT and comparable to normal tissue (treated and not treated) (Figure 3C, black squares). These data showed that only TRIB3 was upregulated in rectal tumors vs. normal tissue. Interestingly, TRIB2 and TRIB3 transcripts in rectal cancer were conversely regulated upon RCT.
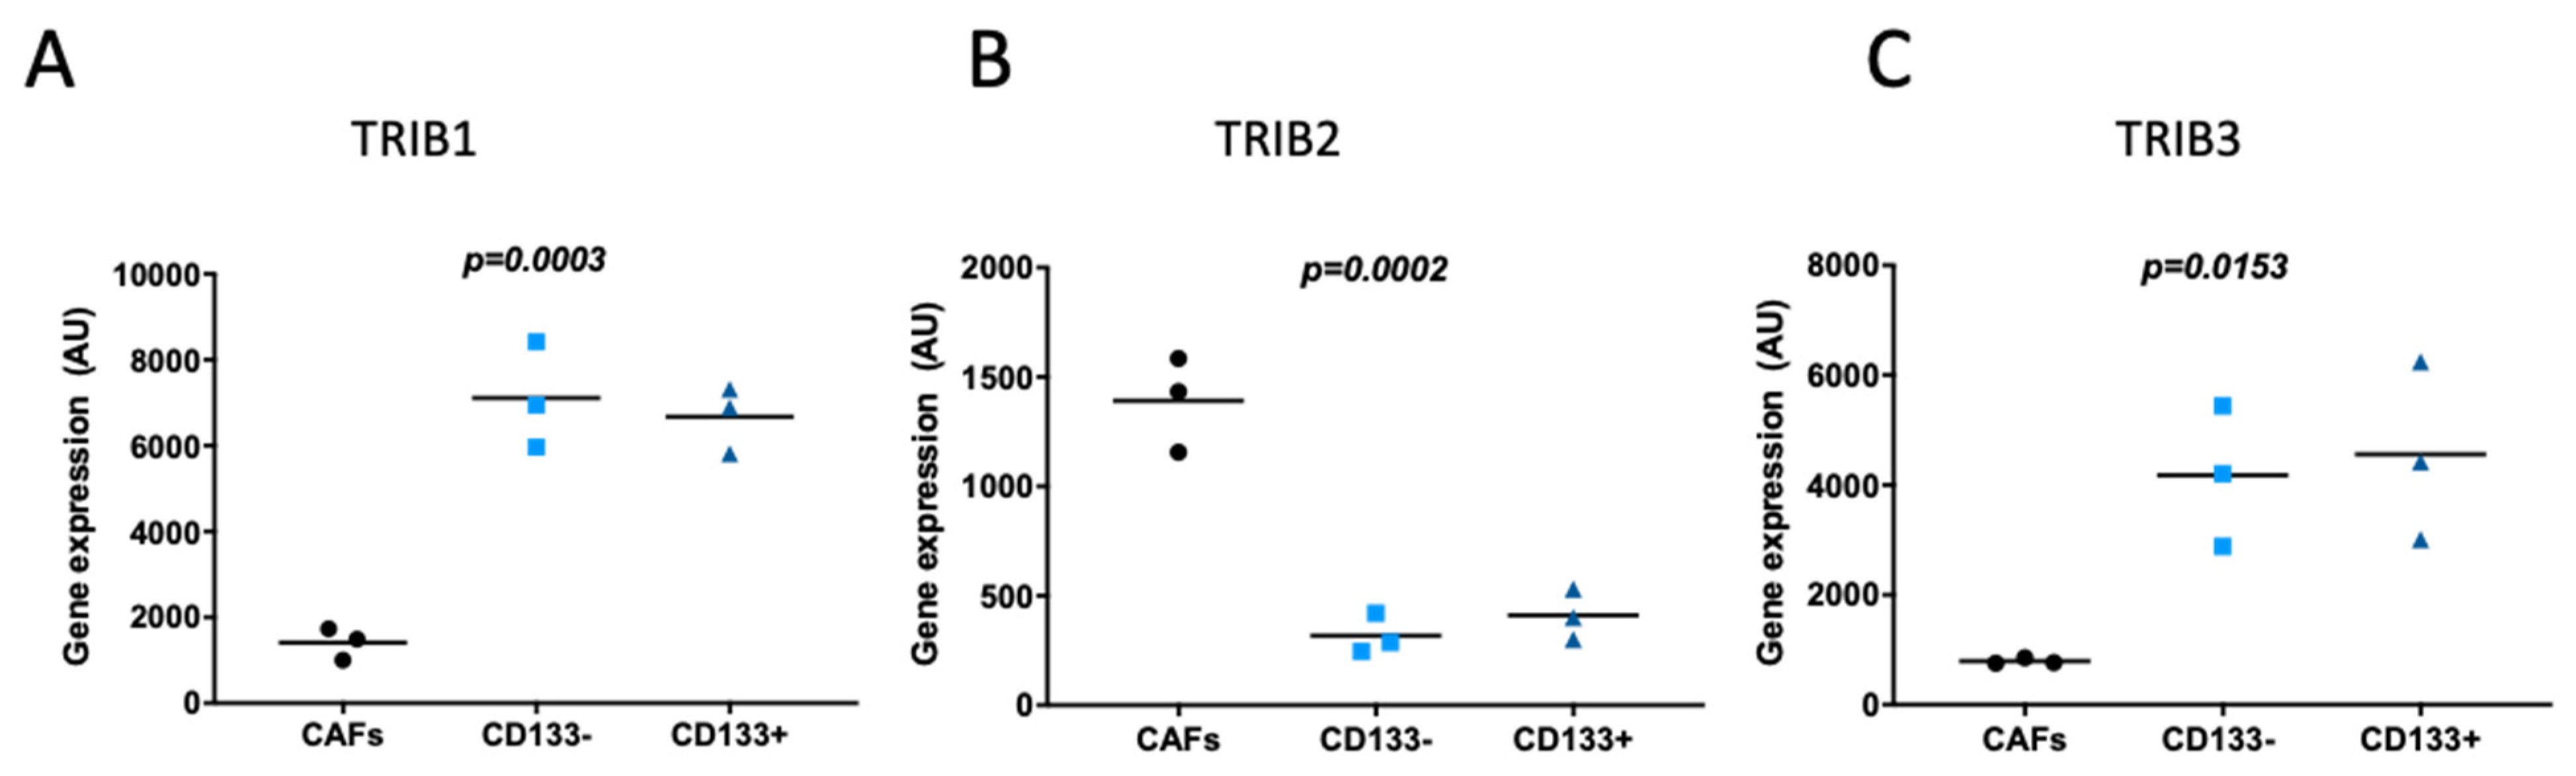
CRC stem cells were previously implicated in tumor initiation, metastases, and resistance to therapy [38]. CD133, a transmembrane glycoprotein has been widely used as a marker to identify and isolate CRC stem cells [39,40]. When analyzing either CD133-positive or CD133-negative CRC cells, and their neighboring carcinoma associated fibroblasts (CAFs), isolated from the same stage II patient sample (GDS4385) [41], TRIB1 (Figure 4A) and TRIB3 (Figure 4C and Figure S8B) showed both higher expression in CRC compared to CAFs. By contrast, expression of TRIB2 was significantly lower in CRC cells (Figure 4B and Figure S8A). In either case, the gene expression of Tribbles was not different between CD133-positive and CD133-negative CRC cells (Figure 4A–C and Figure S8A,B), suggesting that Tribbles transcriptional regulation is independent of cell stemness. Additional values from a second TRIB1 probe were not considered for analysis as they were below the detection call.
2.1.2. Colon Cancer Cells Lines
The use of immortalized cancer cell lines as an in vitro model system allows for a further understanding of tumorigenesis. For this reason, we analyzed the NCI-60 panel of established cancer cell lines, which included seven different colon cancer cell lines (COLO205, HCC2998, HCT116, HCT15, HT29, KM12, and SW620) (GDS4296) [42,43,44,45], and also specifically compared SW480 (primary tumor) and SW620 (metastatic) isogenic colon cancer cell lines (GDS756) [46]. Globally, our main results indicate that TRIB2 was preferentially expressed in COLO205 cells (Table S3), and when comparing isogenic cells, SW480 expressed higher levels of TRIB1 and TRIB2, while SW620 metastatic cells displayed greater TRIB3 levels (Table S3). These findings could provide a useful guidance to cell-based experiments to investigate the role of Tribbles in colon cancer.
2.2. Tribbles Expression Association to Colon Cancer Progression, Staging, and Metastasis
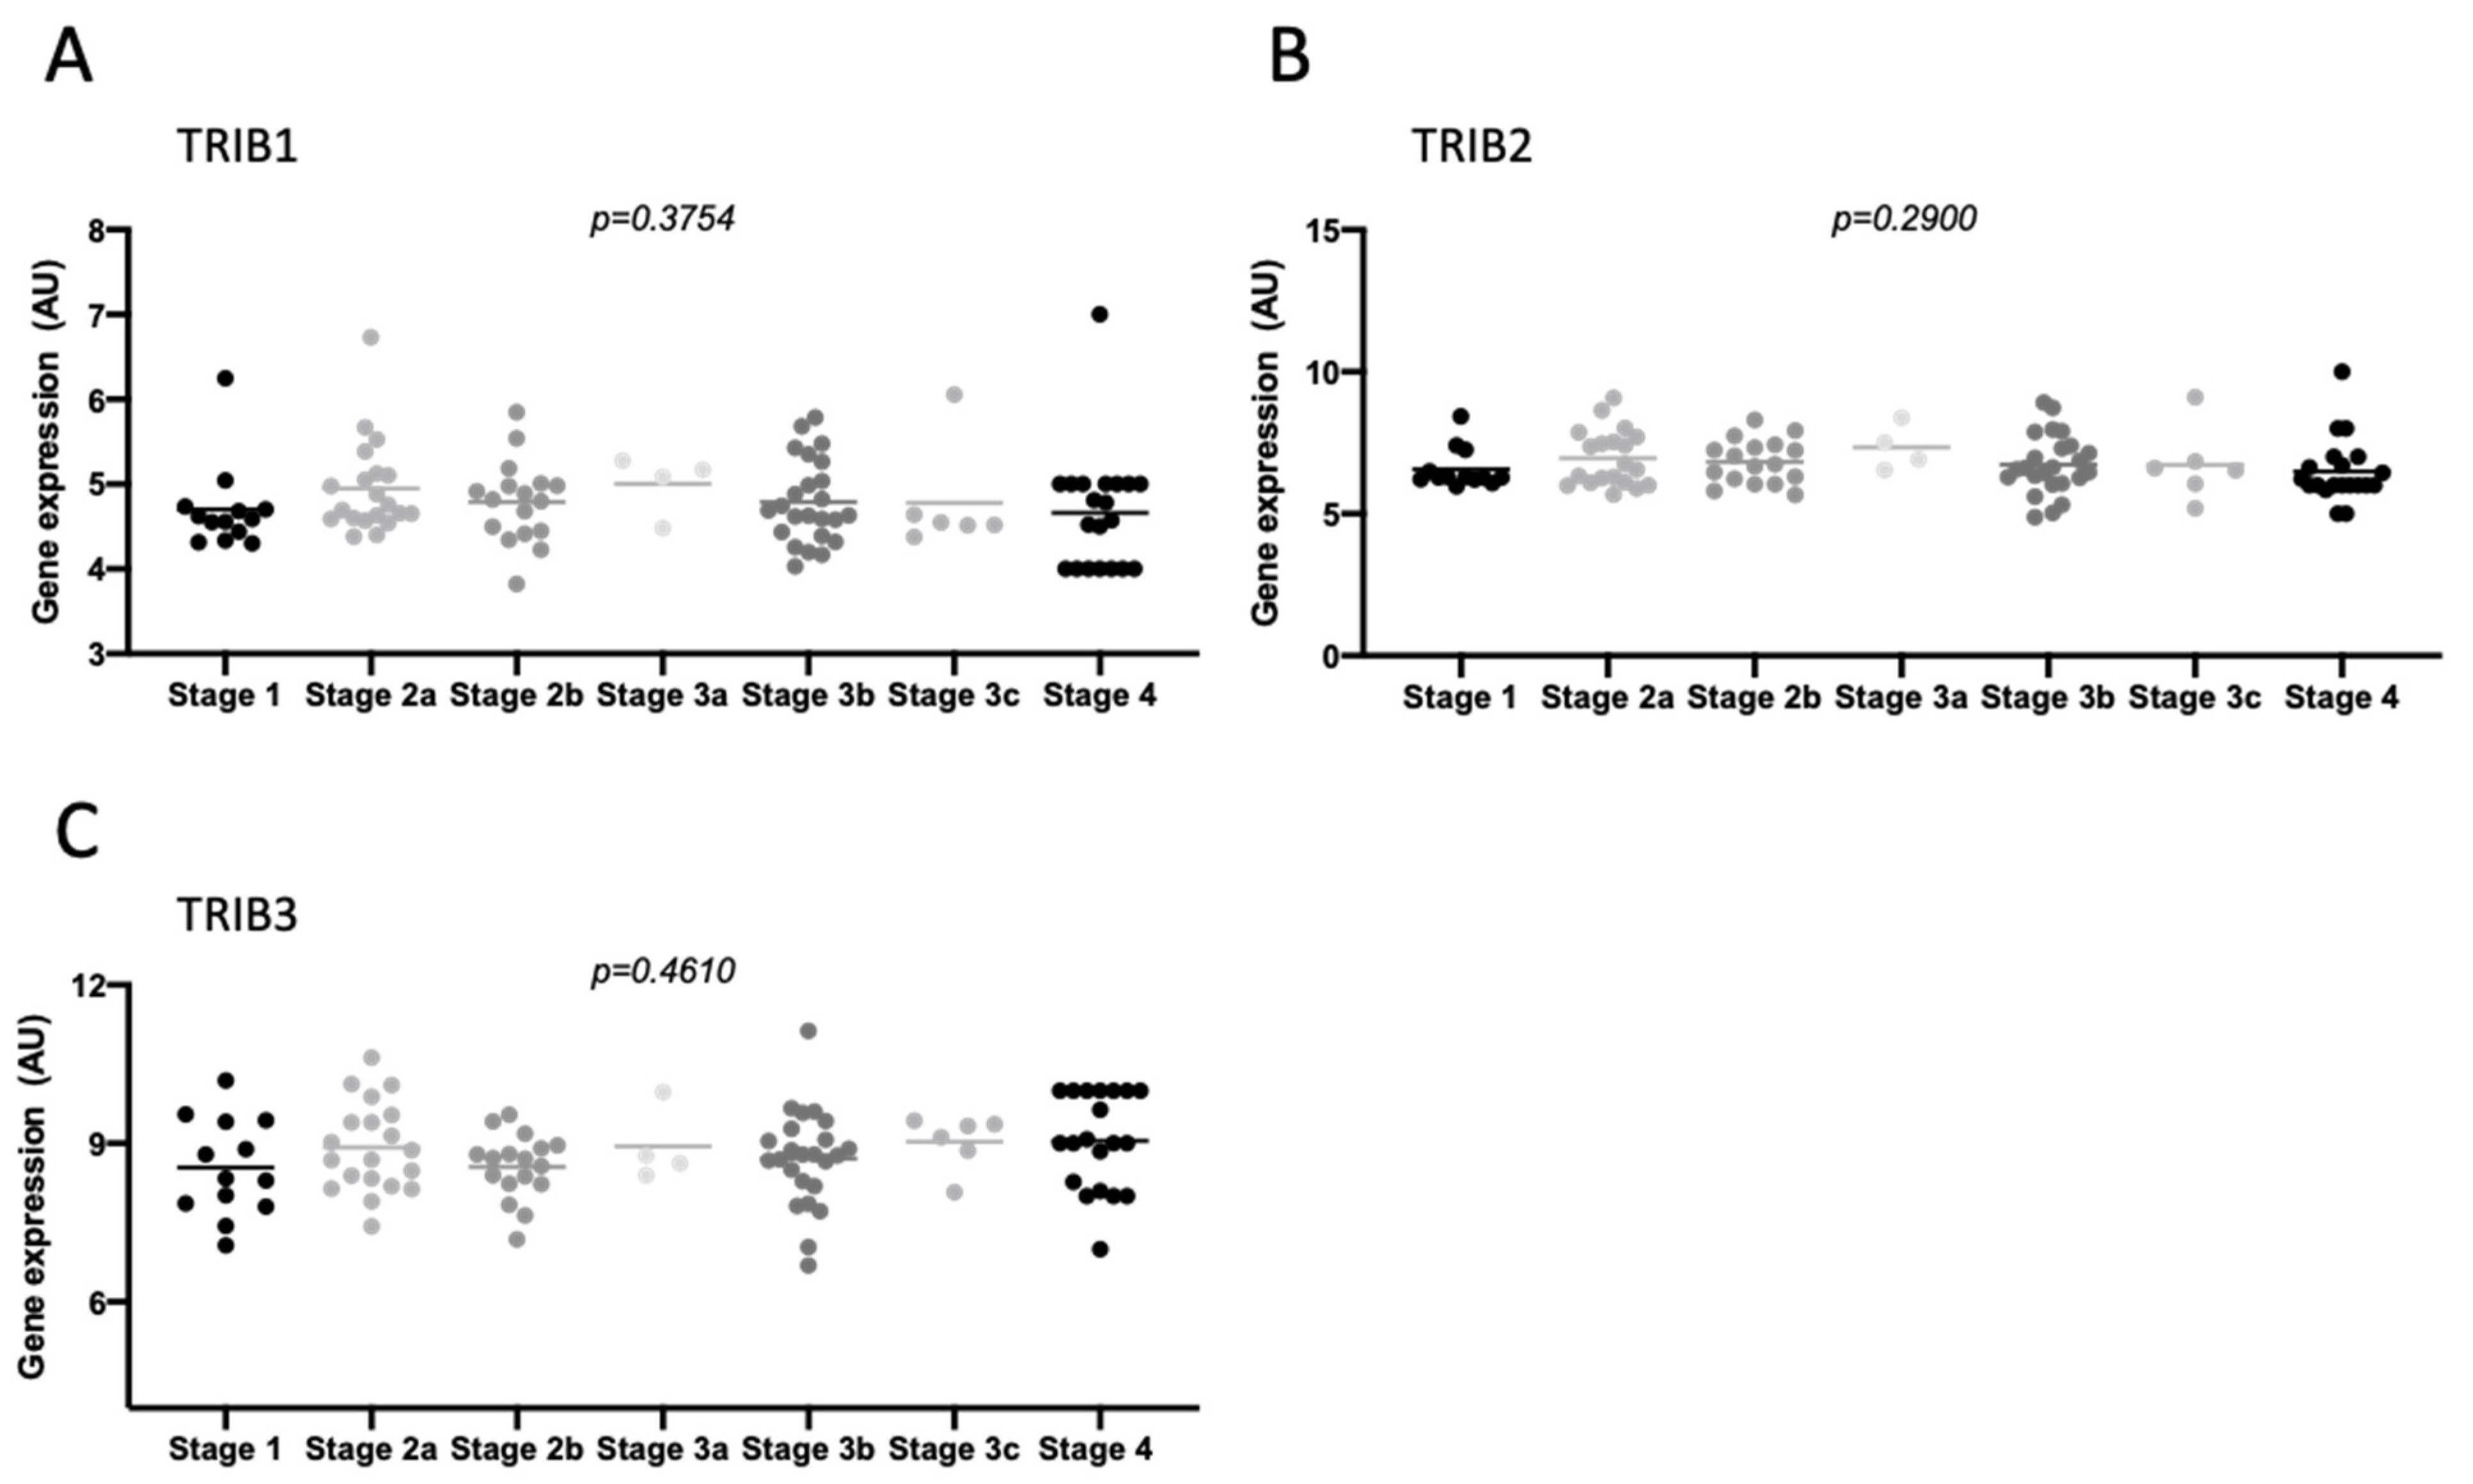
Previous studies have correlated the expression of Tribbles with poor prognosis and overall survival [19], but not with cancer staging. Herein, in the single set of staged patients obtained from the GEO profiles [47], we found that Tribbles expression did not associate with staging (or metastasis), independently of the procedure of sample extraction being laser microdissection (GDS4516) (Figure 5A–C and Figure S9A–C) or classical homogenization (GDS4718) (Figure S9D–I). In addition, we confirmed that TRIB1, TRIB2, and TRIB3 expression were not significantly different in samples from different stages in the TCGA colon and rectum adenocarcinoma (COADREAD) cohort (Figure S10A–C).
In agreement, there were no differences when comparing the expression of Tribbles in metastasis with the primary tumor, independently of the patients being classified as responders or non-responders for FOLFOX treatment (combined therapy with Fluorouracil (5-FU), leucovorin and oxaliplatin) (GDS4393 and GDS4396, as training and test set, respectively) [48] (data not shown).
2.3. Tribbles Expression and Its Association to Colon Cancer Relapse
To the best of our knowledge, there are currently no specific studies on the impact of Tribbles expression on the relapse of CRC patients, though a recent study identified high TRIB2 expression association with an adverse recurrence-free survival [49]. Nevertheless, the analysis of primary tumors from patients with Dukes’ stage B colon cancer that recurred in 5 years, compared to tumors from patients that remained disease-free 5 years after surgery (GDS1263) [50], showed no differences regarding the expression of Tribbles (Table S2). Accordingly, the expression of all Tribbles was similar in both, tumor samples from sporadic stage II colon cancer patients who relapsed, or not, during the 5-year follow-up after being treated by elective standard oncological resection (GDS4513) [51] (Table S2).
2.4. Tribbles Expression Association to Colon Cancer Drug-Resistance
To the best of our knowledge, there are currently no specific studies on the impact of Tribbles expression in CRC and resistance to therapies. However, one study, which mainly focused on the identification of biomarkers for tumor sensitivity to the EGFR inhibitor erlotinib in non-small cell lung cancer (NSCLC), revealed that TRIB3 expression (combined with other transcripts) negatively correlated with the sensitivity to erlotinib in colon cancer cell lines of the NCI60 collection [52].
In our analysis, the expression of all Tribbles was not altered between samples from patient-derived CRC xenografts, sensitive or resistant to the Src inhibitor saracatinib (GDS4383) [53] (Table S2). Similarly, we could not identify expression differences in primary or metastatic lesions when comparing FOLFOX responders to non-responders (GDS4393 and GDS4396) [48] (data not shown). In a cellular context, we observed that in HT29 colon cancer cells, either sensitive or resistant to methotrexate (MTX) (GDS3330) [54,55,56], while TRIB1 levels were lower, TRIB3 expression was higher in MTX-resistant (HT-29-R) cells, compared to sensitive cells (Table S3). Both assay probes for TRIB2 were excluded for this dataset based on our criteria established in the methodology (i.e., below detection), making it impossible to disclose TRIB2 transcript expression in this context.
2.5. Tribbles Transcriptional Regulation in Colon Cancer
The mechanism behind the overexpression of Tribbles in colorectal cancer patients is still currently not fully established. While for TRIB3 different transcription factors have been identified to be involved in its transcriptional regulation, such as β-catenin/TCF4 [57] and ATF4/CHOP [58,59], TRIB1 and TRIB2 upstream regulators in CRC have been less explored. Contributing to the characterization of Tribbles regulation at the transcriptional level will allow a better understanding on how Tribbles are physiologically and pathologically modulated, as well as how its transcript levels might be pharmacologically targeted.
2.5.1. Tribbles Regulation in Response to Protein Modulation
To explore the transcriptional regulation of TRIB1, TRIB2, and TRIB3 in response to genetic alterations impacting different proteins, we selected and analyzed seven independent gene datasets extracted from the GEO profiles. From these, six were from genetically modified cell lines (Table S3), which included SW480 cells stably overexpressing Snail (GDS4596), [60], HCT116 cells depleted of PTEN by gene targeting (GDS2446) [61], HCT116 cells, either fully (p53+/+), partially (p53−/+), or not (p53−/−) expressing TP53 tumor suppressor (GDS170) [62], Ls174T cells upon genetically induced blockage of Wnt signaling (GDS4386) [63], HCT116 overexpressing either wild-type or mutant forms of HLA-F-adjacent transcript 10 (FAT10) (GDS5439) [64], and knock-down (KD) of X-linked inhibitor of apoptosis (XIAP) in HCT116 cells (GDS3482) [65].
TP53 is a tumor suppressor gene known to be regulated by PI3K/AKT signaling [66], and TP53 mutations are common in human cancers. From mutant p53 CRC human samples (GDS4384) [67], TRIB1 showed downregulation when compared to wild-type, though in only one of the probes used (Table S2). From an independent dataset in HCT116 colon cancer cells (GDS170) [62], which compared different levels of p53 protein (and not mutated forms, as in the previous study), TRIB1 levels revealed no differences between genotypes, whereas TRIB2 expression showed a trend to upregulation in TP53−/− when compared to TP53+/+ (Table S3). Only one probe was available for TRIB1 and TRIB2, while any TRIB3 probe was available at this gene dataset.
Phosphatase and tensin homolog (PTEN) is a tumor suppressor antagonizing PI3K activity and therefore inhibiting downstream AKT/mTOR signaling [68]. By analyzing HCT116 colon cancer cells depleted in PTEN by gene targeting (GDS2446) [61], we found that TRIB2 gene expression was consistently over 2-fold upregulated (in both assay probes available) in response to PTEN deletion (Table S3) suggesting the existence of a negative feedback loop in the regulation of TRIB2 activity [69], while TRIB1 and TRIB3 remained unchanged compared to control cells.
HLA-F-adjacent transcript 10 (FAT10) is a ubiquitin-like modifier protein involved in proteasomal protein degradation [70]. In the parental HCT116 colon cancer cell line, compared to cells overexpressing either the wild-type (WT) FAT10 or three different mutants (GDS5439) [64], TRIB3 was downregulated in WT FAT10, compared to parental cells (Figure S11C). This effect was partially or fully lost in M1 or M2 region mutation and double (M12) region mutations, respectively (Figure S11C). The mutations disrupted potential amino acid charge-dependent interactions, though not leading to denaturation or misfolding of the mutant protein, as described [64]. In contrast, TRIB1 and TRIB2 levels remained unchanged between genotypes (Figure S11A,B).
Additional cellular approaches, namely Wnt signaling blockage, XIAP KD, or Snail overexpression did not, at least consistently, modify Tribbles expression levels (Table S3).
2.5.2. Tribbles Regulation in Response to Pharmacological Treatments
As TRIB proteins have been found to be involved in drug resistance, the up or downregulation of their expression upon compound treatment might provide important insights into resistance mechanisms and guide decision-making in the clinic. Regarding the expression of Tribbles upon pharmacological modulation, there are only a few studies published, and mainly on TRIB3, that were able to show expression changes [58,71]. Most were due to indirect effects on transcription factors previously described, and not directly at the protein level. Here, we analyzed six independent datasets which included different putative therapeutic strategies. From these, one was from human patients derived CRC samples (Table S1).
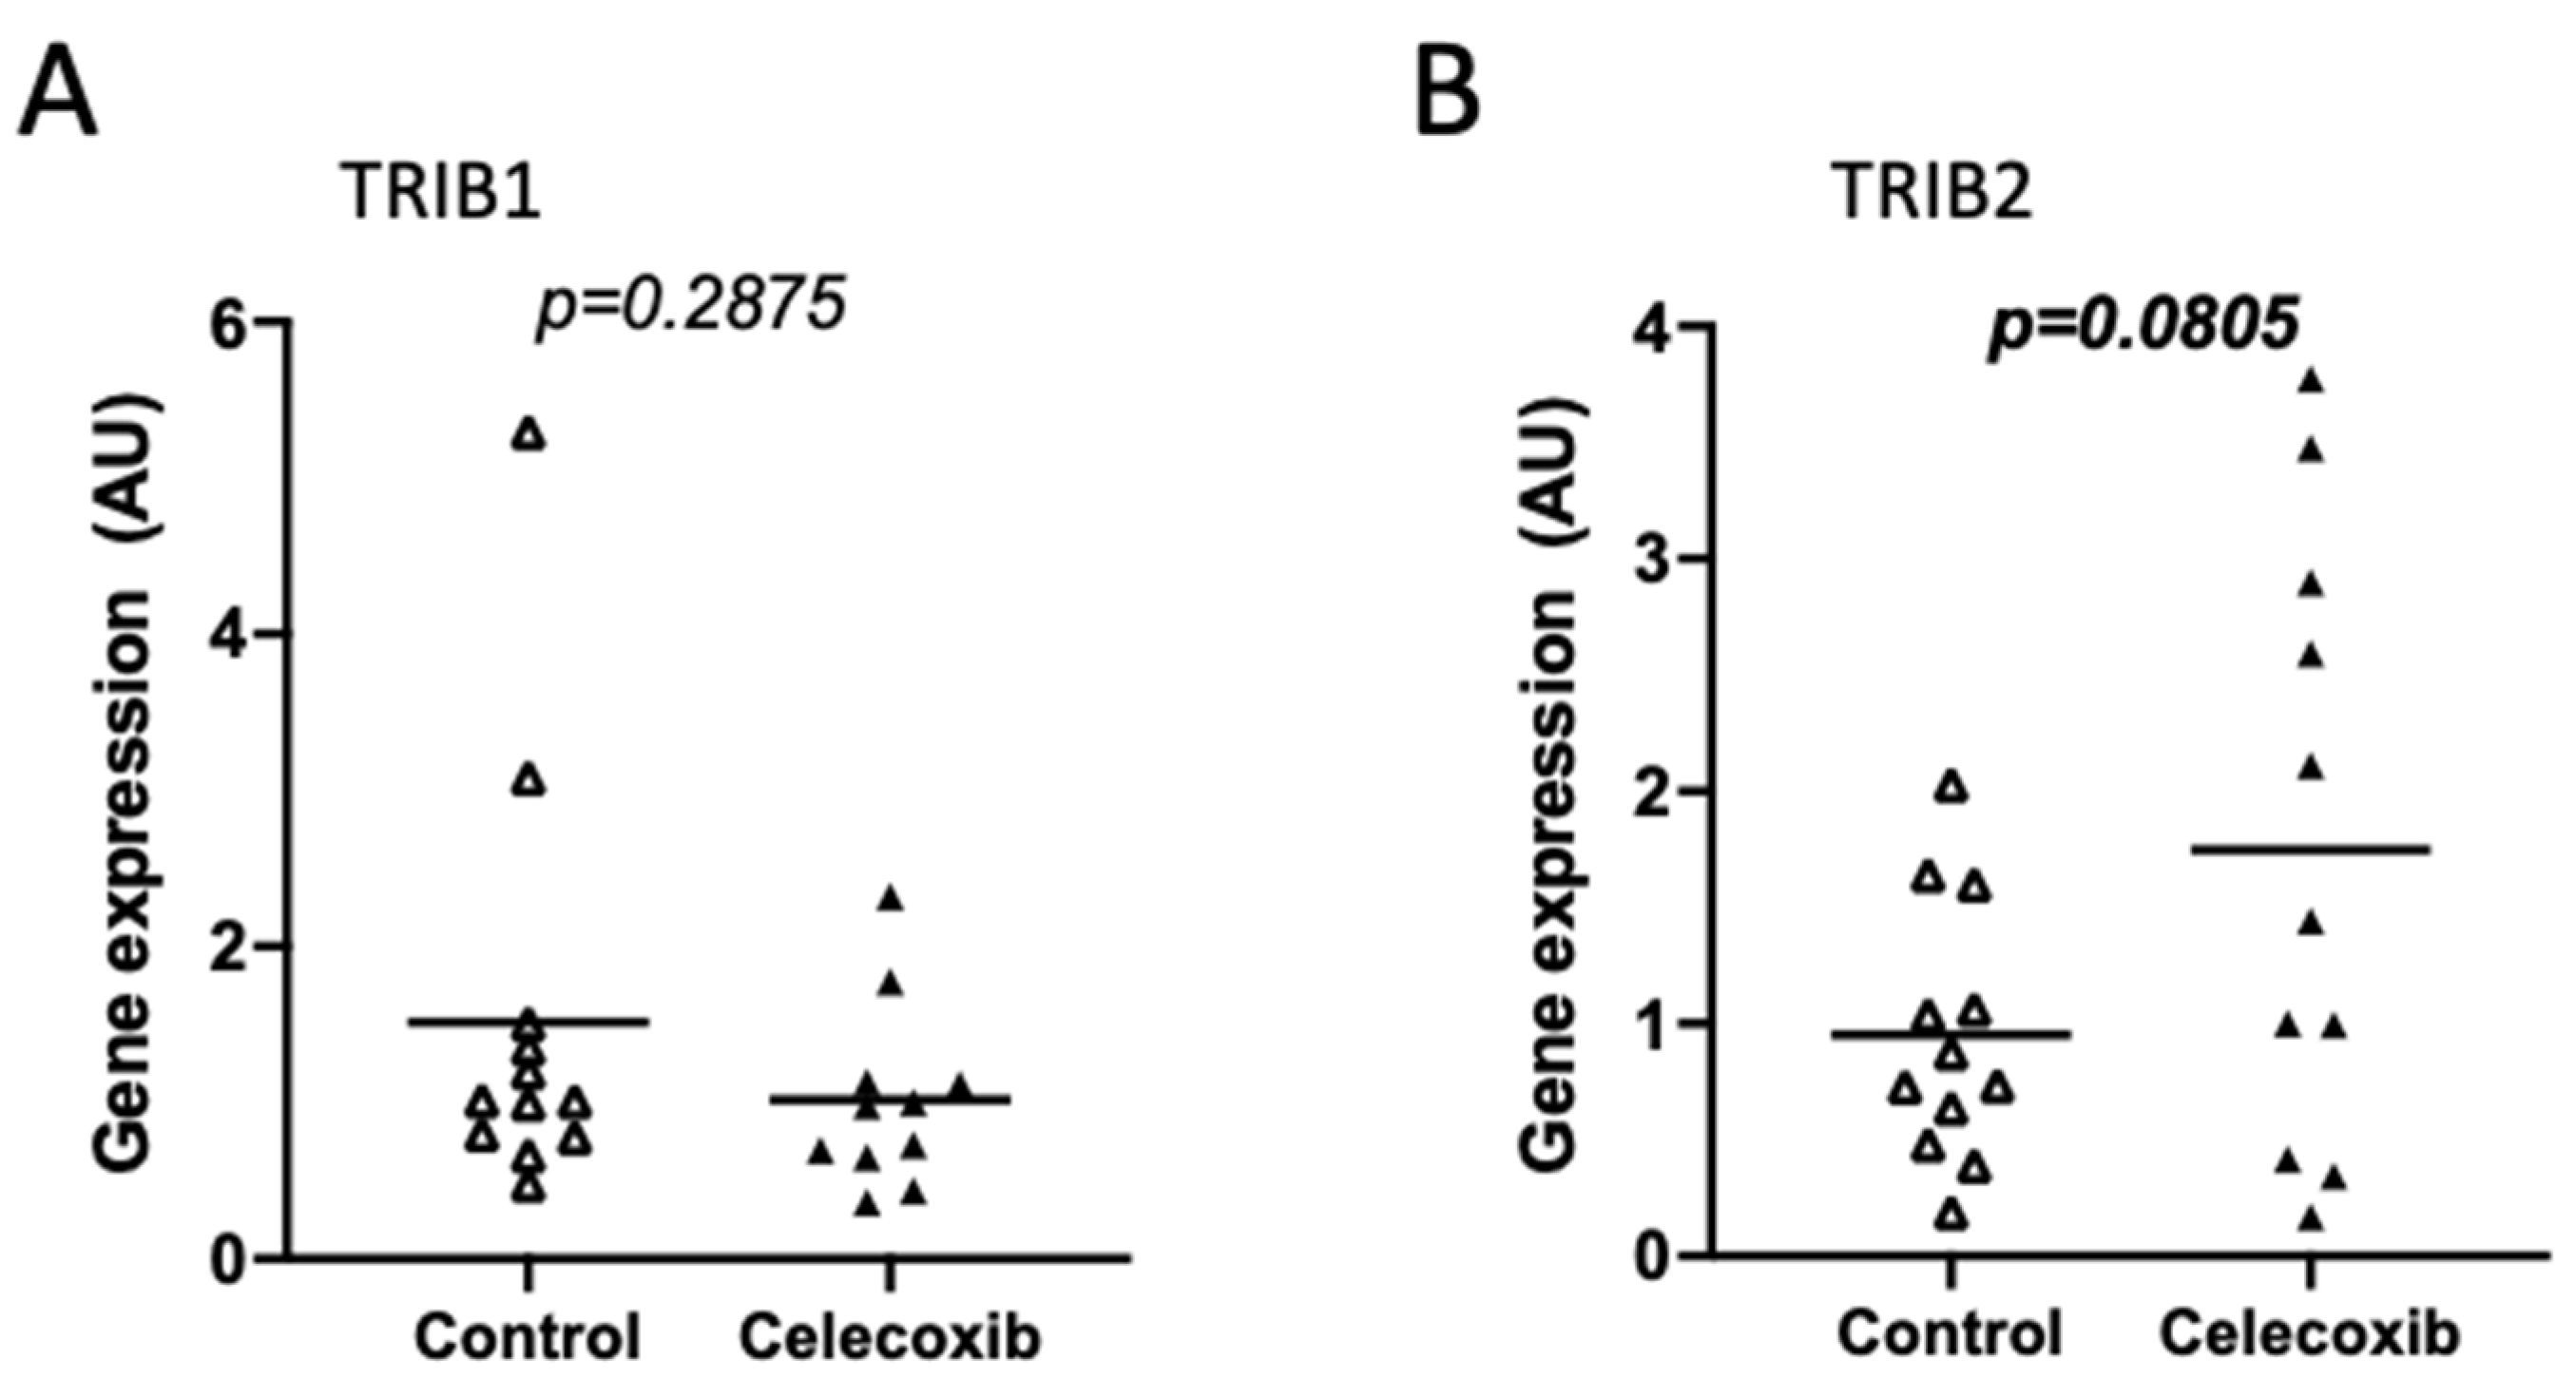
Cyclooxygenase 2 (COX-2) is greatly enriched in CRC specimens compared to adjacent tissues [72]. Its potential active participation in tumorigenesis, fostered the interest in COX inhibition as a pharmacological approach. Celecoxib is a COX-2 inhibitor that, besides its proven and approved anti-inflammatory action, exhibits anti-cancer activity in CRC [73], though also proposed to be through COX-independent mechanisms [74]. We found that TRIB2 expression experienced an almost 2-fold increase in samples from human colorectal adenocarcinoma patients pre-treated with celecoxib (400 mg twice a day) for 7 days prior to tumor resection (GDS3384) [75] (Figure 6B and Figure S12), while TRIB1 was found unchanged (Figure 6A), when compared to control non-treated patients. Although the increase in TRIB2 expression did not reach statistical significance (p < 0.1 in both assayed probes), it could suggest that some patients might not benefit from celecoxib treatment due to TRIB2 upregulation. TRIB3 probe was not present in this specific array.
Datasets from established cell lines included SW620 cells treated with a rosemary extract (GDS5416) [76], SW480 cells treated with a MEK inhibitor or a selective Tankyrase inhibitor, alone or combined (GDS5029) [77], HCT116 cells treated with a cyclin-dependent kinase inhibitor (GDS5268) [78], RKO cells exposed to 4-hydroxy-2-nonenal (HNE) (GDS1413) [79], and HT29 cells treated with apratoxin A or incubated with hydrogen peroxide, exposed to UV light, or subjected to a heat shock (GDS1902) [80], which main results are depicted in Table S3.
In the context of cell lines, we identified potential effects on the expression of Tribbles upon different pharmacological approaches, previously proposed to show anticancer activity in different cancer types. For instance, analysis of SW620 colon cancer cells treated with supercritical Rosemary (Rosmarinus officinalis L.) extract RE-2 at different doses (30, 60, and 100 μg/mL) (GDS5416) [76], showed that the expression of all Tribbles genes was mildly affected depending on the dose. While both TRIB1 and TRIB3 were upregulated at higher doses, compared to control vehicle, TRIB2 expression was gradually inhibited upon RE treatment, showing a maximal reduction at a concentration of the 60 μg/mL (Table S3). In another study, RKO colorectal carcinoma cells were exposed to HNE, a product of cellular lipid peroxidation with anti-cancer potential [81], at three different doses (5, 20, and 60 μM) for 6 or 24 h (GDS1413) [79]. Regarding TRIB1 transcript levels, there was a dose-dependent downregulation after 6 h of HNE treatment compared to control cells, which was lost after 24 h. Although some degree of inconsistency between both available probes was observed for TRIB3 at the lower doses, its expression levels were consistently upregulated in cells treated with 60 μM HNE after both 6 h and 24 h (Table S3). Both assay probes for TRIB2 were excluded based on our criteria established in the methodology regarding threshold for detection from the Affymetrix platform. Taken together, these results suggest that RE-2 and HNE act through different molecular mechanisms affecting specific factors capable of differentially regulating the transcription of the Tribbles genes. However, the interpretation of such results is currently limited by the absence of statistical analysis derived from the low number of replicates (Table S3).
3. Discussion
As recently reviewed [19], only a few studies have specifically studied TRIB1, TRIB2, or TRIB3 in CRC, though never concurrently. This might be of great importance, as only when all three isoforms are analyzed simultaneously and compared is it possible to investigate and determine the potential existence of redundancy or compensatory effects, as previously evidenced [16,25,26].
While researchers usually use a specific dataset to look for differentially expressed genes, we took the reverse strategy from the available gene expression arrays in order to dig into the transcript levels of Tribbles in response to several different stimuli and conditions in the CRC setting. This approach allows us to identify novel hints to establish this family of genes as putative oncogenes and/or useful CRC biomarkers, as the knowledge on its regulation will also allow us to better understand its biology and clarify its potential as novel therapeutic targets. Tribbles have been individually implicated in colorectal cancer. Nevertheless, a simultaneous analysis of TRIB1, TRIB2, and TRIB3 in the same samples was, to best of our knowledge, not reported before. Therefore, we performed a comprehensive bioinformatic analysis of GEO data, which provided new insights into the expression levels and transcript regulation of Tribbles genes in colorectal cancer.
We found TRIB1 and TRIB2 to be overexpressed in morphologically normal-appearing colon mucosa adjacent to tumors when compared to normal colon mucosa from healthy individuals. This finding suggests that these may be deregulated in a mucosa “primed” for carcinogenesis [34]. When comparing the transcriptome of early stage adenomas with normal colon mucosa from the same individuals, we found that TRIB3 was overexpressed in paired tumors. By contrast, TRIB1 and TRIB2 expression was not different between adenomas and adjacent normal colon. The fact that TRIB2 levels are increased in the normal-appearing colonic mucosa adjacent to tumors of CRC patients, when compared to the normal mucosa from healthy individuals might explain the absence of differences between TRIB2 levels in adjacent tissue compared to the tumor itself. Indeed, analyzing the transcriptomics data from a different study, which reported the isolation of cancer-associated fibroblasts (CAFs) and CRC cells from tumors [41], we found that TRIB1 and TRIB3 were expressed at higher levels in CRC cells. Conversely, TRIB2 levels were higher in CAFs, the most prevalent cells found in the tumor stroma. Therefore, TRIB2 may be preferentially expressed in stromal cells, which may contribute to the higher levels of TRIB2 in tumor samples precluding the identification of consistent expression differences between cancerous cells and their normal counterparts unless the tissues are dissociated and sorted.
When comparing the expression of TRIB1, TRIB2, and TRIB3 in CRC specimens from different stages of the disease, none of the three Tribbles presented differences in expression between tumor stages. Age at diagnosis also does not seem to be a factor contributing to differences in Tribbles expression. Importantly, a clear upregulation of TRIB2 and TRIB3 was found in tumors when compared to normal colon of healthy controls, while TRIB1 remained unchanged. This is somewhat unexpected, as all Tribbles were previously reported in independent studies to be expressed at higher levels in CRC than in normal colon tissues, both at the mRNA and protein levels [21,82,83]. Nevertheless, it was previously described that TRIB1 and TRIB2 overexpression was only detected in around 70% of patients, while TRIB3 overexpression was detected in 90% of patients in each respective study cohort [19]. Therefore, differences may be more easily detected for the latter when studying smaller and more heterogeneous cohorts as in the present study. This possibility is supported by the finding of a smaller but statistically significant difference for TRIB2 in the validation cohort.
In rectal carcinoma, we found TRIB3 also overexpressed in the tumor when compared to normal rectal tissue. Nevertheless, its expression was decreased following neoadjuvant radio-chemotherapy (RCT). Conversely, although TRIB2 levels were not significantly upregulated in rectal cancer, its levels were higher in the tumor after therapy, suggesting that it may be induced in response to RCT and it should be studied as a potential biomarker of response to therapy. Therefore, as not all patients responded similarly to the RCT in this study [37], it would be important to investigate whether a correlation between TRIB2 levels and the response to treatment could be inferred, and potentially implicating TRIB2 in treatment resistance, as previously evidenced in other cancer types [84,85].
We also explored the regulation of Tribbles transcripts in CRC by analyzing data from human samples or cell lines with altered signaling through genetic or pharmacological approaches. In view of the observational nature of the findings, and limited by the low number of samples available constraining statistical analyses, we narrowed our findings to main differential results. Indeed, from thirteen independent datasets, only two were from human samples. In these, we did not find either very consistent nor statistically significant expression changes, namely in response to p53 mutations or celecoxib treatments, respectively. Moreover, the relatively small study groups may have precluded the possibility to confirm differences in Tribbles expression in the different cell lines.
Even so, some cellular treatments showed relatively coherent results, which might be important to guide future research projects on Tribbles in the CRC setting.
Firstly, it has been well described that TRIB3 is upregulated at the transcriptional level upon endoplasmic reticulum (ER) stress [86], implicating the drugs involved in the activation of ER stress as expected inducers of TRIB3. Rosemary (Rosmarinus officinalis L.) extracts (RE), naturally rich in carnosic acid, have been previously emphasized due to its potential anticancer activity in different cancer types, such as CRC [87,88]. Mechanistically, different studies have identified induced unfolded protein response (UPR) and ER stress activation in HT29 colorectal adenocarcinoma [89,90], and in HCT116 CRC cell lines using xenograft models [91]. However, it is not surprising to detect an induction of TRIB3 in response to RE treatment, as TRIB3 is a known transcriptional target of ATF4/CHOP [86]. By contrast, TRIB2 expression was decreased after RE treatment, suggesting that different mechanisms might be involved. As TRIB2 directly interacts with AKT and promotes its phosphorylation at the Serine 473 residue, leading to AKT activation [92], TRIB2 downregulation in response to RE could be contributing to the impairment of AKT signaling pathway described in NSCLC after RE treatment [93], which should be further explored.
Secondly, another compound of interest is HNE (4-hydroxy-2-nonenal), which results from polyunsaturated fatty acids oxidation. Mainly due to its electrophilic characteristics, it reacts with both DNA and proteins [94], which have led to the increasing interest on its impact on cell death induction, occurring mainly through apoptosis [95]. In the original dataset article [79], the authors have identified alterations in the expression of genes involved in ER stress and nutrient deprivation responses. Therefore, it was not unexpected that TRIB3 transcript levels were increased after treatment with HNE at the considered cytotoxic concentration (20 μM), early after 6 h of incubation, as previously listed [79]. As for TRIB1, we found it was regulated in opposite directions in response to these two aforementioned TRIB3-inducing treatments (up upon RE and down upon HNE), so additional unknown effectors might be operating.
Finally, there is accumulating evidence supporting that TRIB3 may either function as an oncogene or as a tumor suppressor. Respectively, while TRIB3 may lead to the activation of the AKT survival pathway in retinoblastoma [96], oral squamous cell carcinoma [97], or breast cancer [98], it also may lead to decreased AKT activity and proliferation in endometrial cancer cells [99], or in breast carcinoma BT474 and hepatocellular carcinoma (HCC) HepG2 cell lines [100,101]. Consistent with the finding that FAT10 was upregulated in colon tumors [102], its ectopic expression in HCT116 CRC cells was described to promote tumor growth [103]. FAT10 oncogenic effects were shown to be dependent of AKT signaling pathway activation in HCC [104]. Indeed, FAT10 overexpression induced phosphorylation of AKT in both HCC and bladder cancer cells [104,105]. Remarkably, TRIB3 has been previously listed has one of the genes involved in cell death and survival, modulated by exogenous FAT10 expression [103]. However, the authors did not expand this finding [103]. Through our analyses, we identified TRIB3 downregulation in response to FAT10 overexpression, but not in response to the double mutant protein, which abrogates FAT10–Mad2 interaction (described in [64]). This finding suggests that TRIB3 could be a transcriptional target of FAT10, which could be an indirect response to the malignant phenotype, or a direct target gene at the promoter level. On the other hand, taking into account the reported AKT suppression mediated by TRIB3 [100], decreased TRIB3 levels could be the missing link between FAT10 overexpression and increased AKT activity. This hypothesis remains to be established.
4. Materials and Methods
4.1. Sources of Data
Gene expression RNA-seq and microarray data from colorectal cancer cell lines and primary samples were obtained from the Gene Expression Omnibus (GEO) profiles database [27,28]. Gene data sets (GDS) were selected based on data availability, using advanced search with keywords “colorectal OR colon AND TRIB*”. The expression data were downloaded and, when indicated, the relative fold change to an experimentally or clinically defined control was calculated to each GDS. Whenever indicated, multiple statistical analyses were performed for the same GDS. Datasets with less than 2 samples per group were excluded.
Gene probes IDs were indicated for each analysis. Different platforms might use specific informative extensions. Illumina uses “I” when a probe recognizes a single isoform and “A” when recognizing all isoforms. Affymetrix uses “_at” indicating a probe that recognizes a unique gene isoform or “_s_at” indicating the probe can recognize multiple isoforms of the same gene. Specifically for the data obtained from the Affymetrix platform, extensions “_x_at” and also assay probes where over 75% of the samples presented expression values below detection (i.e., “absent”), were excluded. When more than one assay probe for the same gene was available, both sets of data were always independently analyzed and the combined data interpreted, described, and referenced. In this case, only one was shown in main figures, and the other was represented in Supplementary Material, as described below.
For main figures, consistently only one probe from each platform was shown, respectively for TRIB1 (202241_at from [HG-U133A] Affymetrix Human Genome U133A Array (Affy U133A); 150749 from ABI Human Genome Survey Microarray Version 2 (ABI); AJ000480_at from [Hu6800] Affymetrix Human Full Length HuGeneFL Array (Affy HuGeneFL); ILMN_1803811 from Illumina HumanHT-12 V4.0 expression beadchip (Illu HT-12); 35597_at from [HG_U95Av2] Affymetrix Human Genome U95 Version 2 Array (Affy U95); and A_24_P252497 from Agilent-014850 Whole Human Genome Microarray 4x44K G4112F (Agi)), TRIB2 (202478_at from Affy U133A; 188922 from ABI; D87119_at from Affy HuGeneFL; ILMN_1714700 from Illu HT-12; 40113_at from Affy U95; and A_24_P396753 from Agi), and TRIB3 (218145_at from Affy U133A; 113737 from ABI; ILMN_1787815 from Illu HT-12; and A_24_P305541 from Agi), which are denoted in figure legends. When available, the following probes were consistently represented only at Supplementary Figures: TRIB1 (235641_at from Affy U133A and A_23_P123503 from Agi), TRIB2 (202479_s_at from Affy U133A; 717_at from Affy U95; and A_23_P90696 from Agi), and TRIB3 (1555788_a_at from Affy U133A and A_23_P210690 from Agi), disclosed in figure legends.
For the validation cohorts, gene expression bioinformatic analyses were performed on colorectal samples from the TCGA colon and rectum adenocarcinoma (COADREAD) cohort from a publicly available database, The Cancer Genome Atlas Consortium (TCGA) [106]. The data was derived from Illumina HiSeq 2000 RNA Sequencing. This dataset includes gene-level transcription estimates, expressed in RSEM normalized count.
Both the RNA sequencing dataset and the clinicopathological features of patients with CRC, such as gender, age, and pathologic stage, were downloaded from the UCSC Xena website [107], and samples with missing clinical information were removed from the analysis. Gene expression data from different cell lines from the Cell Line Cancer Encyclopedia (CCLE) database [108] were also downloaded from the UCSC Xena platform [107].
4.2. Statistical Analysis
GraphPad Prism version 8 (GraphPad Software, La Jolla, CA, USA) was used for statistical analysis. The normal/gaussian distribution of the values was accessed by the Shapiro–Wilk test. For values not normally distributed, the non-parametric Mann–Whitney U test was used to compare two unmatched groups. For non-parametric paired analyses, the Wilcoxon matched-pairs signed rank test was applied. In the case of normally distributed values, the F test was used to compare variances. Groups with normally distributed values and equal variances were compared using paired or unpaired two tailed Student’s t test, to compare data between two groups. On the other hand, groups with normally distributed values and different variances were compared using the t-test with Welch’s correction.
To compare data between more than two groups, i.e., three or more unpaired groups, based on the assumption of normal distribution, one-way ANOVA (including multiple comparisons) were used. In these cases, the Brown and Forsythe test was used to assess equality of variances. The Welch version of one-way ANOVA was used whenever unequal variances were identified. For both ANOVA versions, Tukey’s multiple comparisons test was also performed. In the absence of normality, accessed by the Shapiro–Wilk test, the nonparametric Kruskal–Wallis test was used to compare three or more independent groups. In this case, multiple comparisons were obtained by Dunn’s post test. Whenever indicated, additional t-tests or equivalent, were performed to compare two groups individually. Datasets for which normality could not be properly assessed due to a too small number of samples per group (i.e., n = 3), non-parametric tests were always applied. In the case of datasets from cell lines, in which samples were considered as technical replicates or at least a group was n ≤ 3, statistical analyses were omitted, and results merely described.
A p < 0.05 was considered statistically significant. All statistical tests performed are disclosed in figure legends, and p values are shown in figures; all p < 0.1 were highlighted in bold. In each graph, the horizontal bars represent the mean of the values in each group.
5. Conclusions
In summary, we found that at the transcript level, TRIB2 and TRIB3 are upregulated in CR tumors as compared to normal tissues from healthy controls, although the expression levels of all Tribbles genes remain comparable throughout the CRC stages. Though all Tribbles were previously identified in CRC, we have shown for the first time that these genes are not all overexpressed in the same tumors alongside, but rather that the transcriptional levels of each family member may be induced in response to specific characteristics of the CRC patients, and even differentially expressed based on the tumor sampling for analyses. Herein, we have also confirmed TRIB3 overexpression in response to different cellular stress inducers. Although we also included validation cohorts for some datasets, future perspectives include performing quantitative analyses of gene and protein expression, to validate specific results obtained from these arrays.
Supplementary Materials
The following are available online at https://www.mdpi.com/article/10.3390/gidisord3040021/s1, Figure S1: TRIB2 and TRIB3 gene expression in colorectal adenomas compared to normal colon from the same individual; Figure S2: TRIB1, TRIB2, and TRIB3 gene expression in colorectal cancer compared to control; Figure S3: TRIB1 gene expression in colorectal cancer compared to control; Figure S4: TRIB1, TRIB2, and TRIB3 gene expression in colorectal cancer compared to control; Figure S5: TRIB2 gene expression in normal-appearing colonic mucosa from colorectal cancer patients compared to normal colon tissue from healthy individuals. Figure S6: TRIB1, TRIB2, and TRIB3 gene expression in primary colorectal cancer (CRC) tumors at different times of diagnosis. Figure S7: TRIB1, TRIB2, and TRIB3 gene expression in primary colorectal cancer (CRC) tumors at different times of diagnose; Figure S8: TRIB2 and TRIB3 gene expression in colorectal cancer (CRC) cells compared to carcinoma associated fibroblasts; Figure S9: TRIB1, TRIB2, and TRIB3 gene expression in CRC tumors with different staging; Figure S10: TRIB1, TRIB2, and TRIB3 gene expression in CRC tumors with different staging; Figure S11: TRIB1, TRIB2, and TRIB3 gene expression in HCT116 colon cancer cell line overexpressing wild-type (WT) or mutant HLA-F-adjacent transcript 10 (FAT10); Figure S12: TRIB2 gene expression in colorectal adenocarcinoma from patients treated with celecoxib; Table S1: List of the GEO profiles selected gene data sets from human patients used in the study; Table S2: Selected gene data sets with respective summary of the samples and relative expression of Tribbles genes represented as fold change to a specific condition; and Table S3: List of the GEO profiles selected gene data sets from cell lines used in the study and respective main results.
Author Contributions
Conceptualization, A.L.D.S.-C.; methodology, A.L.D.S.-C. and V.Y.; validation, A.L.D.S.-C. and M.T.F.; formal analysis, A.L.D.S.-C. and M.T.F.; investigation, A.L.D.S.-C. and V.Y.; resources, A.L.D.S.-C.; data curation, A.L.D.S.-C.; writing—original draft preparation, A.L.D.S.-C., M.T.F. and V.Y.; writing—review and editing, A.L.D.S.-C., M.T.F., J.B., W.L. and B.I.F.; visualization, A.L.D.S.-C.; supervision, A.L.D.S.-C., J.B., W.L. and B.I.F.; project administration, A.L.D.S.-C., W.L. and B.I.F.; and funding acquisition, W.L. and B.I.F. All authors have read and agreed to the published version of the manuscript.
Funding
This work was supported by the Spanish Ministry of Science, Innovation and Universities through Grant RTI2018-094629-B-I00 to W.L., the COST Action STRATAGEM, CA17104 “New diag-nostic and therapeutic tools against multidrug resistant tumors”, the European Commission project TRIBBLES–748585 and Fundação para a Ciência e a Tecnologia (FCT) (grant PTDC/MED-ONC/4167/2020 “ENDURING”) to B.I.F.
Institutional Review Board Statement
Not applicable.
Informed Consent Statement
Not applicable.
Conflicts of Interest
The authors M.T.F., V.Y., J.B., B.I.F. and A.L.D.S.-C., declare no conflict of interest. W.L. is the scientific co-founder of Refoxy Pharmaceuticals GmbH, Berlin and is required by his institution to state so in his publications. The funders had no role in the design and writing of the manuscript.
References
- Arends, J.W. Molecular interactions in the Vogelstein model of colorectal carcinoma. J. Pathol. 2000, 190, 412–416. [Google Scholar] [CrossRef]
- Tariq, K.; Ghias, K. Colorectal cancer carcinogenesis: A review of mechanisms. Cancer Biol. Med. 2016, 13, 120–135. [Google Scholar] [CrossRef] [Green Version]
- Wild, C.P.; Weiderpass, E.; Stewart, B.W. (Eds.) World Cancer Report: Cancer Research for Cancer Prevention; IARC Press: Lyon, France, 2020; ISBN 9789283204299. [Google Scholar]
- Pino, M.S.; Chung, D.C. The chromosomal instability pathway in colon cancer. Gastroenterology 2010, 138, 2059–2072. [Google Scholar] [CrossRef] [Green Version]
- Kim, S.Y.; Kim, T. Il Serrated neoplasia pathway as an alternative route of colorectal cancer carcinogenesis. Intest. Res. 2018, 16, 358–365. [Google Scholar] [CrossRef] [Green Version]
- Kambara, T.; Simms, L.A.; Whitehall, V.L.J.; Spring, K.J.; Wynter, C.V.A.; Walsh, M.D.; Barker, M.A.; Arnold, S.; McGivern, A.; Matsubara, N.; et al. BRAF mutation is associated with DNA methylation in serrated polyps and cancers of the colorectum. Gut 2004, 53, 1137–1144. [Google Scholar] [CrossRef] [Green Version]
- Iino, H.; Jass, J.R.; Simms, L.A.; Young, J.; Leggett, B.; Ajioka, Y.; Watanabe, H. DNA microsatellite instability in hyperplastic polyps, serrated adenomas, and mixed polyps: A mild mutator pathway for colorectal cancer? J. Clin. Pathol. 1999, 52, 5–9. [Google Scholar] [CrossRef] [Green Version]
- Hawkins, N.J.; Ward, R.L. Sporadic colorectal cancers with microsatellite instability and their possible origin in hyperplastic polyps and serrated adenomas. J. Natl. Cancer Inst. 2001, 93, 1307–1313. [Google Scholar] [CrossRef]
- Mäkinen, M.J.; George, S.M.; Jernvall, P.; Mäkelä, J.; Vihko, P.; Karttunen, T.J. Colorectal carcinoma associated with serrated adenoma—Prevalence, histological features, and prognosis. J. Pathol. 2001, 193, 286–294. [Google Scholar] [CrossRef]
- Boland, C.R.; Goel, A. Microsatellite instability in colorectal cancer. Gastroenterology 2010, 138, 2073–2087.e3. [Google Scholar] [CrossRef]
- Sawyer, E.J.; Cerar, A.; Hanby, A.M.; Gorman, P.; Arends, M.; Talbot, I.C.; Tomlinson, I.P.M. Molecular characteristics of serrated adenomas of the colorectum. Gut 2002, 51, 200–206. [Google Scholar] [CrossRef]
- Laiho, P.; Kokko, A.; Vanharanta, S.; Salovaara, R.; Sammalkorpi, H.; Järvinen, H.; Mecklin, J.-P.; Karttunen, T.J.; Tuppurainen, K.; Davalos, V.; et al. Serrated carcinomas form a subclass of colorectal cancer with distinct molecular basis. Oncogene 2007, 26, 312–320. [Google Scholar] [CrossRef] [Green Version]
- American Cancer Society Cancer Facts & Figures 2021. Available online: https://www.cancer.org/research/cancer-facts-statistics/all-cancer-facts-figures/cancer-facts-figures-2020.html (accessed on 29 October 2021).
- Eyers, P.A.; Keeshan, K.; Kannan, N. Tribbles in the 21st Century: The Evolving Roles of Tribbles Pseudokinases in Biology and Disease. Trends Cell Biol. 2016, 27, 284–298. [Google Scholar] [CrossRef] [Green Version]
- Richmond, L.; Keeshan, K. Pseudokinases: A tribble-edged sword. FEBS J. 2020, 287, 4170–4182. [Google Scholar] [CrossRef] [Green Version]
- Yokoyama, T.; Nakamura, T. Tribbles in disease: Signaling pathways important for cellular function and neoplastic transformation. Cancer Sci. 2011, 102, 1115–1122. [Google Scholar] [CrossRef]
- Mayoral-Varo, V.; Jiménez, L.; Link, W. The Critical Role of TRIB2 in Cancer and Therapy Resistance. Cancers 2021, 13, 2701. [Google Scholar] [CrossRef]
- Stefanovska, B.; André, F.; Fromigué, O. Tribbles Pseudokinase 3 Regulation and Contribution to Cancer. Cancers 2021, 13, 1822. [Google Scholar] [CrossRef]
- Ferreira, B.I.; Santos, B.; Link, W.; De Sousa-Coelho, A.L. Tribbles Pseudokinases in Colorectal Cancer. Cancers 2021, 13, 2825. [Google Scholar] [CrossRef]
- Hou, Z.; Guo, K.; Sun, X.; Hu, F.; Chen, Q.; Luo, X.; Wang, G.; Hu, J.; Sun, L. TRIB2 functions as novel oncogene in colorectal cancer by blocking cellular senescence through AP4/p21 signaling. Mol. Cancer 2018, 17, 172. [Google Scholar] [CrossRef]
- Wang, Y.; Wu, N.; Pang, B.; Tong, D.; Sun, D.; Sun, H.; Zhang, C.; Sun, W.; Meng, X.; Bai, J.; et al. TRIB1 promotes colorectal cancer cell migration and invasion through activation MMP-2 via FAK/Src and ERK pathways. Oncotarget 2017, 8, 47931–47942. [Google Scholar] [CrossRef] [Green Version]
- Liu, Q.; Zhang, W.; Luo, L.; Han, K.; Liu, R.; Wei, S.; Guo, X. Long noncoding RNA TUG1 regulates the progression of colorectal cancer through miR-542-3p/TRIB2 axis and Wnt/β-catenin pathway. Diagn. Pathol. 2021, 16, 47. [Google Scholar] [CrossRef]
- Dedhia, P.H.; Keeshan, K.; Uljon, S.; Xu, L.; Vega, M.E.; Shestova, O.; Zaks-Zilberman, M.; Romany, C.; Blacklow, S.C.; Pear, W.S. Differential ability of Tribbles family members to promote degradation of C/EBPα and induce acute myelogenous leukemia. Blood 2010, 116, 1321–1328. [Google Scholar] [CrossRef]
- Keeshan, K.; Bailis, W.; Dedhia, P.H.; Vega, M.E.; Shestova, O.; Xu, L.; Toscano, K.; Uljon, S.N.; Blacklow, S.C.; Pear, W.S. Transformation by Tribbles homolog 2 (Trib2) requires both the Trib2 kinase domain and COP1 binding. Blood 2010, 116, 4948–4957. [Google Scholar] [CrossRef] [Green Version]
- Salomé, M.; Hopcroft, L.; Keeshan, K. Inverse and correlative relationships between TRIBBLES genes indicate non-redundant functions during normal and malignant hemopoiesis. Exp. Hematol. 2018, 66, 63–78.e13. [Google Scholar] [CrossRef] [Green Version]
- Guan, H.; Shuaib, A.; De Leon, D.D.; Angyal, A.; Salazar, M.; Velasco, G.; Holcombe, M.; Dower, S.K.; Kiss-Toth, E. Competition between members of the tribbles pseudokinase protein family shapes their interactions with mitogen activated protein kinase pathways. Sci. Rep. 2016, 6, 32667. [Google Scholar] [CrossRef] [Green Version]
- Edgar, R. Gene Expression Omnibus: NCBI gene expression and hybridization array data repository. Nucleic Acids Res. 2002, 30, 207–210. [Google Scholar] [CrossRef] [Green Version]
- Barrett, T.; Wilhite, S.E.; Ledoux, P.; Evangelista, C.; Kim, I.F.; Tomashevsky, M.; Marshall, K.A.; Phillippy, K.H.; Sherman, P.M.; Holko, M.; et al. NCBI GEO: Archive for functional genomics data sets—Update. Nucleic Acids Res. 2012, 41, D991–D995. [Google Scholar] [CrossRef] [Green Version]
- Sabates-Bellver, J.; Van der Flier, L.G.; de Palo, M.; Cattaneo, E.; Maake, C.; Rehrauer, H.; Laczko, E.; Kurowski, M.A.; Bujnicki, J.M.; Menigatti, M.; et al. Transcriptome profile of human colorectal adenomas. Mol. Cancer Res. 2007, 5, 1263–1275. [Google Scholar] [CrossRef] [Green Version]
- Khamas, A.; Ishikawa, T.; Shimokawa, K.; Mogushi, K.; Iida, S.; Ishiguro, M.; Mizushima, H.; Tanaka, H.; Uetake, H.; Sugihara, K. Screening for epigenetically masked genes in colorectal cancer Using 5-Aza-2′-deoxycytidine, microarray and gene expression profile. Cancer Genom. Proteom. 2012, 9, 67–75. [Google Scholar]
- Ågesen, T.H.; Berg, M.; Clancy, T.; Thiis-Evensen, E.; Cekaite, L.; Lind, G.E.; Nesland, J.M.; Bakka, A.; Mala, T.; Hauss, H.J.; et al. CLC and IFNAR1 are differentially expressed and a global immunity score is distinct between early- and late-onset colorectal cancer. Genes Immun. 2011, 12, 653–662. [Google Scholar] [CrossRef] [Green Version]
- Danielsen, S.A.; Cekaite, L.; Ågesen, T.H.; Sveen, A.; Nesbakken, A.; Thiis-Evensen, E.; Skotheim, R.I.; Lind, G.E.; Lothe, R.A. Phospholipase C isozymes are deregulated in colorectal cancer—Insights gained from gene set enrichment analysis of the transcriptome. PLoS ONE 2011, 6, e24419. [Google Scholar] [CrossRef] [Green Version]
- Alhopuro, P.; Sammalkorpi, H.; Niittymäki, I.; Biström, M.; Raitila, A.; Saharinen, J.; Nousiainen, K.; Lehtonen, H.J.; Heliövaara, E.; Puhakka, J.; et al. Candidate driver genes in microsatellite-unstable colorectal cancer. Int. J. Cancer 2012, 130, 1558–1566. [Google Scholar] [CrossRef]
- Hong, Y.; Ho, K.S.; Eu, K.W.; Cheah, P.Y. A susceptibility gene set for early onset colorectal cancer that integrates diverse signaling pathways: Implication for tumorigenesis. Clin. Cancer Res. 2007, 13, 1107–1114. [Google Scholar] [CrossRef] [Green Version]
- Berg, M.; Danielsen, S.A.; Ahlquist, T.; Merok, M.A.; Ågesen, T.H.; Vatn, M.H.; Mala, T.; Sjo, O.H.; Bakka, A.; Moberg, I.; et al. DNA Sequence Profiles of the Colorectal Cancer Critical Gene Set KRAS-BRAF-PIK3CA-PTEN-TP53 Related to Age at Disease Onset. PLoS ONE 2010, 5, e13978. [Google Scholar] [CrossRef]
- Berg, M.; Ågesen, T.H.; Thiis-Evensen, E.; Merok, M.A.; Teixeira, M.R.; Vatn, M.H.; Nesbakken, A.; Skotheim, R.I.; Lothe, R.A. Distinct high resolution genome profiles of early onset and late onset colorectal cancer integrated with gene expression data identify candidate susceptibility loci. Mol. Cancer 2010, 9, 100. [Google Scholar] [CrossRef] [Green Version]
- Snipstad, K.; Fenton, C.G.; Kjaeve, J.; Cui, G.; Anderssen, E.; Paulssen, R.H. New specific molecular targets for radio-chemotherapy of rectal cancer. Mol. Oncol. 2010, 4, 52–64. [Google Scholar] [CrossRef] [Green Version]
- Hervieu, C.; Christou, N.; Battu, S.; Mathonnet, M. The Role of Cancer Stem Cells in Colorectal Cancer: From the Basics to Novel Clinical Trials. Cancers 2021, 13, 1092. [Google Scholar] [CrossRef]
- O’Brien, C.A.; Pollett, A.; Gallinger, S.; Dick, J.E. A human colon cancer cell capable of initiating tumour growth in immunodeficient mice. Nature 2007, 445, 106–110. [Google Scholar] [CrossRef]
- Ricci-Vitiani, L.; Lombardi, D.G.; Pilozzi, E.; Biffoni, M.; Todaro, M.; Peschle, C.; De Maria, R. Identification and expansion of human colon-cancer-initiating cells. Nature 2007, 445, 111–115. [Google Scholar] [CrossRef]
- Chao, C.; Carmical, J.R.; Ives, K.L.; Wood, T.G.; Aronson, J.F.; Gomez, G.A.; Djukom, C.D.; Hellmich, M.R. CD133+ colon cancer cells are more interactive with the tumor microenvironment than CD133-cells. Lab. Investig. 2012, 92, 420–436. [Google Scholar] [CrossRef] [Green Version]
- Pfister, T.D.; Reinhold, W.C.; Agama, K.; Gupta, S.; Khin, S.A.; Kinders, R.J.; Parchment, R.E.; Tomaszewski, J.E.; Doroshow, J.H.; Pommier, Y. Topoisomerase I levels in the NCI-60 cancer cell line panel determined by validated ELISA and microarray analysis and correlation with indenoisoquinoline sensitivity. Mol. Cancer Ther. 2009, 8, 1878–1884. [Google Scholar] [CrossRef] [Green Version]
- Kohn, K.W.; Zeeberg, B.M.; Reinhold, W.C.; Pommier, Y. Gene expression correlations in human cancer cell lines define molecular interaction networks for epithelial phenotype. PLoS ONE 2014, 9, e99269. [Google Scholar] [CrossRef] [Green Version]
- Reinhold, W.C.; Sunshine, M.; Varma, S.; Doroshow, J.H.; Pommier, Y. Using CellMiner 1.6 for Systems Pharmacology and Genomic Analysis of the NCI-60. Clin. Cancer Res. 2015, 21, 3841–3852. [Google Scholar] [CrossRef] [Green Version]
- Giovinazzi, S.; Sirleto, P.; Aksenova, V.; Morozov, V.M.; Zori, R.; Reinhold, W.C.; Ishov, A.M. Usp7 protects genomic stability by regulating Bub3. Oncotarget 2014, 5, 3728–3742. [Google Scholar] [CrossRef] [Green Version]
- Provenzani, A.; Fronza, R.; Loreni, F.; Pascale, A.; Amadio, M.; Quattrone, A. Global alterations in mRNA polysomal recruitment in a cell model of colorectal cancer progression to metastasis. Carcinogenesis 2006, 27, 1323–1333. [Google Scholar] [CrossRef] [Green Version]
- Tsukamoto, S.; Ishikawa, T.; Iida, S.; Ishiguro, M.; Mogushi, K.; Mizushima, H.; Uetake, H.; Tanaka, H.; Sugihara, K. Clinical significance of osteoprotegerin expression in human colorectal cancer. Clin. Cancer Res. 2011, 17, 2444–2450. [Google Scholar] [CrossRef] [Green Version]
- Tsuji, S.; Midorikawa, Y.; Takahashi, T.; Yagi, K.; Takayama, T.; Yoshida, K.; Sugiyama, Y.; Aburatani, H. Potential responders to FOLFOX therapy for colorectal cancer by Random Forests analysis. Br. J. Cancer 2012, 106, 126–132. [Google Scholar] [CrossRef] [Green Version]
- Menyhart, O.; Kakisaka, T.; Pongor, L.S.; Uetake, H.; Goel, A.; Győrffy, B. Uncovering Potential Therapeutic Targets in Colorectal Cancer by Deciphering Mutational Status and Expression of Druggable Oncogenes. Cancers 2019, 11, 983. [Google Scholar] [CrossRef] [Green Version]
- Bandrés, E.; Malumbres, R.; Cubedo, E.; Honorato, B.; Zarate, R.; Labarga, A.; Gabisu, U.; Sola, J.J.; García-Foncillas, J. A gene signature of 8 genes could identify the risk of recurrence and progression in Dukes’ B colon cancer patients. Oncol. Rep. 2007, 17, 1089–1094. [Google Scholar] [CrossRef] [Green Version]
- Gröne, J.; Lenze, D.; Jurinovic, V.; Hummel, M.; Seidel, H.; Leder, G.; Beckmann, G.; Sommer, A.; Grützmann, R.; Pilarsky, C.; et al. Molecular profiles and clinical outcome of stage UICC II colon cancer patients. Int. J. Colorectal Dis. 2011, 26, 847–858. [Google Scholar] [CrossRef]
- López-Ayllón, B.D.; de Castro-Carpeño, J.; Rodriguez, C.; Pernía, O.; Ibañez de Cáceres, I.; Belda-Iniesta, C.; Perona, R.; Sastre, L. Biomarkers of erlotinib response in non-small cell lung cancer tumors that do not harbor the more common epidermal growth factor receptor mutations. Int. J. Clin. Exp. Pathol. 2015, 8, 2888–2898. [Google Scholar]
- Arcaroli, J.J.; Quackenbush, K.S.; Powell, R.W.; Pitts, T.M.; Spreafico, A.; Varella-Garcia, M.; Bemis, L.; Tan, A.C.; Reinemann, J.M.; Touban, B.M.; et al. Common PIK3CA mutants and a novel 3′ UTR mutation are associated with increased sensitivity to saracatinib. Clin. Cancer Res. 2012, 18, 2704–2714. [Google Scholar] [CrossRef] [Green Version]
- Selga, E.; Morales, C.; Noé, V.; Peinado, M.A.; Ciudad, C.J. Role of caveolin 1, E-cadherin, Enolase 2 and PKCalpha on resistance to methotrexate in human HT29 colon cancer cells. BMC Med. Genom. 2008, 1, 35. [Google Scholar] [CrossRef] [Green Version]
- Selga, E.; Oleaga, C.; Ramírez, S.; de Almagro, M.C.; Noé, V.; Ciudad, C.J. Networking of differentially expressed genes in human cancer cells resistant to methotrexate. Genome Med. 2009, 1, 83. [Google Scholar] [CrossRef] [Green Version]
- Mencia, N.; Selga, E.; Noé, V.; Ciudad, C.J. Underexpression of miR-224 in methotrexate resistant human colon cancer cells. Biochem. Pharmacol. 2011, 82, 1572–1582. [Google Scholar] [CrossRef]
- Hua, F.; Shang, S.; Yang, Y.; Zhang, H.; Xu, T.; Yu, J.; Zhou, D.; Cui, B.; Li, K.; Lv, X.; et al. TRIB3 Interacts With β-Catenin and TCF4 to Increase Stem Cell Features of Colorectal Cancer Stem Cells and Tumorigenesis. Gastroenterology 2019, 156, 708–721.e15. [Google Scholar] [CrossRef] [Green Version]
- Lin, S.; Yang, L.; Shi, H.; Du, W.; Qi, Y.; Qiu, C.; Liang, X.; Shi, W.; Liu, J. Endoplasmic reticulum-targeting photosensitizer Hypericin confers chemo-sensitization towards oxaliplatin through inducing pro-death autophagy. Int. J. Biochem. Cell Biol. 2017, 87, 54–68. [Google Scholar] [CrossRef]
- Tsai, D.-H.; Chung, C.-H.; Lee, K.-T. Antrodia cinnamomea induces autophagic cell death via the CHOP/TRB3/Akt/mTOR pathway in colorectal cancer cells. Sci. Rep. 2018, 8, 17424. [Google Scholar] [CrossRef]
- Hwang, W.-L.; Yang, M.-H.; Tsai, M.-L.; Lan, H.-Y.; Su, S.-H.; Chang, S.-C.; Teng, H.-W.; Yang, S.-H.; Lan, Y.-T.; Chiou, S.-H.; et al. SNAIL regulates interleukin-8 expression, stem cell-like activity, and tumorigenicity of human colorectal carcinoma cells. Gastroenterology 2011, 141, 279–291.e5. [Google Scholar] [CrossRef] [Green Version]
- Kim, J.-S.; Lee, C.; Bonifant, C.L.; Ressom, H.; Waldman, T. Activation of p53-dependent growth suppression in human cells by mutations in PTEN or PIK3CA. Mol. Cell. Biol. 2007, 27, 662–677. [Google Scholar] [CrossRef] [Green Version]
- Yoon, H.; Liyanarachchi, S.; Wright, F.A.; Davuluri, R.; Lockman, J.C.; de la Chapelle, A.; Pellegata, N.S. Gene expression profiling of isogenic cells with different TP53 gene dosage reveals numerous genes that are affected by TP53 dosage and identifies CSPG2 as a direct target of p53. Proc. Natl. Acad. Sci. USA 2002, 99, 15632–15637. [Google Scholar] [CrossRef] [Green Version]
- Mokry, M.; Hatzis, P.; Schuijers, J.; Lansu, N.; Ruzius, F.-P.; Clevers, H.; Cuppen, E. Integrated genome-wide analysis of transcription factor occupancy, RNA polymerase II binding and steady-state RNA levels identify differentially regulated functional gene classes. Nucleic Acids Res. 2012, 40, 148–158. [Google Scholar] [CrossRef] [PubMed] [Green Version]
- Theng, S.S.; Wang, W.; Mah, W.-C.; Chan, C.; Zhuo, J.; Gao, Y.; Qin, H.; Lim, L.; Chong, S.S.; Song, J.; et al. Disruption of FAT10-MAD2 binding inhibits tumor progression. Proc. Natl. Acad. Sci. USA 2014, 111, E5282–E5291. [Google Scholar] [CrossRef] [PubMed] [Green Version]
- Connolly, K.; Mitter, R.; Muir, M.; Jodrell, D.; Guichard, S. Stable XIAP knockdown clones of HCT116 colon cancer cells are more sensitive to TRAIL, taxanes and irradiation in vitro. Cancer Chemother. Pharmacol. 2009, 64, 307–316. [Google Scholar] [CrossRef] [PubMed]
- Ogawara, Y.; Kishishita, S.; Obata, T.; Isazawa, Y.; Suzuki, T.; Tanaka, K.; Masuyama, N.; Gotoh, Y. Akt enhances Mdm2-mediated ubiquitination and degradation of p53. J. Biol. Chem. 2002, 277, 21843–21850. [Google Scholar] [CrossRef] [PubMed] [Green Version]
- Katkoori, V.R.; Shanmugam, C.; Jia, X.; Vitta, S.P.; Sthanam, M.; Callens, T.; Messiaen, L.; Chen, D.; Zhang, B.; Bumpers, H.L.; et al. Prognostic significance and gene expression profiles of p53 mutations in microsatellite-stable stage III colorectal adenocarcinomas. PLoS ONE 2012, 7, e30020. [Google Scholar] [CrossRef] [PubMed] [Green Version]
- Stambolic, V.; Suzuki, A.; de la Pompa, J.L.; Brothers, G.M.; Mirtsos, C.; Sasaki, T.; Ruland, J.; Penninger, J.M.; Siderovski, D.P.; Mak, T.W. Negative regulation of PKB/Akt-dependent cell survival by the tumor suppressor PTEN. Cell 1998, 95, 29–39. [Google Scholar] [CrossRef] [Green Version]
- Link, W. Tribbles breaking bad: TRIB2 suppresses FOXO and acts as an oncogenic protein in melanoma. Biochem. Soc. Trans. 2015, 43, 1085–1088. [Google Scholar] [CrossRef]
- Hipp, M.S.; Kalveram, B.; Raasi, S.; Groettrup, M.; Schmidtke, G. FAT10, a ubiquitin-independent signal for proteasomal degradation. Mol. Cell. Biol. 2005, 25, 3483–3491. [Google Scholar] [CrossRef] [Green Version]
- Lundemo, A.G.; Pettersen, C.H.; Berge, K.; Berge, R.K.; Schønberg, S.A. Tetradecylthioacetic acid inhibits proliferation of human SW620 colon cancer cells-gene expression profiling implies endoplasmic reticulum stress. Lipids Health Dis. 2011, 10, 190. [Google Scholar] [CrossRef] [Green Version]
- Sheng, J.; Sun, H.; Yu, F.-B.; Li, B.; Zhang, Y.; Zhu, Y.-T. The Role of Cyclooxygenase-2 in Colorectal Cancer. Int. J. Med. Sci. 2020, 17, 1095–1101. [Google Scholar] [CrossRef]
- Veettil, S.K.; Nathisuwan, S.; Ching, S.M.; Jinatongthai, P.; Lim, K.G.; Kew, S.T.; Chaiyakunapruk, N. Efficacy and safety of celecoxib on the incidence of recurrent colorectal adenomas: A systematic review and meta-analysis. Cancer Manag. Res. 2019, 11, 561–571. [Google Scholar] [CrossRef] [PubMed] [Green Version]
- Grösch, S.; Maier, T.J.; Schiffmann, S.; Geisslinger, G. Cyclooxygenase-2 (COX-2)–Independent Anticarcinogenic Effects of Selective COX-2 Inhibitors. JNCI J. Natl. Cancer Inst. 2006, 98, 736–747. [Google Scholar] [CrossRef] [Green Version]
- Auman, J.T.; Church, R.; Lee, S.-Y.; Watson, M.A.; Fleshman, J.W.; Mcleod, H.L. Celecoxib pre-treatment in human colorectal adenocarcinoma patients is associated with gene expression alterations suggestive of diminished cellular proliferation. Eur. J. Cancer 2008, 44, 1754–1760. [Google Scholar] [CrossRef] [PubMed] [Green Version]
- González-Vallinas, M.; Molina, S.; Vicente, G.; Zarza, V.; Martín-Hernández, R.; García-Risco, M.R.; Fornari, T.; Reglero, G.; Ramírez de Molina, A. Expression of microRNA-15b and the glycosyltransferase GCNT3 correlates with antitumor efficacy of Rosemary diterpenes in colon and pancreatic cancer. PLoS ONE 2014, 9, e98556. [Google Scholar] [CrossRef] [Green Version]
- Schoumacher, M.; Hurov, K.E.; Lehár, J.; Yan-Neale, Y.; Mishina, Y.; Sonkin, D.; Korn, J.M.; Flemming, D.; Jones, M.D.; Antonakos, B.; et al. Inhibiting Tankyrases sensitizes KRAS-mutant cancer cells to MEK inhibitors via FGFR2 feedback signaling. Cancer Res. 2014, 74, 3294–3305. [Google Scholar] [CrossRef] [Green Version]
- Berkofsky-Fessler, W.; Nguyen, T.Q.; Delmar, P.; Molnos, J.; Kanwal, C.; DePinto, W.; Rosinski, J.; McLoughlin, P.; Ritland, S.; DeMario, M.; et al. Preclinical biomarkers for a cyclin-dependent kinase inhibitor translate to candidate pharmacodynamic biomarkers in phase I patients. Mol. Cancer Ther. 2009, 8, 2517–2525. [Google Scholar] [CrossRef] [Green Version]
- West, J.D.; Marnett, L.J. Alterations in gene expression induced by the lipid peroxidation product, 4-hydroxy-2-nonenal. Chem. Res. Toxicol. 2005, 18, 1642–1653. [Google Scholar] [CrossRef]
- Luesch, H.; Chanda, S.K.; Raya, R.M.; DeJesus, P.D.; Orth, A.P.; Walker, J.R.; Izpisúa Belmonte, J.C.; Schultz, P.G. A functional genomics approach to the mode of action of apratoxin A. Nat. Chem. Biol. 2006, 2, 158–167. [Google Scholar] [CrossRef]
- Gasparovic, A.C.; Milkovic, L.; Sunjic, S.B.; Zarkovic, N. Cancer growth regulation by 4-hydroxynonenal. Free Radic. Biol. Med. 2017, 111, 226–234. [Google Scholar] [CrossRef]
- Wu, J.; Tao, W.-W.; Chong, D.-Y.; Lai, S.-S.; Wang, C.; Liu, Q.; Zhang, T.-Y.; Xue, B.; Li, C.-J. Early growth response-1 negative feedback regulates skeletal muscle postprandial insulin sensitivity via activating Ptp1b transcription. FASEB J. 2018, 32, 4370–4379. [Google Scholar] [CrossRef] [Green Version]
- Miyoshi, N.; Ishii, H.; Mimori, K.; Takatsuno, Y.; Kim, H.; Hirose, H.; Sekimoto, M.; Doki, Y.; Mori, M. Abnormal expression of TRIB3 in colorectal cancer: A novel marker for prognosis. Br. J. Cancer 2009, 101, 1664–1670. [Google Scholar] [CrossRef] [Green Version]
- O’Connor, C.; Yalla, K.; Salomé, M.; Moka, H.A.; Castañeda, E.G.; Eyers, P.A.; Keeshan, K. Trib2 expression in granulocyte-monocyte progenitors drives a highly drug resistant acute myeloid leukaemia linked to elevated Bcl2. Oncotarget 2018, 9, 14977–14992. [Google Scholar] [CrossRef] [PubMed]
- Wang, J.; Zuo, J.; Wahafu, A.; Wang, M.; Li, R.-C.; Xie, W.-F. Combined elevation of TRIB2 and MAP3K1 indicates poor prognosis and chemoresistance to temozolomide in glioblastoma. CNS Neurosci. Ther. 2020, 26, 297–308. [Google Scholar] [CrossRef] [PubMed] [Green Version]
- Ohoka, N.; Yoshii, S.; Hattori, T.; Onozaki, K.; Hayashi, H. TRB3, a novel ER stress-inducible gene, is induced via ATF4-CHOP pathway and is involved in cell death. EMBO J. 2005, 24, 1243–1255. [Google Scholar] [CrossRef] [PubMed]
- Petiwala, S.M.; Johnson, J.J. Diterpenes from rosemary (Rosmarinus officinalis): Defining their potential for anti-cancer activity. Cancer Lett. 2015, 367, 93–102. [Google Scholar] [CrossRef]
- Moore, J.; Yousef, M.; Tsiani, E. Anticancer Effects of Rosemary (Rosmarinus officinalis L.) Extract and Rosemary Extract Polyphenols. Nutrients 2016, 8, 731. [Google Scholar] [CrossRef]
- Valdés, A.; Sullini, G.; Ibáñez, E.; Cifuentes, A.; García-Cañas, V. Rosemary polyphenols induce unfolded protein response and changes in cholesterol metabolism in colon cancer cells. J. Funct. Foods 2015, 15, 429–439. [Google Scholar] [CrossRef]
- Valdés, A.; Artemenko, K.A.; Bergquist, J.; García-Cañas, V.; Cifuentes, A. Comprehensive Proteomic Study of the Antiproliferative Activity of a Polyphenol-Enriched Rosemary Extract on Colon Cancer Cells Using Nanoliquid Chromatography–Orbitrap MS/MS. J. Proteome Res. 2016, 15, 1971–1985. [Google Scholar] [CrossRef] [Green Version]
- Yan, M.; Li, G.; Petiwala, S.M.; Householter, E.; Johnson, J.J. Standardized rosemary (Rosmarinus officinalis) extract induces Nrf2/sestrin-2 pathway in colon cancer cells. J. Funct. Foods 2015, 13, 137–147. [Google Scholar] [CrossRef]
- Hill, R.; Madureira, P.A.; Ferreira, B.; Baptista, I.; Machado, S.; Colaço, L.; dos Santos, M.; Liu, N.; Dopazo, A.; Ugurel, S.; et al. TRIB2 confers resistance to anti-cancer therapy by activating the serine/threonine protein kinase AKT. Nat. Commun. 2017, 8, 14687. [Google Scholar] [CrossRef]
- Moore, J.; Megaly, M.; MacNeil, A.J.; Klentrou, P.; Tsiani, E. Rosemary extract reduces Akt/mTOR/p70S6K activation and inhibits proliferation and survival of A549 human lung cancer cells. Biomed. Pharmacother. 2016, 83, 725–732. [Google Scholar] [CrossRef] [PubMed]
- Uchida, K. 4-Hydroxy-2-nonenal: A product and mediator of oxidative stress. Prog. Lipid Res. 2003, 42, 318–343. [Google Scholar] [CrossRef]
- Ji, C.; Amarnath, V.; Pietenpol, J.A.; Marnett, L.J. 4-hydroxynonenal induces apoptosis via caspase-3 activation and cytochrome c release. Chem. Res. Toxicol. 2001, 14, 1090–1096. [Google Scholar] [CrossRef]
- Bao, X.-Y.; Sun, M.; Peng, T.-T.; Han, D.-M. TRIB3 promotes proliferation, migration, and invasion of retinoblastoma cells by activating the AKT/mTOR signaling pathway. Cancer Biomark. 2021, 31, 307–315. [Google Scholar] [CrossRef]
- Shen, P.; Zhang, T.-Y.; Wang, S.-Y. TRIB3 promotes oral squamous cell carcinoma cell proliferation by activating the AKT signaling pathway. Exp. Ther. Med. 2021, 21, 313. [Google Scholar] [CrossRef]
- Wennemers, M.; Stegeman, H.; Bussink, J.; Versleijen-Jonkers, Y.M.H.; van Laarhoven, H.W.M.; Raleigh, J.A.; Varia, M.A.; Sweep, F.C.G.J.; Span, P.N. Hypoxia regulation of phosphokinases and the prognostic value of pAKT in breast cancer. Int. J. Biol. Markers 2013, 28, 151–160. [Google Scholar] [CrossRef] [PubMed]
- Qu, J.; Liu, B.; Li, B.; Du, G.; Li, Y.; Wang, J.; He, L.; Wan, X. TRIB3 suppresses proliferation and invasion and promotes apoptosis of endometrial cancer cells by regulating the AKT signaling pathway. OncoTargets Ther. 2019, 12, 2235–2245. [Google Scholar] [CrossRef] [PubMed] [Green Version]
- Salazar, M.; Lorente, M.; García-Taboada, E.; Gómez, E.P.; Dávila, D.; Zúñiga-García, P.; Flores, J.M.; Rodríguez, A.; Hegedus, Z.; Mosén-Ansorena, D.; et al. TRIB3 suppresses tumorigenesis by controlling mTORC2/AKT/FOXO signaling. Mol. Cell. Oncol. 2015, 2, e980134. [Google Scholar] [CrossRef]
- Salazar, M.; Lorente, M.; García-Taboada, E.; Pérez Gómez, E.; Dávila, D.; Zúñiga-García, P.; María Flores, J.; Rodríguez, A.; Hegedus, Z.; Mosén-Ansorena, D.; et al. Loss of Tribbles pseudokinase-3 promotes Akt-driven tumorigenesis via FOXO inactivation. Cell Death Differ. 2015, 22, 131–144. [Google Scholar] [CrossRef] [Green Version]
- Lee, C.G.L.; Ren, J.; Cheong, I.S.Y.; Ban, K.H.K.; Ooi, L.L.P.J.; Yong Tan, S.; Kan, A.; Nuchprayoon, I.; Jin, R.; Lee, K.-H.; et al. Expression of the FAT10 gene is highly upregulated in hepatocellular carcinoma and other gastrointestinal and gynecological cancers. Oncogene 2003, 22, 2592–2603. [Google Scholar] [CrossRef] [Green Version]
- Gao, Y.; Theng, S.S.; Zhuo, J.; Teo, W.B.; Ren, J.; Lee, C.G.L. FAT10, an ubiquitin-like protein, confers malignant properties in non-tumorigenic and tumorigenic cells. Carcinogenesis 2014, 35, 923–934. [Google Scholar] [CrossRef] [PubMed] [Green Version]
- Liu, L.; Dong, Z.; Liang, J.; Cao, C.; Sun, J.; Ding, Y.; Wu, D. As an independent prognostic factor, FAT10 promotes hepatitis B virus-related hepatocellular carcinoma progression via Akt/GSK3β pathway. Oncogene 2014, 33, 909–920. [Google Scholar] [CrossRef] [PubMed] [Green Version]
- Zou, Y.; Du, Y.; Cheng, C.; Deng, X.; Shi, Z.; Lu, X.; Hu, H.; Qiu, J.; Jiang, W. FAT10 promotes the progression of bladder cancer by upregulating HK2 through the EGFR/AKT pathway. Exp. Cell Res. 2021, 398, 112401. [Google Scholar] [CrossRef] [PubMed]
- Cancer Genome Atlas Network. Comprehensive molecular characterization of human colon and rectal cancer. Nature 2012, 487, 330–337. [Google Scholar] [CrossRef] [PubMed] [Green Version]
- Goldman, M.J.; Craft, B.; Hastie, M.; Repečka, K.; McDade, F.; Kamath, A.; Banerjee, A.; Luo, Y.; Rogers, D.; Brooks, A.N.; et al. Visualizing and interpreting cancer genomics data via the Xena platform. Nat. Biotechnol. 2020, 38, 675–678. [Google Scholar] [CrossRef] [PubMed]
- Ghandi, M.; Huang, F.W.; Jané-Valbuena, J.; Kryukov, G.V.; Lo, C.C.; McDonald, E.R.; Barretina, J.; Gelfand, E.T.; Bielski, C.M.; Li, H.; et al. Next-generation characterization of the Cancer Cell Line Encyclopedia. Nature 2019, 569, 503–508. [Google Scholar] [CrossRef] [PubMed]
Figure 1.
TRIB1, TRIB2, and TRIB3 gene expression in colorectal tumors compared to controls. (A–C): Colorectal adenomas (pedunculated colorectal polyps) (Tumor, n = 32) compared to paired normal mucosa, i.e., normal colon from the same individual (Control, n = 32) (GDS2947). (D–F): CRC overt tumors, from patients with different gender and ages, in different stages (Tumor, n = 17) compared to paired adjacent non-cancerous tissues (Control, n = 17). (GDS4382). (G–I): Primary CRC tumors from male patients diagnosed at an advanced age (69 to 87 years; late onset) (Tumor, n = 11) compared to normal controls, i.e., normal colonic mucosa samples (Control, n = 3) (GDS5232). (J–L): Normal colonic mucosa (Control, n = 15) compared to colorectal adenocarcinomas (both hereditary and sporadic) with microsatellite instability (Tumor, n = 34) (GDS4515). Independent datasets were analyzed, and samples plotted individually. TRIB1 ((A,D,J)—202241_at; (G)—150749), TRIB2 ((B,E,K)—202478_at; (H)—188922) and TRIB3 ((C,F,L)—218145_at; (I)—113737) gene expression is represented as arbitrary units (AU). Wilcoxon paired test (A–E), paired two-tailed t test (I), unpaired two-tailed t test (G,H), t test with Welch’s correction (F), or Mann–Whitney U test (J–L) was performed, and the p value is represented for each graph. The horizontal bars represent the mean of the values in each group.

Figure 2.
TRIB1, TRIB2, and TRIB3 gene expression in normal-appearing colon tissues adjacent to colorectal tumors compared to healthy control mucosa. (A–C): Normal-appearing colonic mucosa of early onset colorectal cancer (CRC) Chinese patients without a prior family history of CRC (Tumor, n = 10), whose tumors were classified as microsatellite-stable, age equal or lower than 50, compared to healthy control mucosa, i.e., normal colon from healthy controls (Control, n = 12) (GDS2609). TRIB1 ((A)—202241_at), TRIB2 ((B)—202478_at), and TRIB3 ((C)—218145_at) gene expression is represented as arbitrary units (AU). Unpaired two-tailed t test (C), t test with Welch’s correction (A), or Mann–Whitney U test (B) was performed, and the p value is represented for each graph. The horizontal bars represent the mean of the values in each group.

Figure 3.
TRIB1, TRIB2, and TRIB3 gene expression in rectal adenocarcinoma samples. (A–C): Normal and tumor tissue specimens from patients with resectable adenocarcinoma of the rectum, before (n = 10 Normal vs. n = 13 Tumor) and after (n = 10 Normal vs. n = 9 Tumor) preoperative neoadjuvant radio-chemotherapy (RCT) treatment (GDS3756). Samples are plotted individually. TRIB1 ((A)—150749), TRIB2 ((B)—188922), and TRIB3 ((C)—113737) gene expression is represented as arbitrary units (AU). Independent unpaired two-tailed t test with Welch’s correction (A) or Mann–Whitney U test (B,C) were performed and only statistically significant changes (p < 0.05) between groups are denoted. The horizontal bars represent the mean of the values in each group.

Figure 4.
TRIB1, TRIB2, and TRIB3 gene expression in colorectal cancer (CRC) cells compared to carcinoma associated fibroblasts. (A–C): Carcinoma associated fibroblasts (CAFs), CD133-negative, and CD133-positive CRC cells isolated from stage II patient samples (GDS4385). Samples are plotted individually (n = 3). TRIB1 ((A)—202241_at), TRIB2 ((B)—202478_at), and TRIB3 ((C)—218145_at) gene expression is represented as arbitrary units (AU). Ordinary one-way ANOVA was performed, and the p value is represented for each graph. The horizontal bars represent the mean of the values in each group.

Figure 5.
TRIB1, TRIB2, and TRIB3 gene expression in CRC tumors with different staging. (A–C): CRC tumors representing various stages (n = 4–24 each group) (GDS4516), including patients with no metastasis, patients with metastatic recurrence after surgery, and patients with distant metastases. Samples are plotted individually. TRIB1 ((A)—202241_at), TRIB2 ((B)—202478_at), and TRIB3 ((C)—218145_at) gene expression is represented as arbitrary units (AU). Kruskal–Wallis test was performed, and the p value is represented for each graph. The horizontal bars represent the mean of the values in each group.

Figure 6.
TRIB1 and TRIB2 gene expression in colorectal adenocarcinoma from patients treated with celecoxib. A single dataset was analyzed (GDS3384), and samples plotted individually. TRIB1 ((A)—35597_at) and TRIB2 ((B)—40113_at) gene expression from patients pre-treated with cyclooxygenase-2 (COX-2) inhibitor celecoxib (400 mg twice a day) for 7 days prior to colorectal adenocarcinoma resection (Celecoxib, n = 11), compared to non-treated patients (Control, n = 12), is represented as arbitrary units (AU). Unpaired two-tailed t test with Welch’s correction (B), or Mann–Whitney U test (A) was performed, and the p value is represented for each graph. There was no assay probe for TRIB3. The horizontal bars represent the mean of the values in each group.

Publisher’s Note: MDPI stays neutral with regard to jurisdictional claims in published maps and institutional affiliations. |
© 2021 by the authors. Licensee MDPI, Basel, Switzerland. This article is an open access article distributed under the terms and conditions of the Creative Commons Attribution (CC BY) license (https://creativecommons.org/licenses/by/4.0/).
Share and Cite
MDPI and ACS Style
Fernandes, M.T.; Yassuda, V.; Bragança, J.; Link, W.; Ferreira, B.I.; De Sousa-Coelho, A.L. Tribbles Gene Expression Profiles in Colorectal Cancer. Gastrointest. Disord. 2021, 3, 218-236. https://doi.org/10.3390/gidisord3040021
AMA Style
Fernandes MT, Yassuda V, Bragança J, Link W, Ferreira BI, De Sousa-Coelho AL. Tribbles Gene Expression Profiles in Colorectal Cancer. Gastrointestinal Disorders. 2021; 3(4):218-236. https://doi.org/10.3390/gidisord3040021
Chicago/Turabian StyleFernandes, Mónica T., Victor Yassuda, José Bragança, Wolfgang Link, Bibiana I. Ferreira, and Ana Luísa De Sousa-Coelho. 2021. "Tribbles Gene Expression Profiles in Colorectal Cancer" Gastrointestinal Disorders 3, no. 4: 218-236. https://doi.org/10.3390/gidisord3040021